| Param | Original file | Final file |
|---|---|---|
| Filename | modeM0/AS1T04_069T01_9000005158_36088cztM0_level2.evt | modeM0/AS1T04_069T01_9000005158_36088cztM0_level2_quad_clean.evt |
| Size (bytes) | 423,702,720 | 46,437,120 |
| Size | 404.1 MB | 44.3 MB |
| Events in quadrant A | 2,612,372 | 268,181 |
| Events in quadrant B | 3,159,507 | 271,015 |
| Events in quadrant C | 3,107,431 | 258,005 |
| Events in quadrant D | 3,601,835 | 246,629 |
| Mode M0 | |||
|---|---|---|---|
| Quadrant | BADHDUFLAG | Total packets | Discarded packets |
| A | 0 | 10729 | 3 |
| B | 0 | 12513 | 2 |
| C | 0 | 12079 | 2 |
| D | 0 | 14013 | 2 |
| Mode M9 | |||
|---|---|---|---|
| Quadrant | BADHDUFLAG | Total packets | Discarded packets |
| A | 0 | 36 | 0 |
| B | 0 | 36 | 0 |
| C | 0 | 36 | 0 |
| D | 0 | 37 | 0 |
| Mode SS | |||
|---|---|---|---|
| Quadrant | BADHDUFLAG | Total packets | Discarded packets |
| A | 0 | 104 | 0 |
| B | 0 | 104 | 0 |
| C | 0 | 104 | 0 |
| D | 0 | 104 | 0 |
| Quadrant | Total seconds | Saturated seconds | Saturation percentage |
|---|---|---|---|
| A | 5167 | 7 | 0.135475% |
| B | 5167 | 110 | 2.128895% |
| C | 5167 | 137 | 2.651442% |
| D | 5167 | 181 | 3.503000% |
Noise dominated data is calculated using 1-second bins in cleaned event files. If a bin has >2000 counts, and if more than 50% of those come from <1% of pixels, then it is considered to be noise-dominated and hence unusable.
| Quadrant | # 1 sec bins | Bins with >0 counts | Bins with >2000 counts | High rate bins dominated by noise | Noise dominated (total time) | Noise dominated (detector-on time) | Marked lightcurve |
|---|---|---|---|---|---|---|---|
| A | 7290 | 5168 | 0 | 0 | 0.00% | 0.00% | 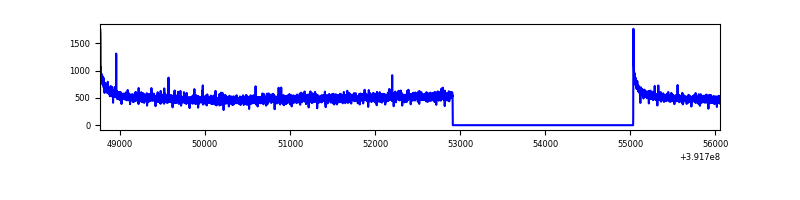 |
| B | 7290 | 5168 | 74 | 74 | 1.02% | 1.43% | 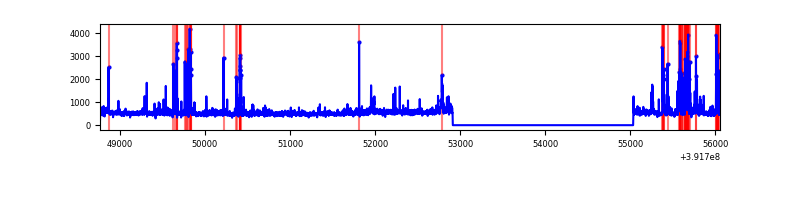 |
| C | 7290 | 5168 | 108 | 108 | 1.48% | 2.09% | 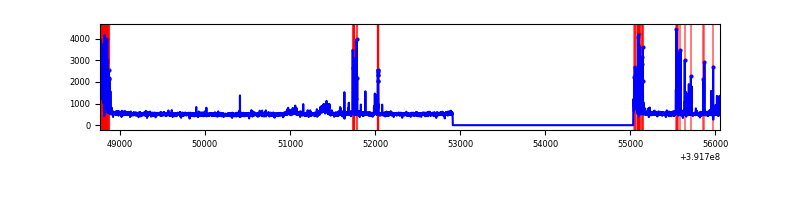 |
| D | 7290 | 5168 | 154 | 154 | 2.11% | 2.98% | 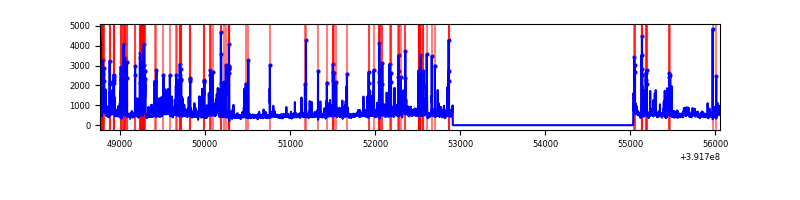 |
Top three noisy pixels from each quadrant. If the there are fewer than three noisy pixels in the level2.evt file, extra rows are filled as -1
| Pixel properties | Quadrant properties | ||||||
|---|---|---|---|---|---|---|---|
| Quadrant | DetID | PixID | Counts | Sigma | Mean | Median | Sigma |
| A | 10 | 83 | 169609 | 1320.7 | 631 | 621 | 128.0 |
| A | 13 | 254 | 7485 | 53.64 | 631 | 621 | 128.0 |
| A | 3 | 137 | 6128 | 43.04 | 631 | 621 | 128.0 |
| B | 5 | 172 | 428648 | 3578.06 | 625 | 608 | 119.6 |
| B | 0 | 190 | 116420 | 968.09 | 625 | 608 | 119.6 |
| B | 0 | 229 | 57278 | 473.71 | 625 | 608 | 119.6 |
| C | 0 | 10 | 331383 | 2350.84 | 608 | 613 | 140.7 |
| C | 15 | 214 | 215132 | 1524.62 | 608 | 613 | 140.7 |
| C | 10 | 49 | 86186 | 608.18 | 608 | 613 | 140.7 |
| D | 12 | 6 | 397704 | 2673.24 | 604 | 588 | 148.6 |
| D | 12 | 233 | 208766 | 1401.38 | 604 | 588 | 148.6 |
| D | 13 | 249 | 162603 | 1090.63 | 604 | 588 | 148.6 |
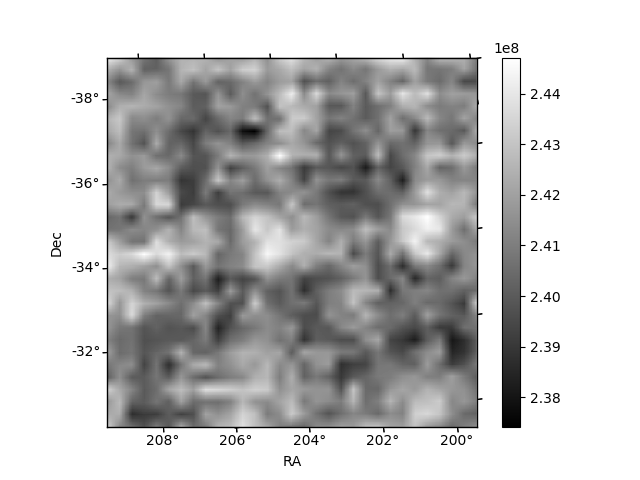
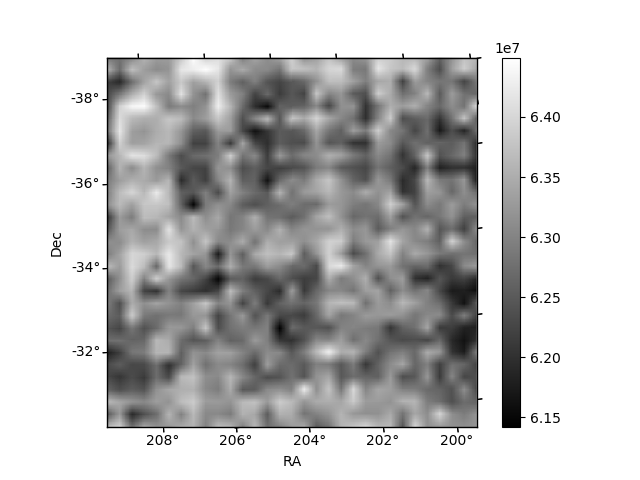
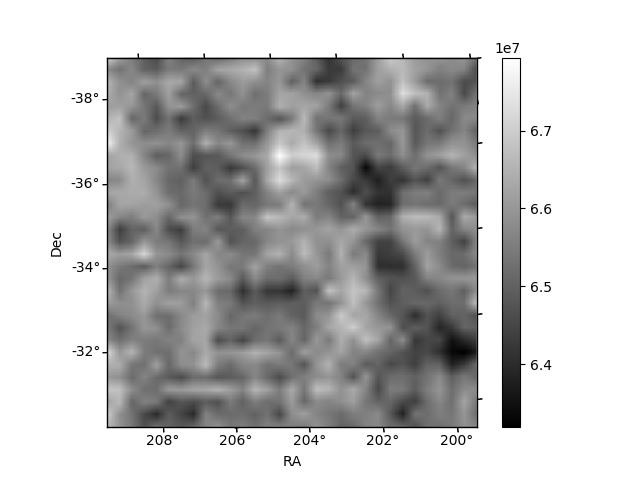
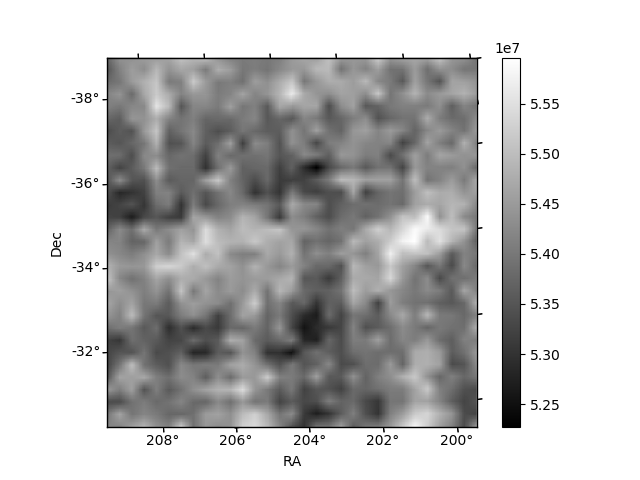
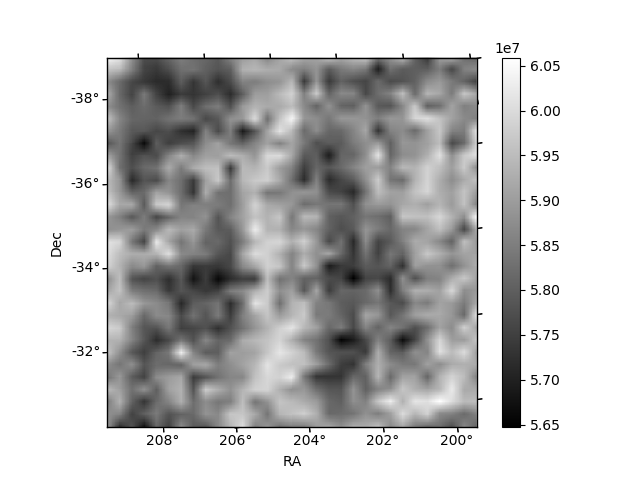
Histogram calculated using DETX and DETY for each event in the final _common_clean file
| Quadrant A | 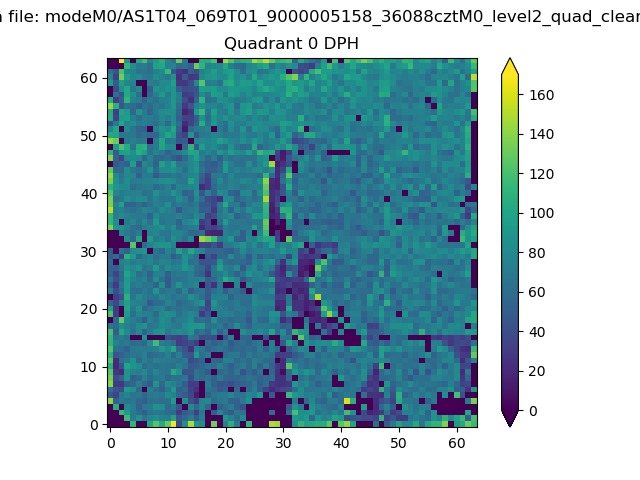 |
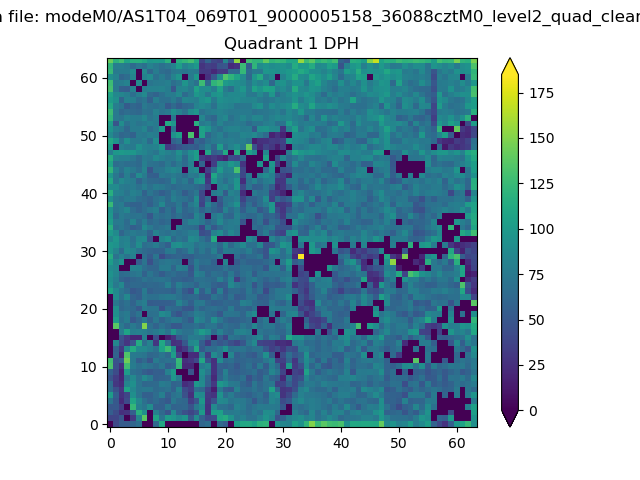 |
Quadrant B |
|---|---|---|---|
| Quadrant D | 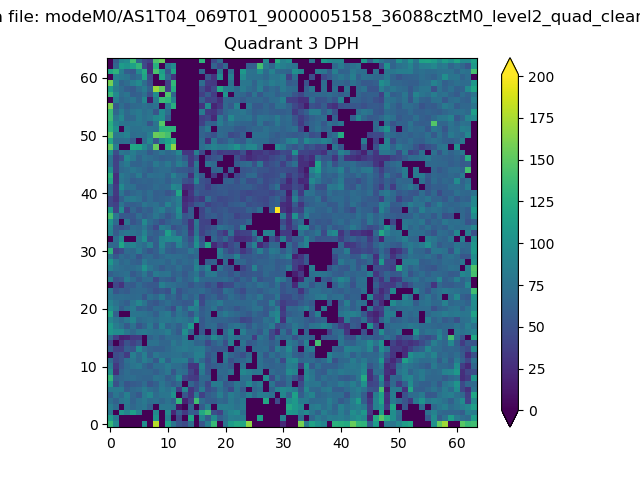 |
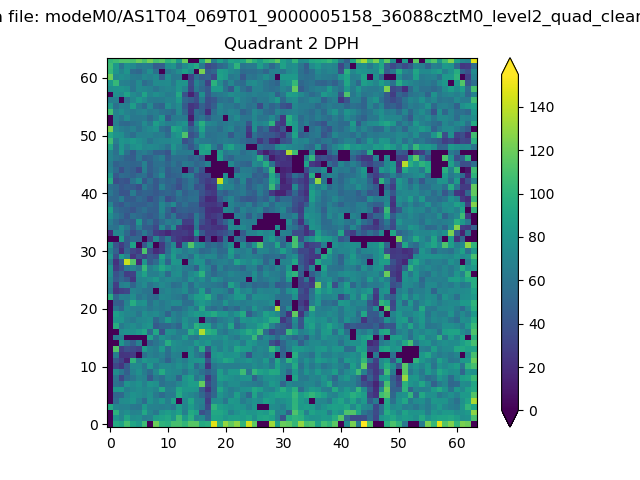 |
Quadrant C |
| Plot type | Count rate plots | Images |
|---|---|---|
| Comparison with Poisson distribution Blue bars denote a histogram of data divided into 1 sec bins. Red curve is a Poisson curve with rate = median count rate of data. |
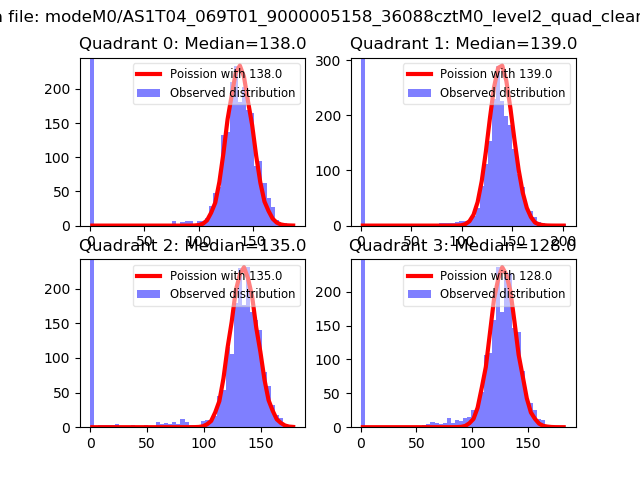 |
 |
| Quadrant-wise count rates Data is divided into 100 sec bins |
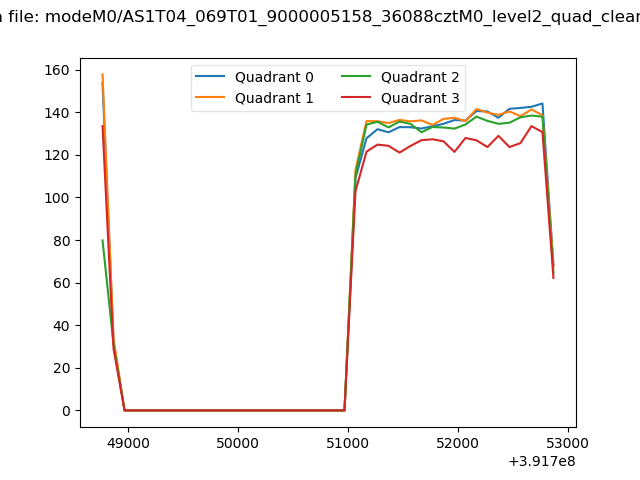 |
|
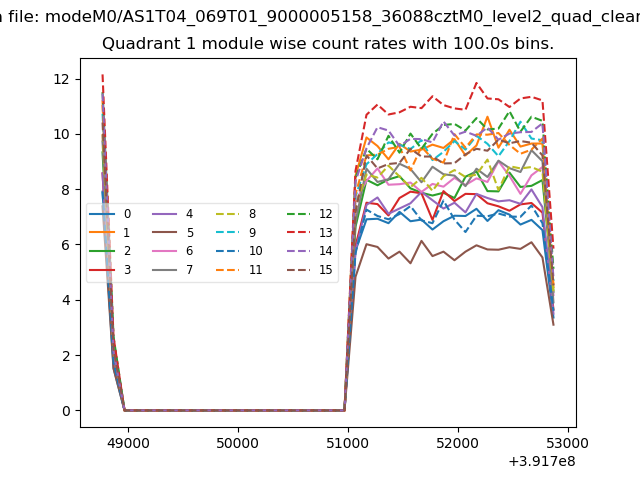
| Module-wise count rates for Quadrant A Data is divided into 100 sec bins |
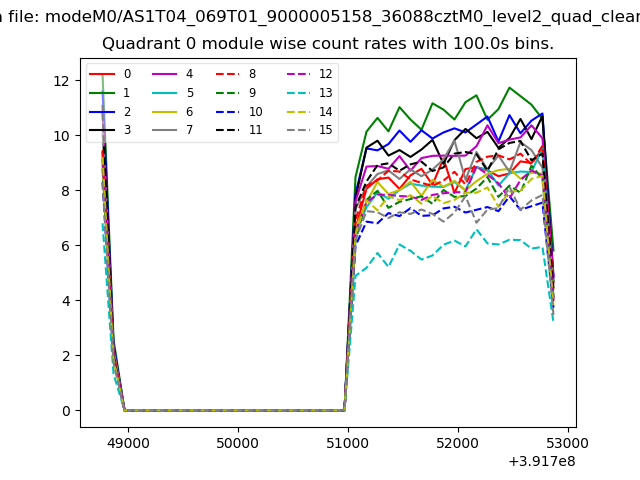 |
 |
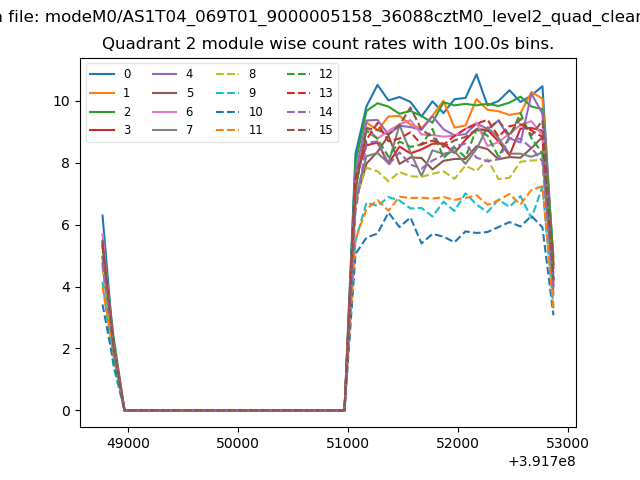
| Module-wise count rates for Quadrant B Data is divided into 100 sec bins |
 |
 |
| Module-wise count rates for Quadrant C Data is divided into 100 sec bins |
 |
 |
| Module-wise count rates for Quadrant D Data is divided into 100 sec bins |
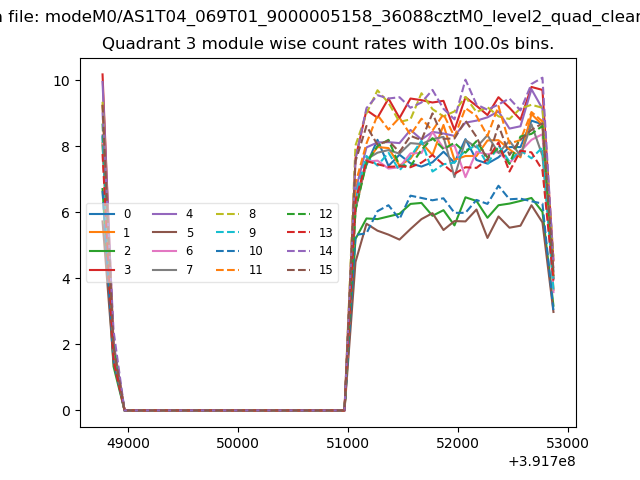 |
 |
| Parameter | Plot |
|---|---|
| CZT HV Monitor | 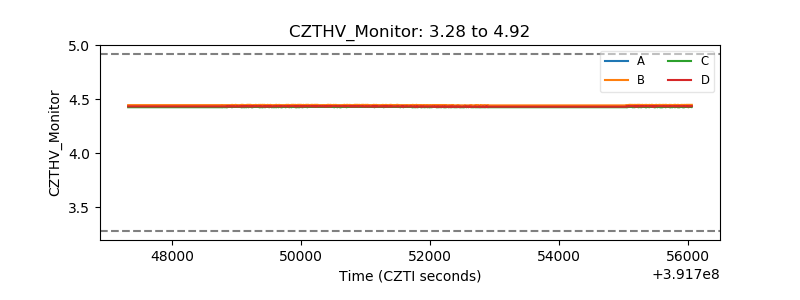 |
| D_VDD | 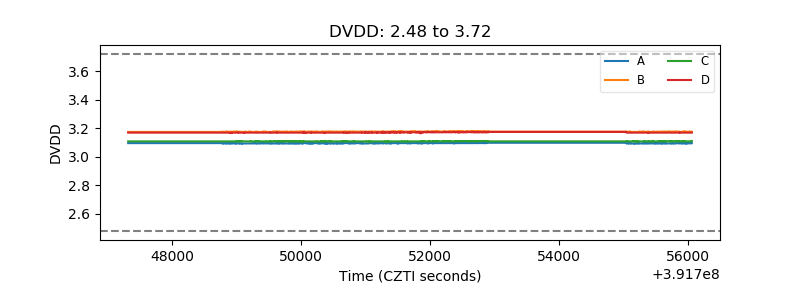 |
| Temperature 1 | 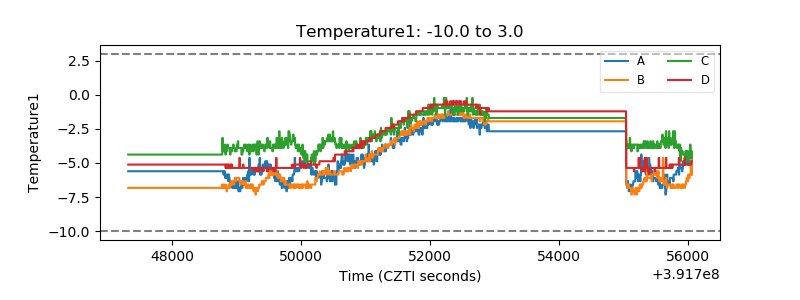 |
| Veto HV Monitor | 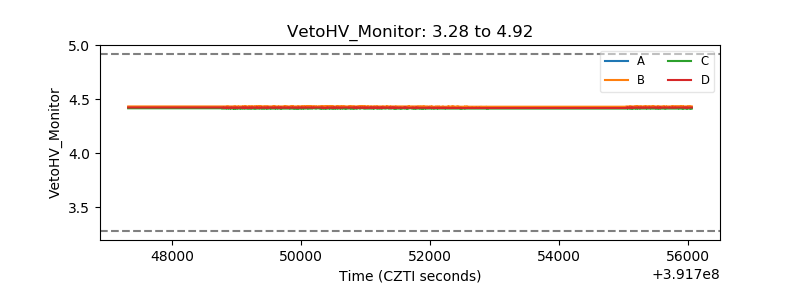 |
| Veto LLD | 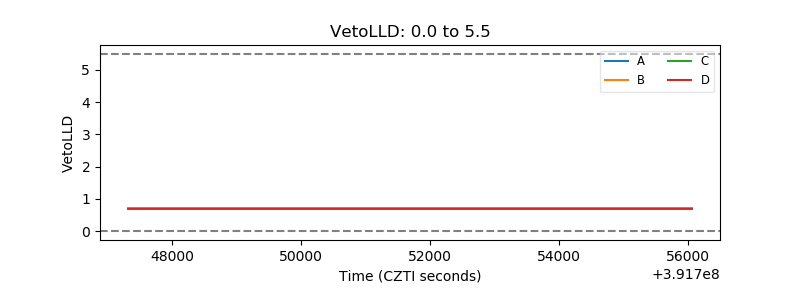 |
| Alpha Counter | 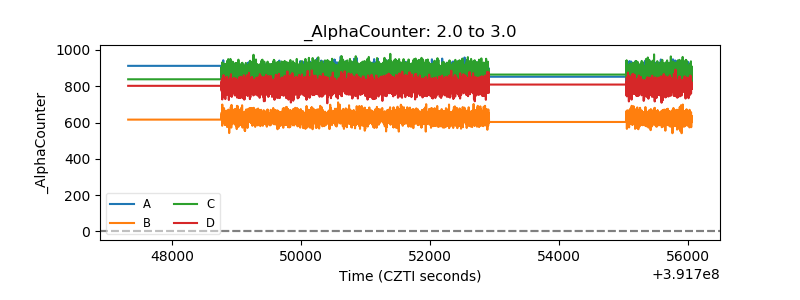 |
| _CPM_Rate | 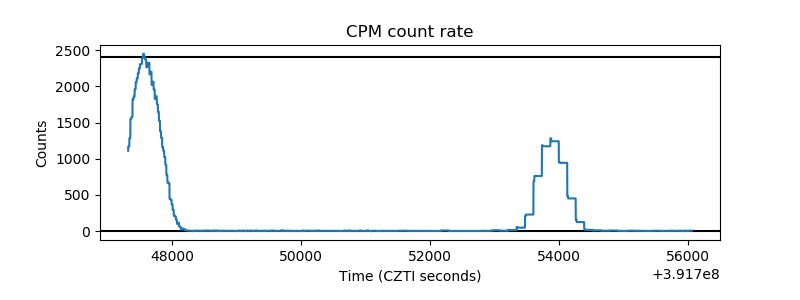 |
| CZT Counter | 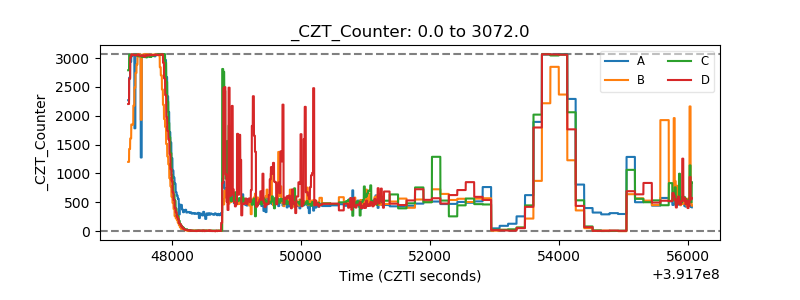 |
| +2.5 Volts monitor | 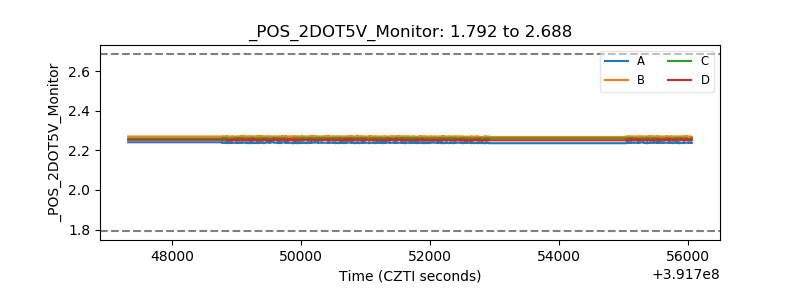 |
| +5 Volts monitor | 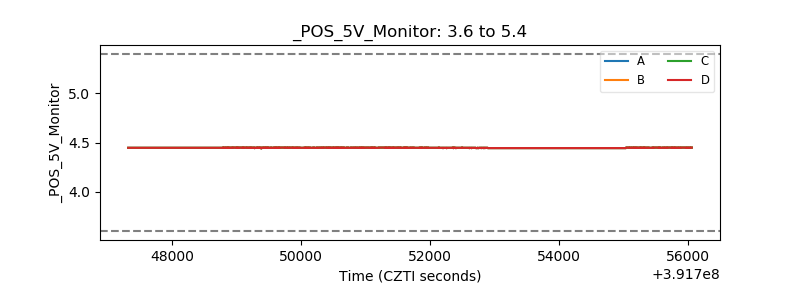 |
| _ROLL_ROT | 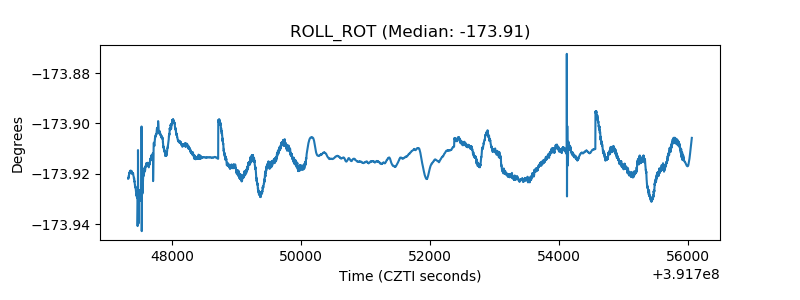 |
| _Roll_DEC | 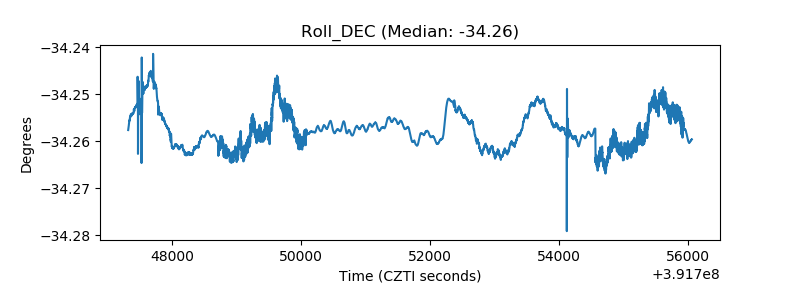 |
| _Roll_RA | 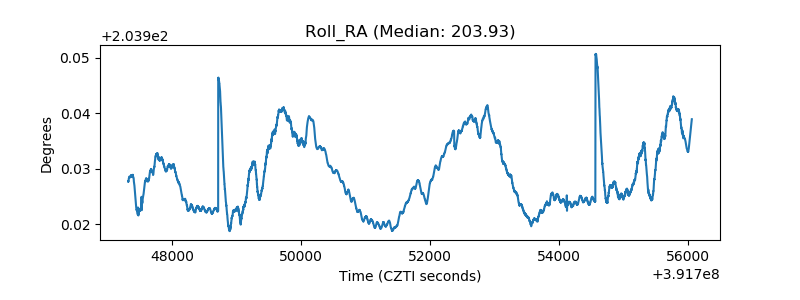 |
| Veto Counter | 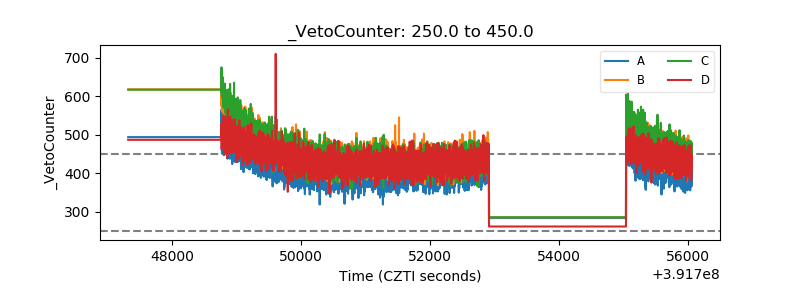 |