| Param | Original file | Final file |
|---|---|---|
| Filename | modeM0/AS1T04_069T01_9000005158_36078cztM0_level2.evt | modeM0/AS1T04_069T01_9000005158_36078cztM0_level2_quad_clean.evt |
| Size (bytes) | 443,088,000 | 84,582,720 |
| Size | 422.6 MB | 80.7 MB |
| Events in quadrant A | 2,833,366 | 551,821 |
| Events in quadrant B | 3,175,068 | 551,328 |
| Events in quadrant C | 2,917,034 | 541,397 |
| Events in quadrant D | 4,099,274 | 511,121 |
Noise dominated data is calculated using 1-second bins in cleaned event files. If a bin has >2000 counts, and if more than 50% of those come from <1% of pixels, then it is considered to be noise-dominated and hence unusable.
| Quadrant | # 1 sec bins | Bins with >0 counts | Bins with >2000 counts | High rate bins dominated by noise | Noise dominated (total time) | Noise dominated (detector-on time) | Marked lightcurve |
|---|---|---|---|---|---|---|---|
| A | 7207 | 5835 | 0 | 0 | 0.00% | 0.00% | 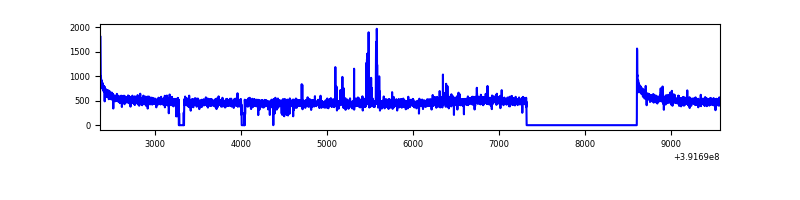 |
| B | 7207 | 5836 | 49 | 49 | 0.68% | 0.84% | 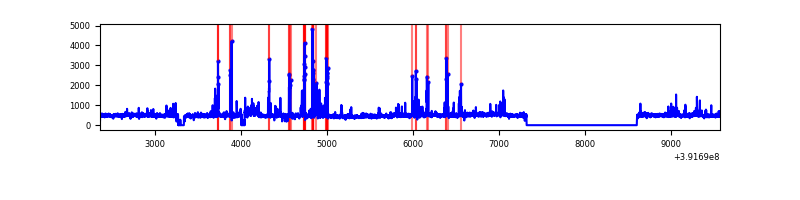 |
| C | 7207 | 5837 | 22 | 22 | 0.31% | 0.38% | 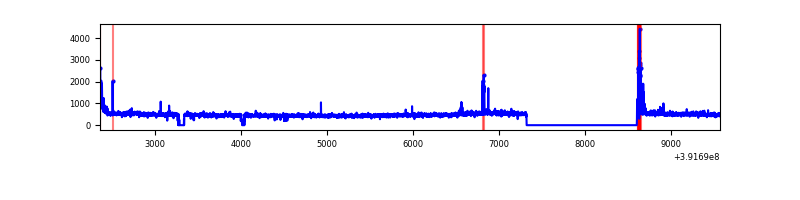 |
| D | 7207 | 5826 | 226 | 226 | 3.14% | 3.88% | 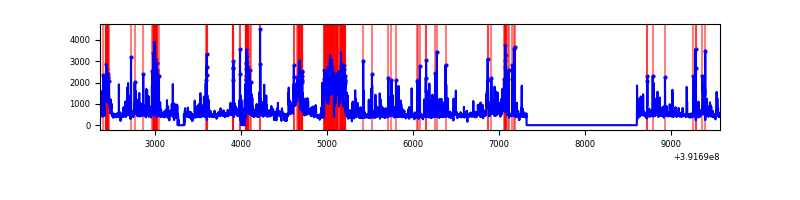 |
Top three noisy pixels from each quadrant. If the there are fewer than three noisy pixels in the level2.evt file, extra rows are filled as -1
| Pixel properties | Quadrant properties | ||||||
|---|---|---|---|---|---|---|---|
| Quadrant | DetID | PixID | Counts | Sigma | Mean | Median | Sigma |
| A | 10 | 83 | 183812 | 1358.16 | 669 | 657 | 134.9 |
| A | 9 | 143 | 51197 | 374.77 | 669 | 657 | 134.9 |
| A | 13 | 6 | 10641 | 74.03 | 669 | 657 | 134.9 |
| B | 5 | 172 | 242230 | 1868.69 | 661 | 642 | 129.3 |
| B | 0 | 190 | 94641 | 727.08 | 661 | 642 | 129.3 |
| B | 5 | 255 | 73324 | 562.19 | 661 | 642 | 129.3 |
| C | 15 | 214 | 245200 | 1611.01 | 643 | 647 | 151.8 |
| C | 0 | 10 | 105263 | 689.16 | 643 | 647 | 151.8 |
| C | 15 | 208 | 54166 | 352.56 | 643 | 647 | 151.8 |
| D | 12 | 227 | 742059 | 4811.96 | 638 | 623 | 154.1 |
| D | 12 | 6 | 310074 | 2008.36 | 638 | 623 | 154.1 |
| D | 12 | 233 | 225077 | 1456.72 | 638 | 623 | 154.1 |
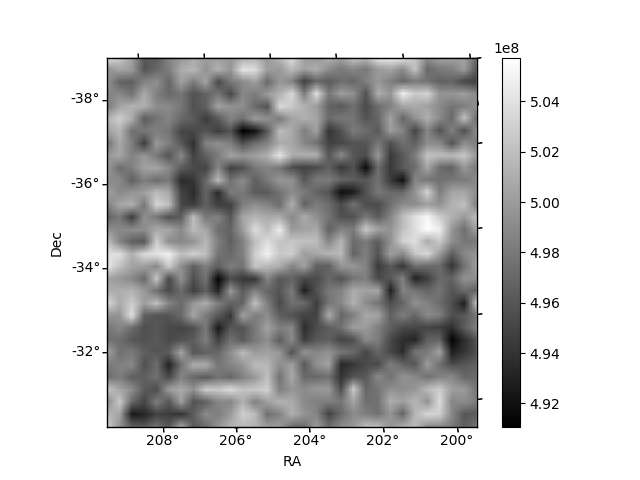
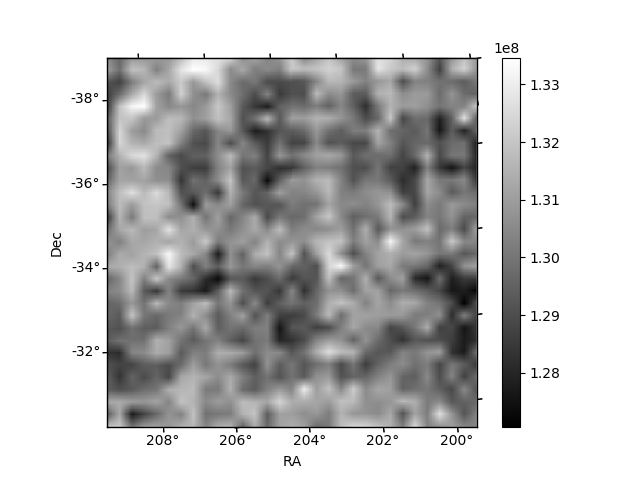
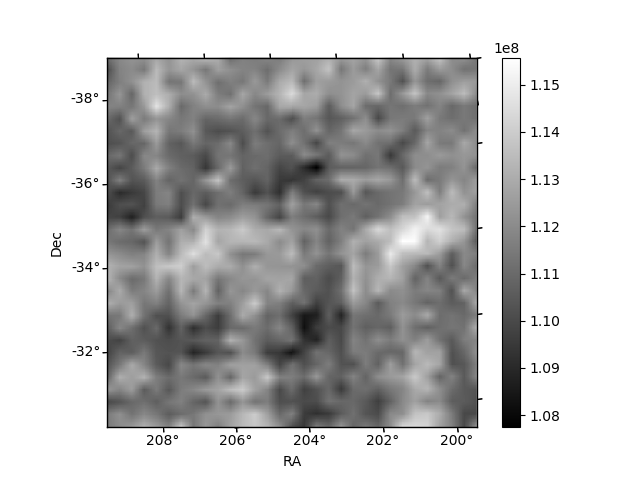
Histogram calculated using DETX and DETY for each event in the final _common_clean file
| Quadrant A | 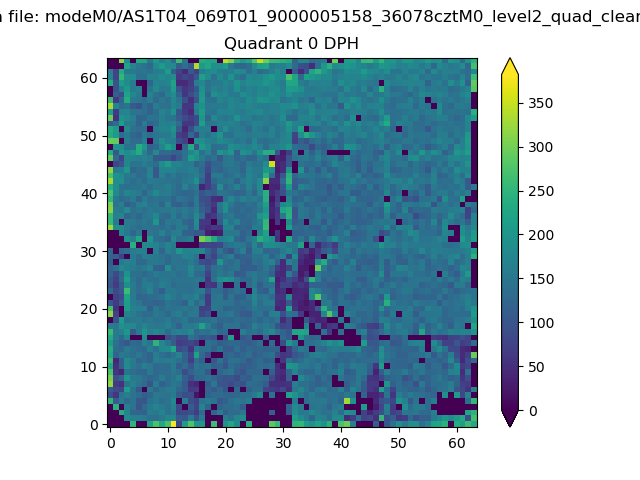 |
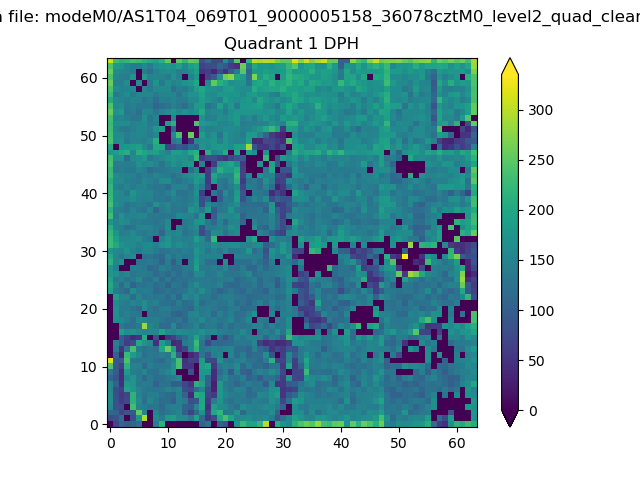 |
Quadrant B |
|---|---|---|---|
| Quadrant D | 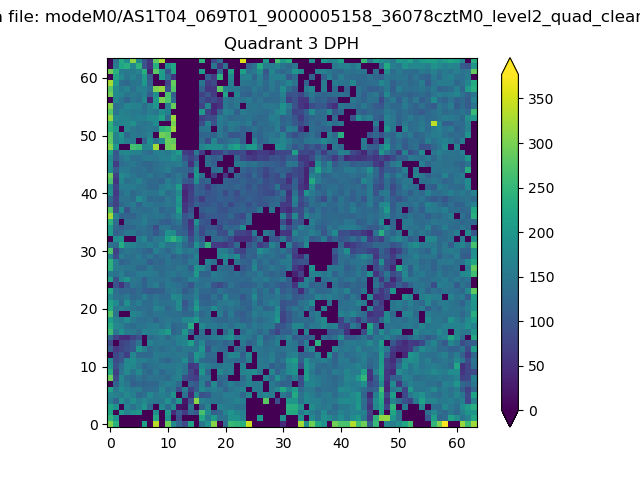 |
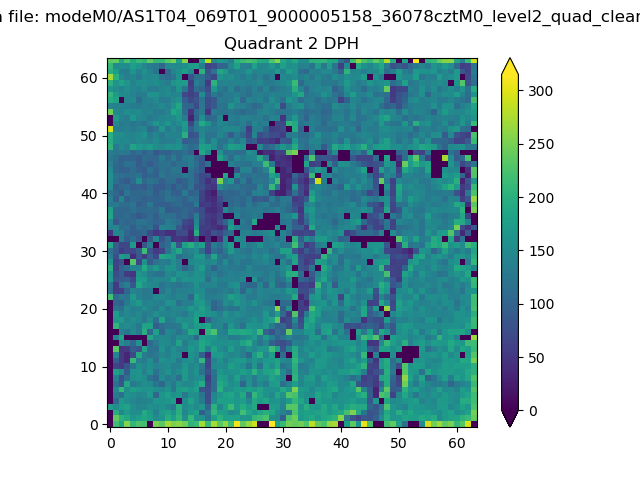 |
Quadrant C |
| Plot type | Count rate plots | Images |
|---|---|---|
| Comparison with Poisson distribution Blue bars denote a histogram of data divided into 1 sec bins. Red curve is a Poisson curve with rate = median count rate of data. |
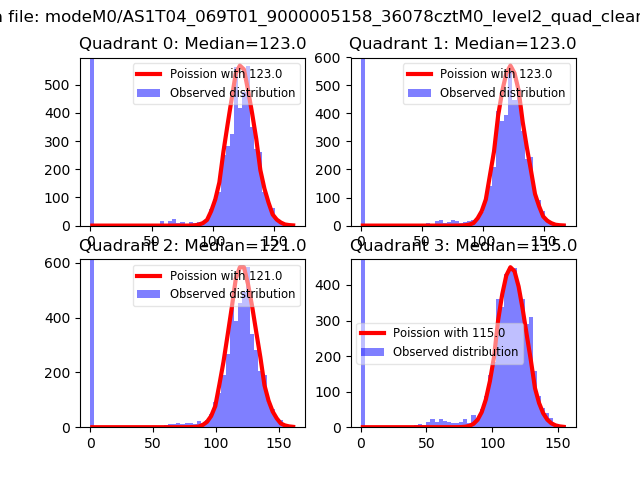 |
 |
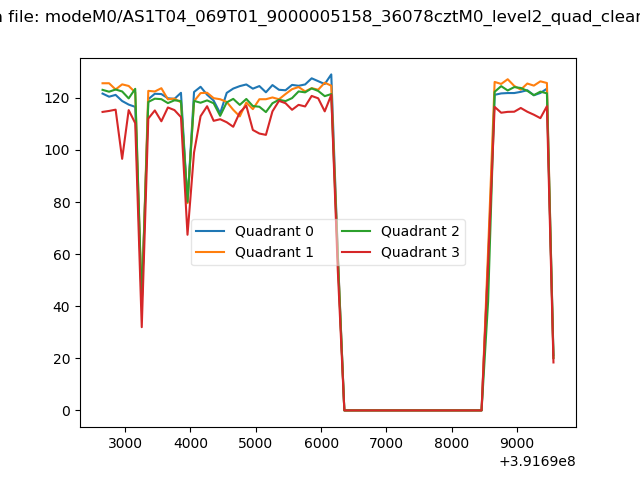
| Quadrant-wise count rates Data is divided into 100 sec bins |
 |
|
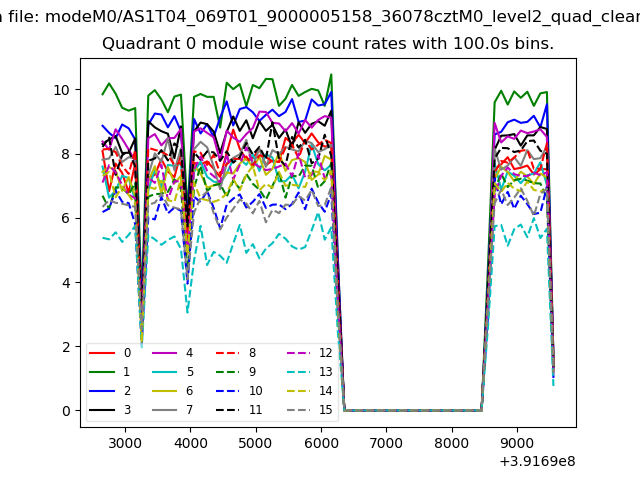
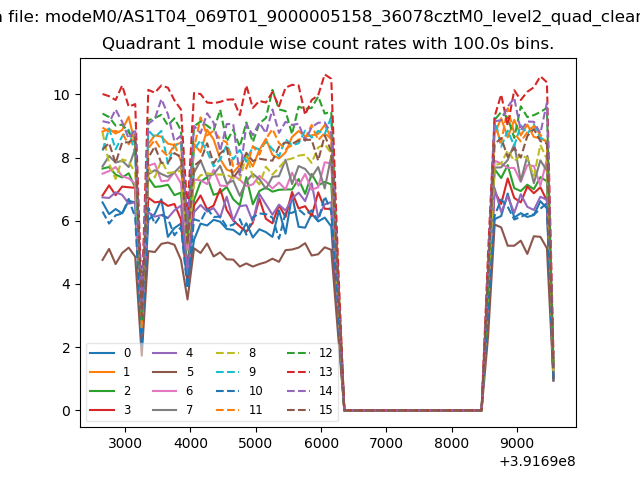
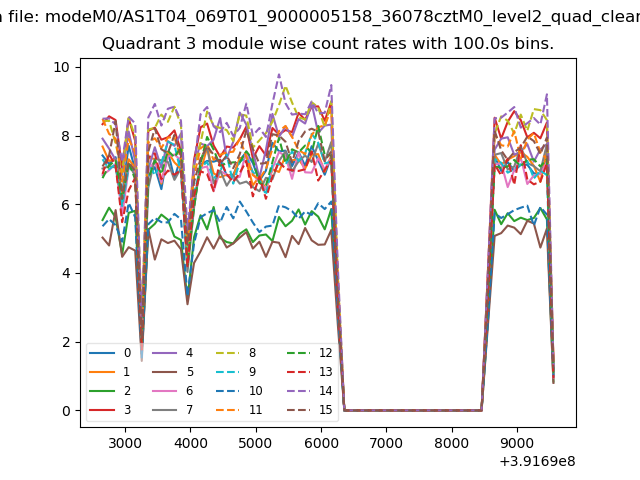
| Module-wise count rates for Quadrant A Data is divided into 100 sec bins |
 |
 |
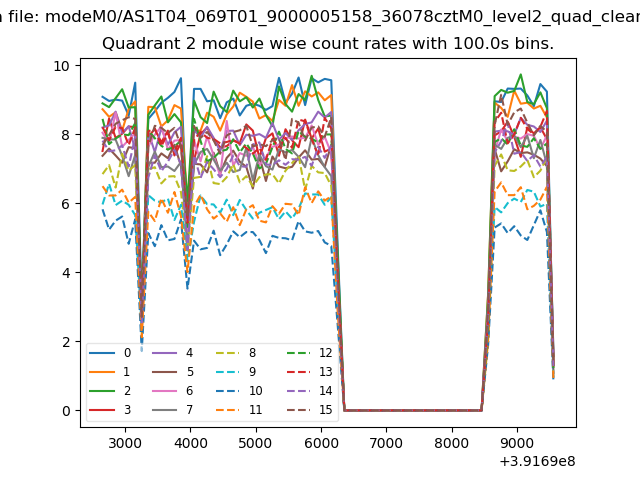
| Module-wise count rates for Quadrant B Data is divided into 100 sec bins |
 |
 |
| Module-wise count rates for Quadrant C Data is divided into 100 sec bins |
 |
 |
| Module-wise count rates for Quadrant D Data is divided into 100 sec bins |
 |
 |
| Parameter | Plot |
|---|---|
| CZT HV Monitor | 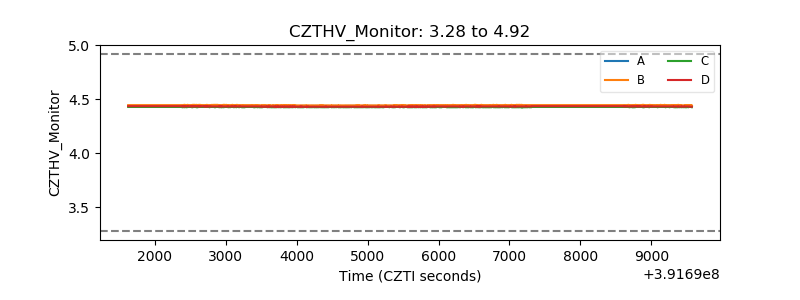 |
| D_VDD | 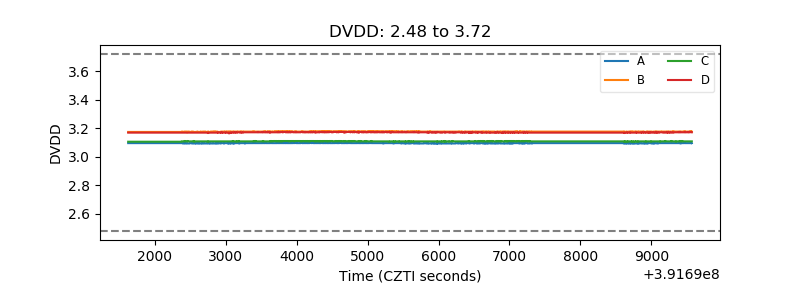 |
| Temperature 1 | 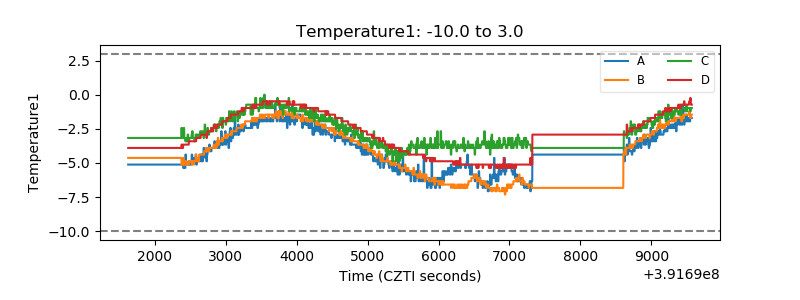 |
| Veto HV Monitor | 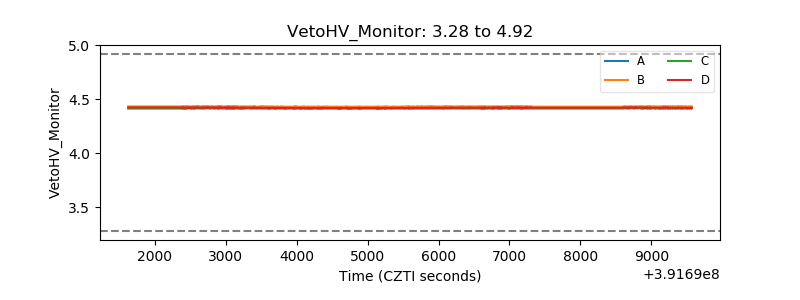 |
| Veto LLD | 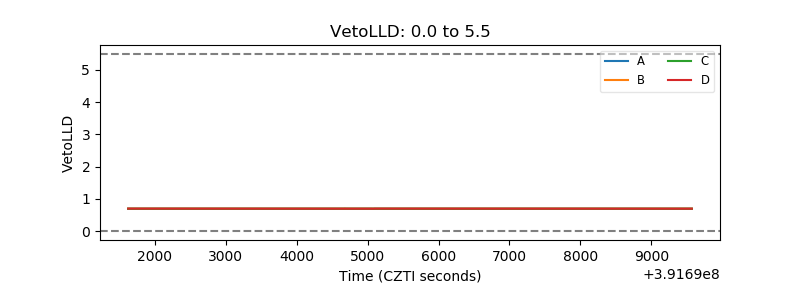 |
| Alpha Counter | 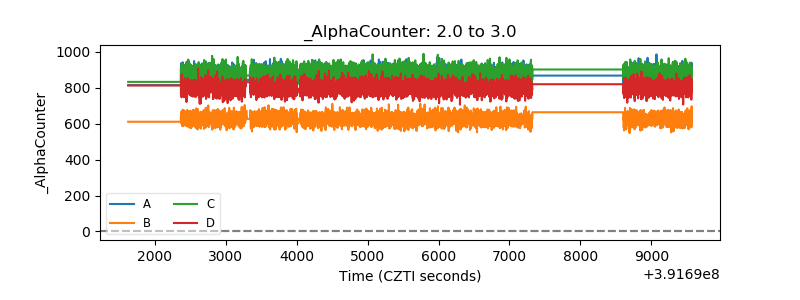 |
| _CPM_Rate | 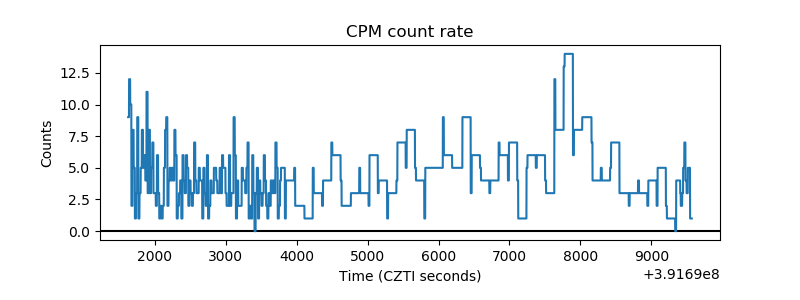 |
| CZT Counter | 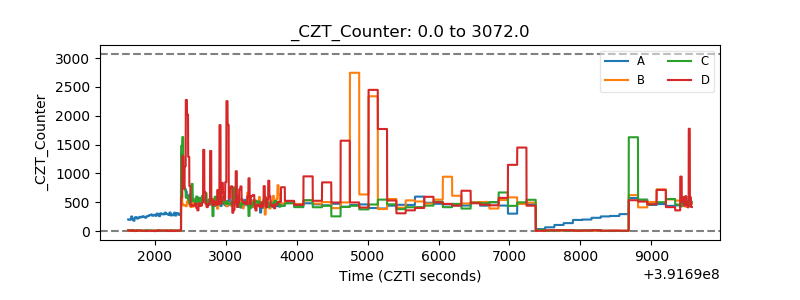 |
| +2.5 Volts monitor | 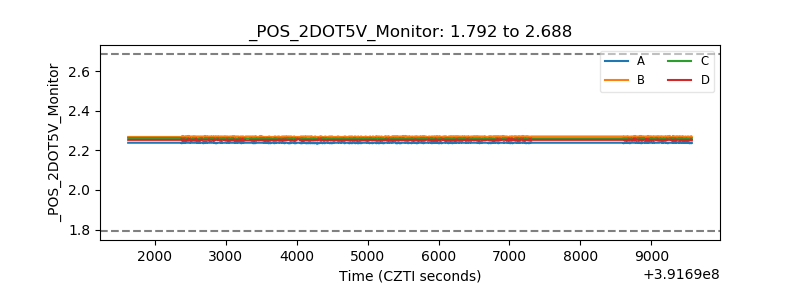 |
| +5 Volts monitor | 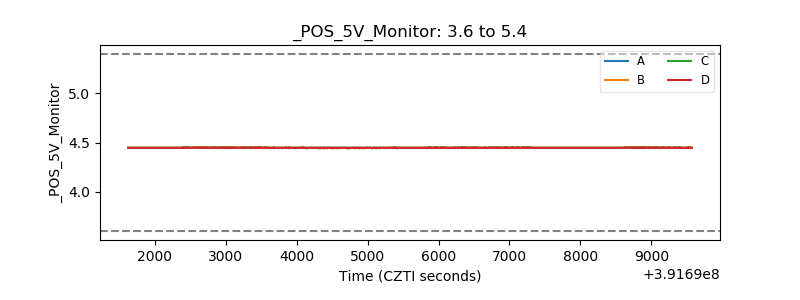 |
| _ROLL_ROT |  |
| _Roll_DEC | 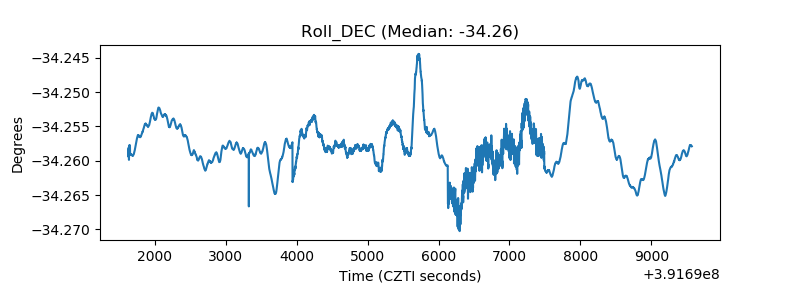 |
| _Roll_RA | 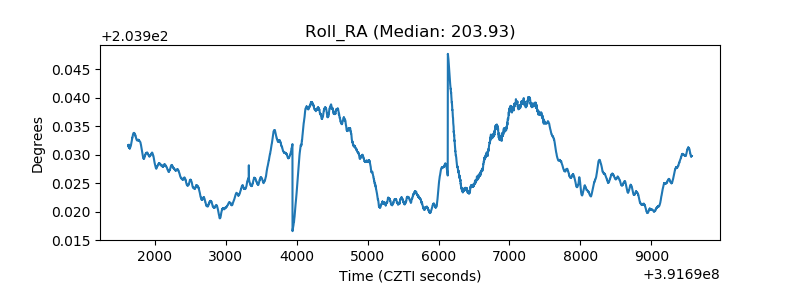 |
| Veto Counter | 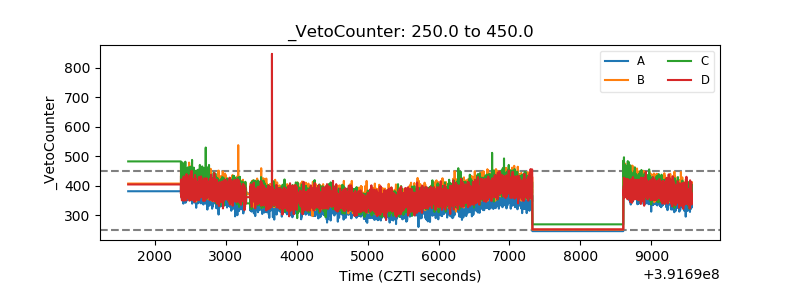 |