| Param | Original file | Final file |
|---|---|---|
| Filename | modeM0/AS1T04_069T01_9000005158_36073cztM0_level2.evt | modeM0/AS1T04_069T01_9000005158_36073cztM0_level2_quad_clean.evt |
| Size (bytes) | 442,800,000 | 46,949,760 |
| Size | 422.3 MB | 44.8 MB |
| Events in quadrant A | 2,671,237 | 270,744 |
| Events in quadrant B | 3,134,112 | 275,123 |
| Events in quadrant C | 2,906,199 | 267,764 |
| Events in quadrant D | 4,345,658 | 242,908 |
| Mode M0 | |||
|---|---|---|---|
| Quadrant | BADHDUFLAG | Total packets | Discarded packets |
| A | 0 | 10895 | 3 |
| B | 0 | 12402 | 2 |
| C | 0 | 11339 | 2 |
| D | 0 | 16345 | 2 |
| Mode M9 | |||
|---|---|---|---|
| Quadrant | BADHDUFLAG | Total packets | Discarded packets |
| A | 0 | 26 | 0 |
| B | 0 | 26 | 0 |
| C | 0 | 26 | 0 |
| D | 0 | 27 | 0 |
| Mode SS | |||
|---|---|---|---|
| Quadrant | BADHDUFLAG | Total packets | Discarded packets |
| A | 0 | 108 | 0 |
| B | 0 | 108 | 0 |
| C | 0 | 108 | 0 |
| D | 0 | 108 | 0 |
| Quadrant | Total seconds | Saturated seconds | Saturation percentage |
|---|---|---|---|
| A | 5194 | 8 | 0.154024% |
| B | 5194 | 126 | 2.425876% |
| C | 5194 | 85 | 1.636504% |
| D | 5194 | 467 | 8.991144% |
Noise dominated data is calculated using 1-second bins in cleaned event files. If a bin has >2000 counts, and if more than 50% of those come from <1% of pixels, then it is considered to be noise-dominated and hence unusable.
| Quadrant | # 1 sec bins | Bins with >0 counts | Bins with >2000 counts | High rate bins dominated by noise | Noise dominated (total time) | Noise dominated (detector-on time) | Marked lightcurve |
|---|---|---|---|---|---|---|---|
| A | 7316 | 5195 | 4 | 4 | 0.05% | 0.08% | 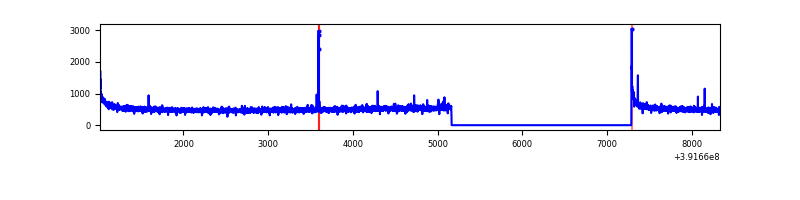 |
| B | 7316 | 5195 | 95 | 95 | 1.30% | 1.83% | 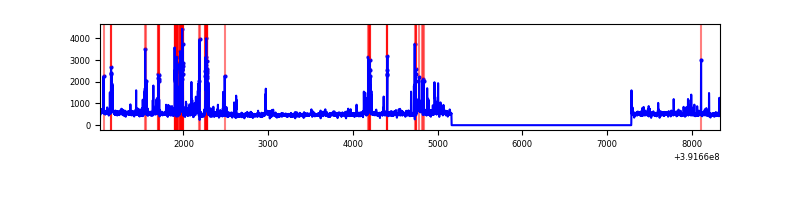 |
| C | 7316 | 5195 | 65 | 65 | 0.89% | 1.25% | 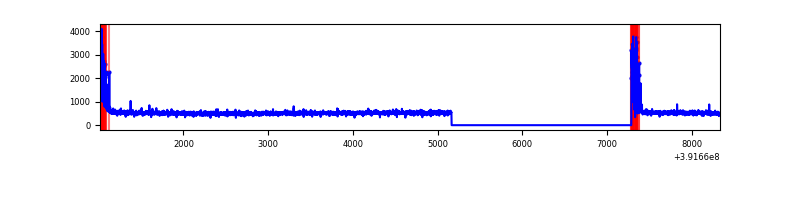 |
| D | 7316 | 5195 | 393 | 393 | 5.37% | 7.56% | 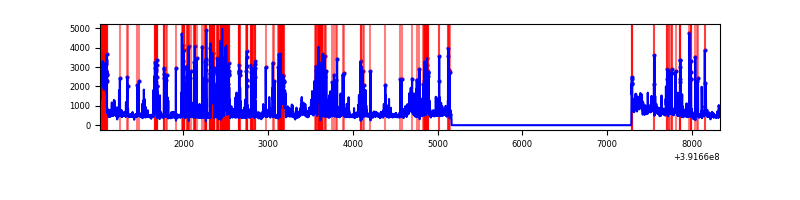 |
Top three noisy pixels from each quadrant. If the there are fewer than three noisy pixels in the level2.evt file, extra rows are filled as -1
| Pixel properties | Quadrant properties | ||||||
|---|---|---|---|---|---|---|---|
| Quadrant | DetID | PixID | Counts | Sigma | Mean | Median | Sigma |
| A | 10 | 83 | 165862 | 1288.18 | 638 | 626 | 128.3 |
| A | 9 | 143 | 25389 | 193.05 | 638 | 626 | 128.3 |
| A | 13 | 254 | 8481 | 61.24 | 638 | 626 | 128.3 |
| B | 5 | 172 | 370979 | 3068.26 | 634 | 618 | 120.7 |
| B | 5 | 255 | 66313 | 544.25 | 634 | 618 | 120.7 |
| B | 8 | 128 | 54705 | 448.08 | 634 | 618 | 120.7 |
| C | 0 | 10 | 237298 | 1640.59 | 622 | 628 | 144.3 |
| C | 15 | 214 | 216942 | 1499.48 | 622 | 628 | 144.3 |
| C | 0 | 207 | 12681 | 83.55 | 622 | 628 | 144.3 |
| D | 12 | 17 | 968485 | 6689.61 | 595 | 579 | 144.7 |
| D | 1 | 52 | 237670 | 1638.64 | 595 | 579 | 144.7 |
| D | 12 | 227 | 221880 | 1529.5 | 595 | 579 | 144.7 |
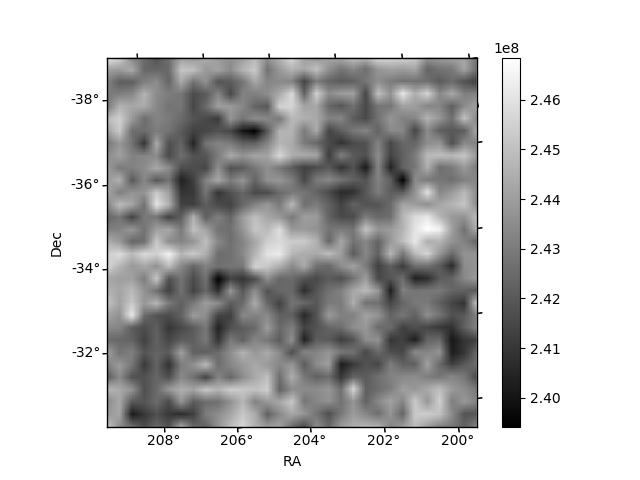
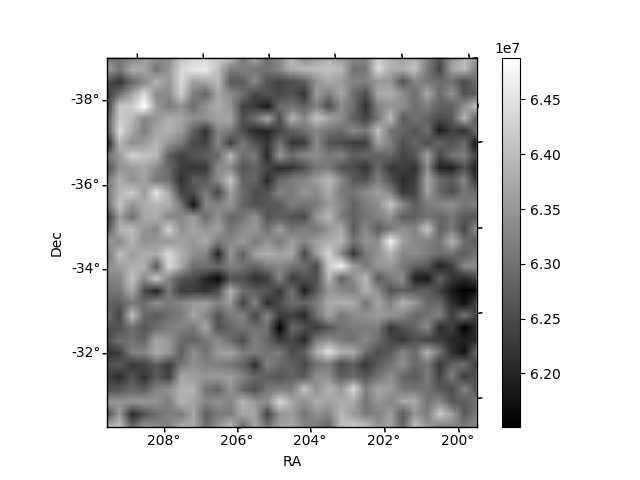
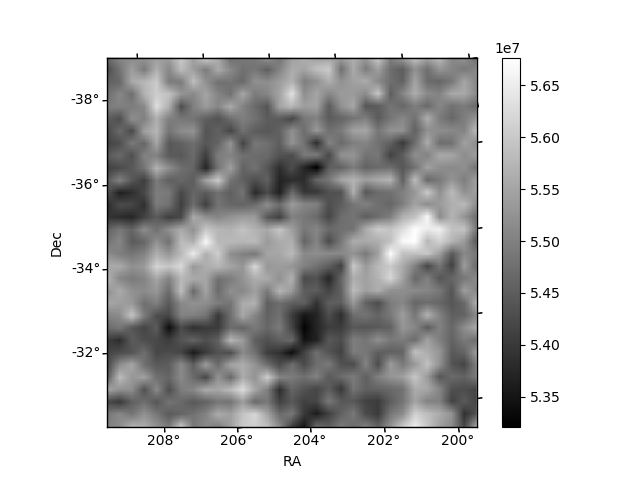
Histogram calculated using DETX and DETY for each event in the final _common_clean file
| Quadrant A | 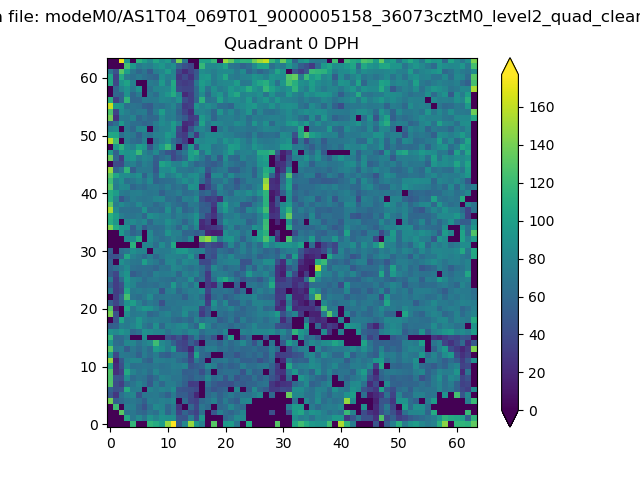 |
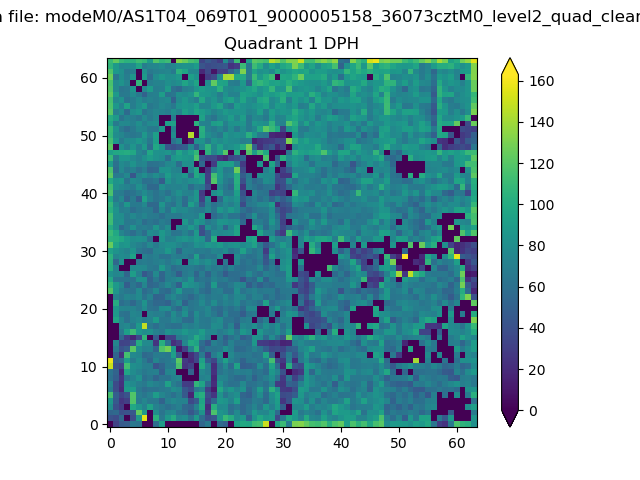 |
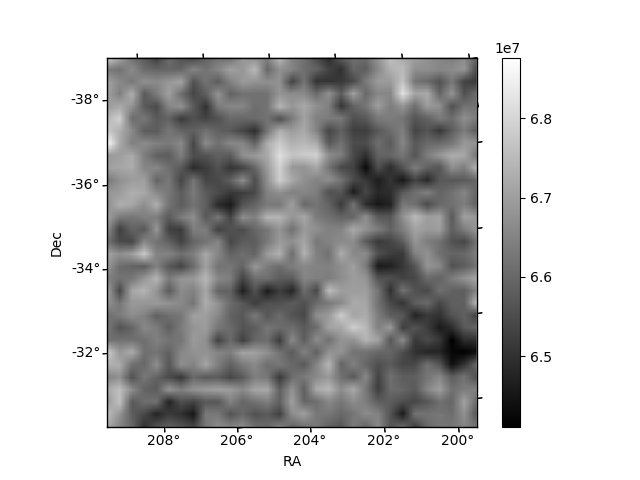
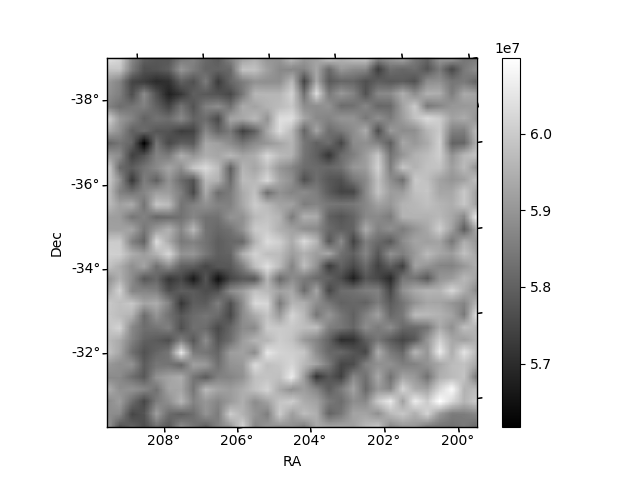
Quadrant B |
|---|---|---|---|
| Quadrant D | 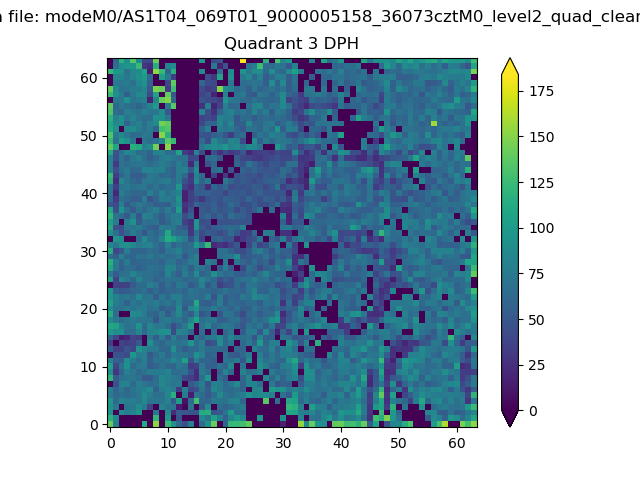 |
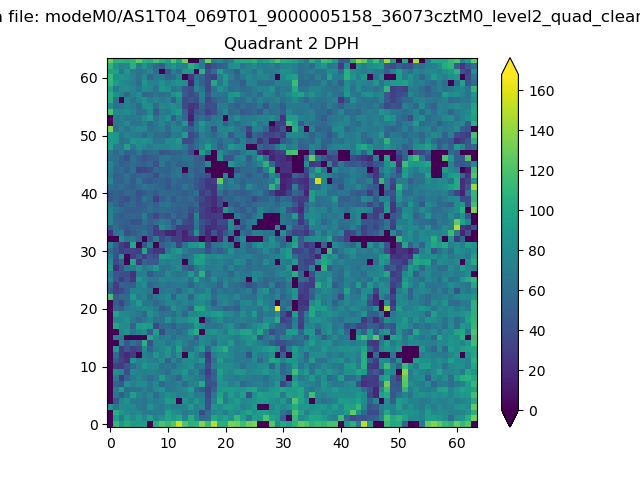 |
Quadrant C |
| Plot type | Count rate plots | Images |
|---|---|---|
| Comparison with Poisson distribution Blue bars denote a histogram of data divided into 1 sec bins. Red curve is a Poisson curve with rate = median count rate of data. |
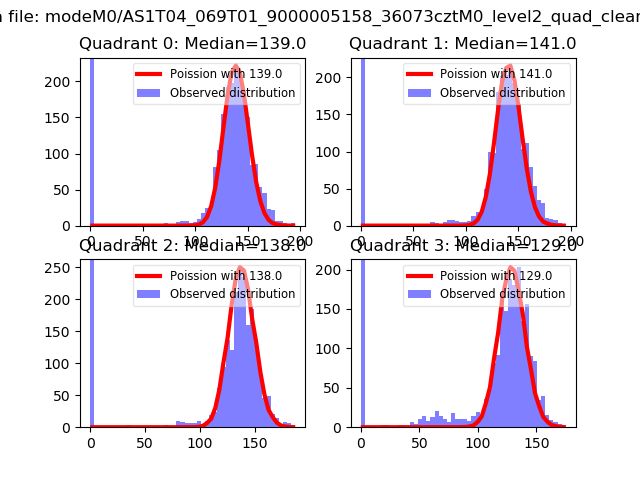 |
 |
| Quadrant-wise count rates Data is divided into 100 sec bins |
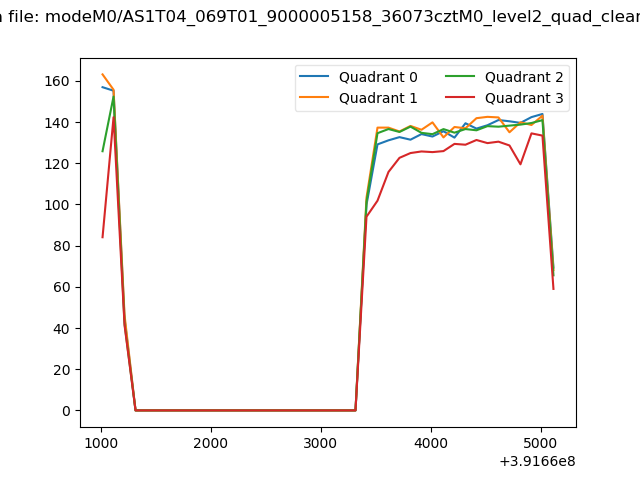 |
|
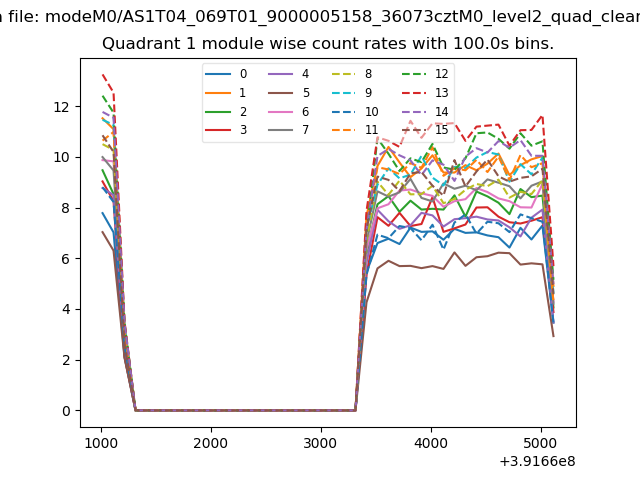
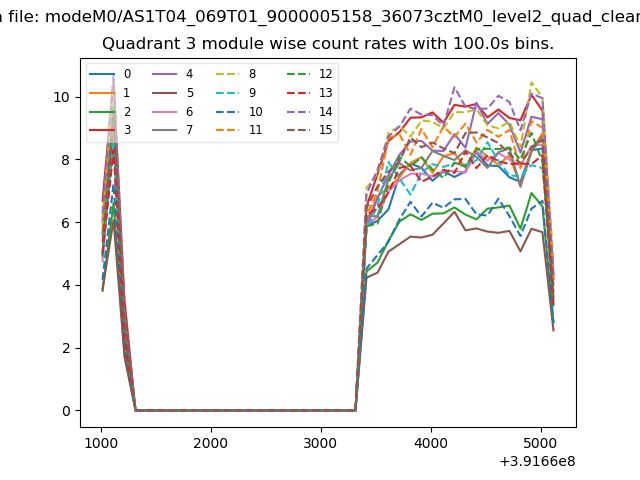
| Module-wise count rates for Quadrant A Data is divided into 100 sec bins |
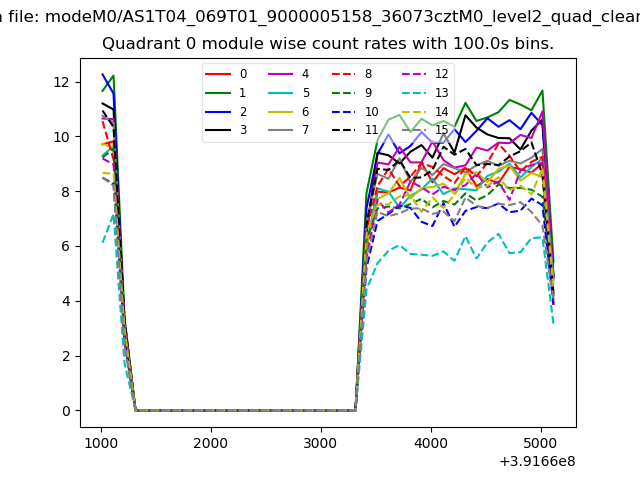 |
 |
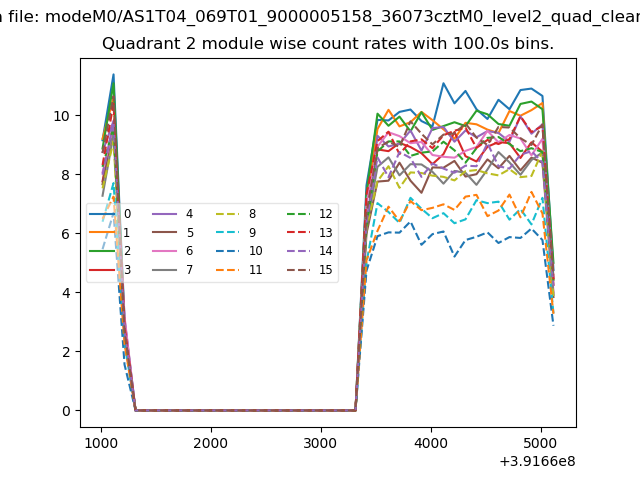
| Module-wise count rates for Quadrant B Data is divided into 100 sec bins |
 |
 |
| Module-wise count rates for Quadrant C Data is divided into 100 sec bins |
 |
 |
| Module-wise count rates for Quadrant D Data is divided into 100 sec bins |
 |
 |
| Parameter | Plot |
|---|---|
| CZT HV Monitor |  |
| D_VDD | 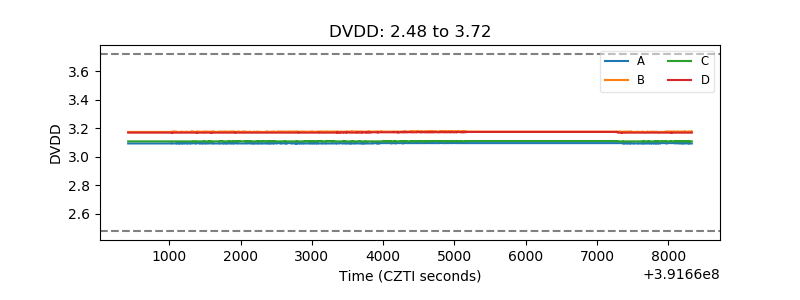 |
| Temperature 1 | 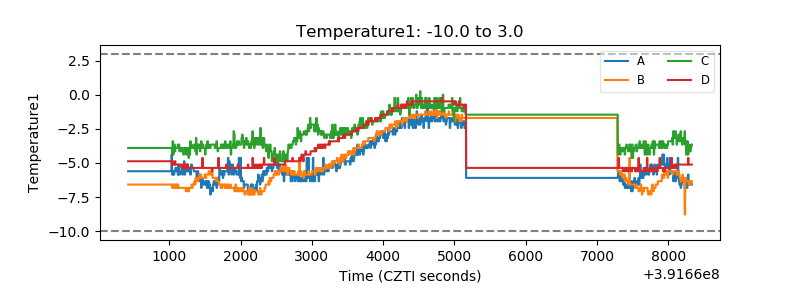 |
| Veto HV Monitor | 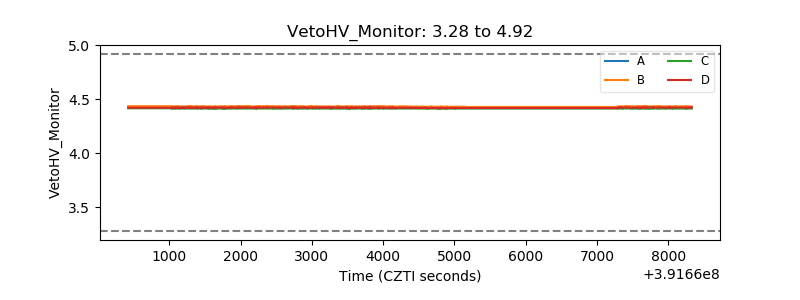 |
| Veto LLD | 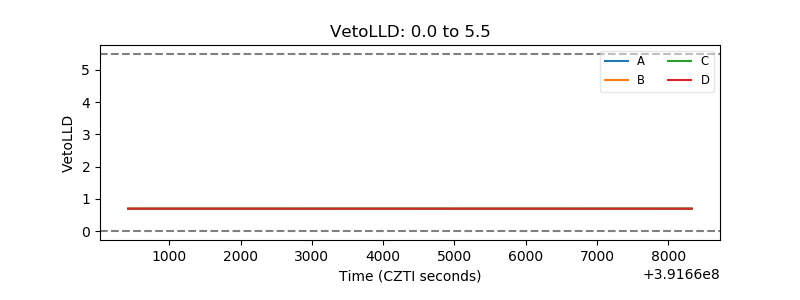 |
| Alpha Counter | 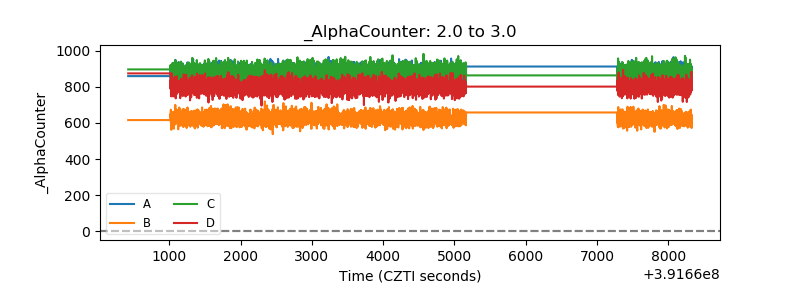 |
| _CPM_Rate | 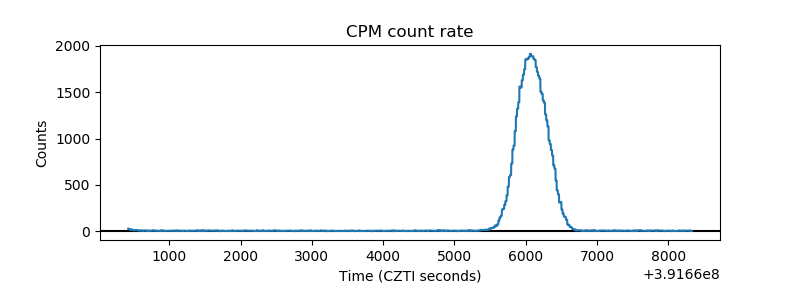 |
| CZT Counter | 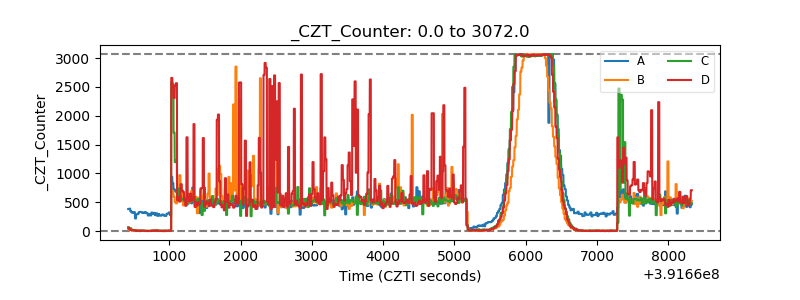 |
| +2.5 Volts monitor | 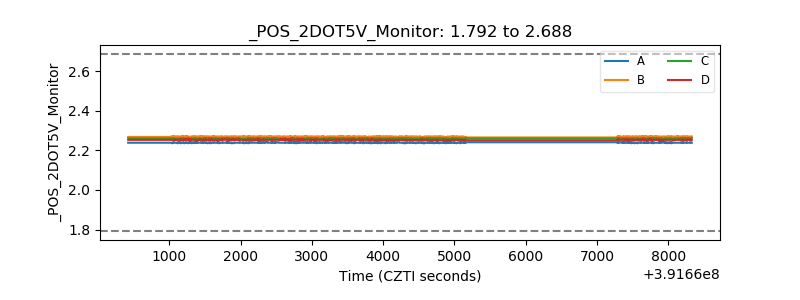 |
| +5 Volts monitor | 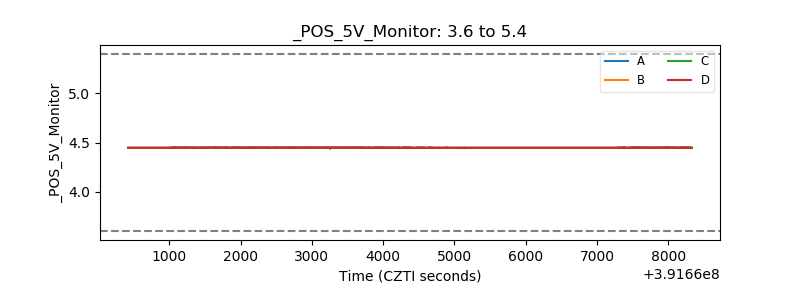 |
| _ROLL_ROT | 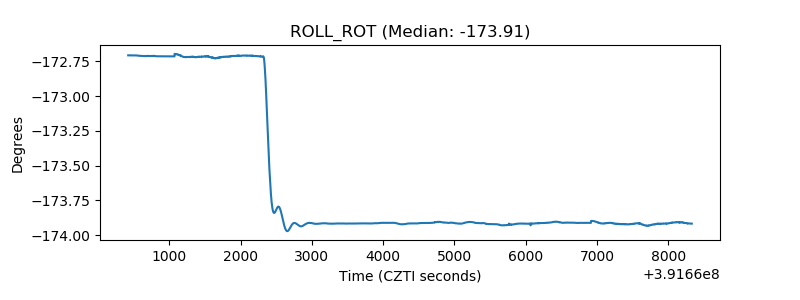 |
| _Roll_DEC | 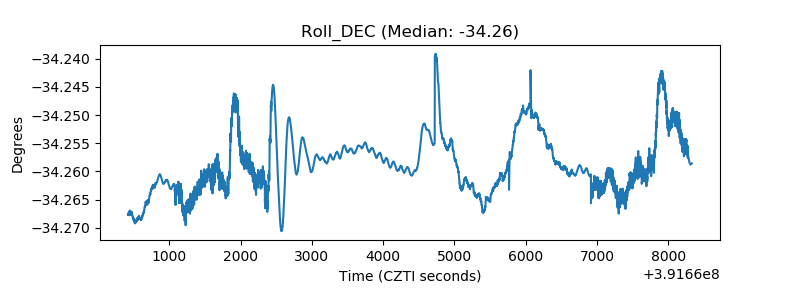 |
| _Roll_RA | 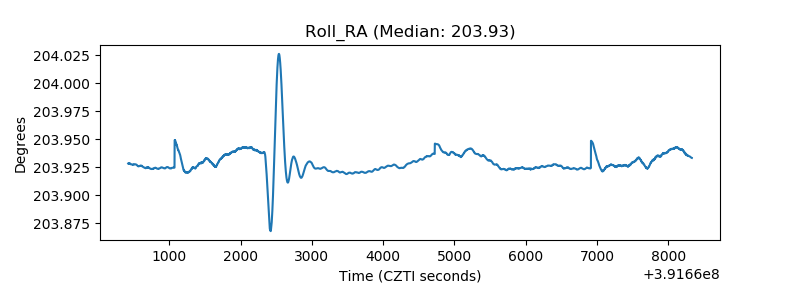 |
| Veto Counter | 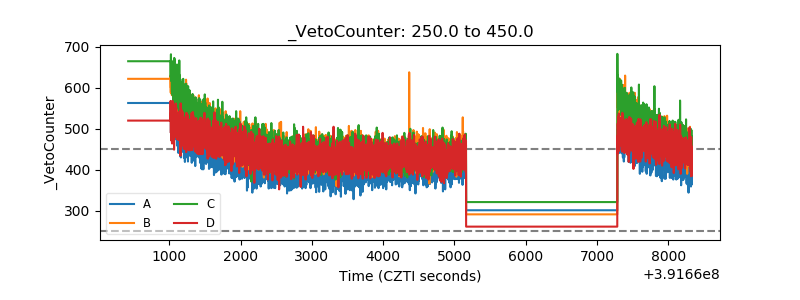 |