| Param | Original file | Final file |
|---|---|---|
| Filename | modeM0/AS1T04_069T01_9000005158_36056cztM0_level2.evt | modeM0/AS1T04_069T01_9000005158_36056cztM0_level2_quad_clean.evt |
| Size (bytes) | 468,120,960 | 64,500,480 |
| Size | 446.4 MB | 61.5 MB |
| Events in quadrant A | 2,600,577 | 416,102 |
| Events in quadrant B | 4,318,544 | 382,650 |
| Events in quadrant C | 3,121,065 | 406,316 |
| Events in quadrant D | 3,775,459 | 374,920 |
| Mode M0 | |||
|---|---|---|---|
| Quadrant | BADHDUFLAG | Total packets | Discarded packets |
| A | 0 | 11031 | 3 |
| B | 0 | 16277 | 2 |
| C | 0 | 12354 | 2 |
| D | 0 | 14759 | 2 |
| Mode M9 | |||
|---|---|---|---|
| Quadrant | BADHDUFLAG | Total packets | Discarded packets |
| A | 0 | 37 | 0 |
| B | 0 | 37 | 0 |
| C | 0 | 37 | 0 |
| D | 0 | 37 | 0 |
| Mode SS | |||
|---|---|---|---|
| Quadrant | BADHDUFLAG | Total packets | Discarded packets |
| A | 0 | 110 | 0 |
| B | 0 | 110 | 0 |
| C | 0 | 110 | 0 |
| D | 0 | 110 | 0 |
| Quadrant | Total seconds | Saturated seconds | Saturation percentage |
|---|---|---|---|
| A | 5325 | 6 | 0.112676% |
| B | 5325 | 557 | 10.460094% |
| C | 5325 | 103 | 1.934272% |
| D | 5325 | 264 | 4.957746% |
Noise dominated data is calculated using 1-second bins in cleaned event files. If a bin has >2000 counts, and if more than 50% of those come from <1% of pixels, then it is considered to be noise-dominated and hence unusable.
| Quadrant | # 1 sec bins | Bins with >0 counts | Bins with >2000 counts | High rate bins dominated by noise | Noise dominated (total time) | Noise dominated (detector-on time) | Marked lightcurve |
|---|---|---|---|---|---|---|---|
| A | 8940 | 5327 | 0 | 0 | 0.00% | 0.00% | 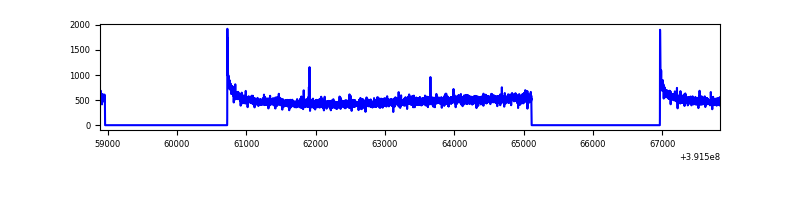 |
| B | 8939 | 5326 | 460 | 460 | 5.15% | 8.64% | 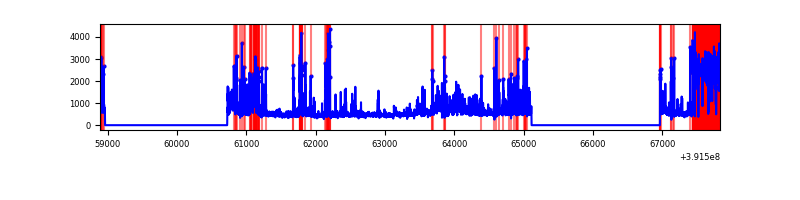 |
| C | 8940 | 5327 | 88 | 88 | 0.98% | 1.65% | 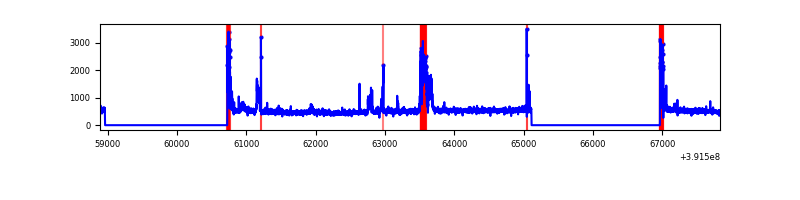 |
| D | 8940 | 5327 | 247 | 247 | 2.76% | 4.64% |  |
Top three noisy pixels from each quadrant. If the there are fewer than three noisy pixels in the level2.evt file, extra rows are filled as -1
| Pixel properties | Quadrant properties | ||||||
|---|---|---|---|---|---|---|---|
| Quadrant | DetID | PixID | Counts | Sigma | Mean | Median | Sigma |
| A | 10 | 83 | 169278 | 1332.42 | 626 | 614 | 126.6 |
| A | 13 | 254 | 8210 | 60.0 | 626 | 614 | 126.6 |
| A | 13 | 6 | 6608 | 47.35 | 626 | 614 | 126.6 |
| B | 5 | 236 | 1507804 | 13156.66 | 592 | 575 | 114.6 |
| B | 5 | 172 | 299041 | 2605.32 | 592 | 575 | 114.6 |
| B | 0 | 213 | 79544 | 689.32 | 592 | 575 | 114.6 |
| C | 9 | 187 | 354171 | 2509.41 | 606 | 612 | 140.9 |
| C | 15 | 214 | 220720 | 1562.23 | 606 | 612 | 140.9 |
| C | 0 | 10 | 138495 | 978.63 | 606 | 612 | 140.9 |
| D | 12 | 6 | 814610 | 5589.45 | 593 | 577 | 145.6 |
| D | 10 | 118 | 160089 | 1095.27 | 593 | 577 | 145.6 |
| D | 7 | 223 | 139996 | 957.3 | 593 | 577 | 145.6 |
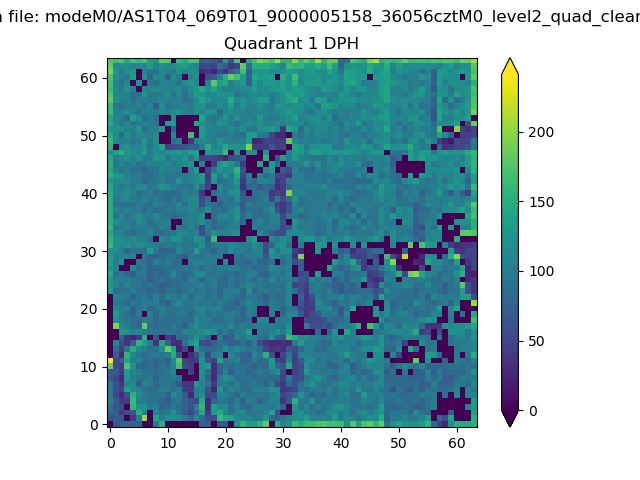
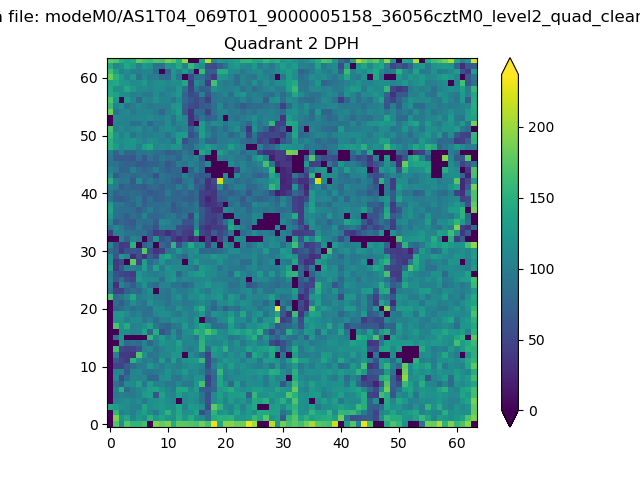
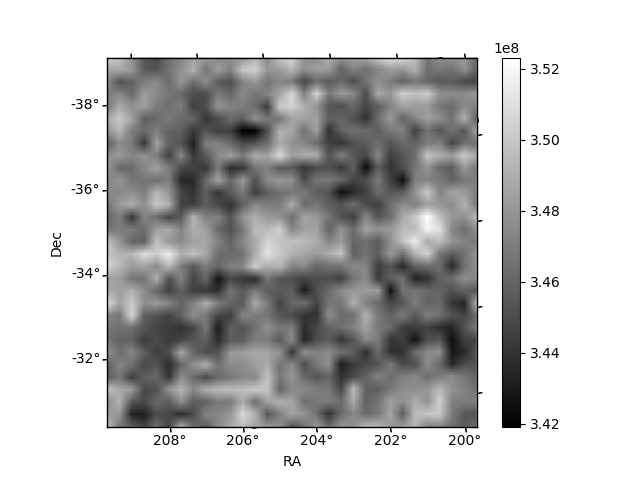
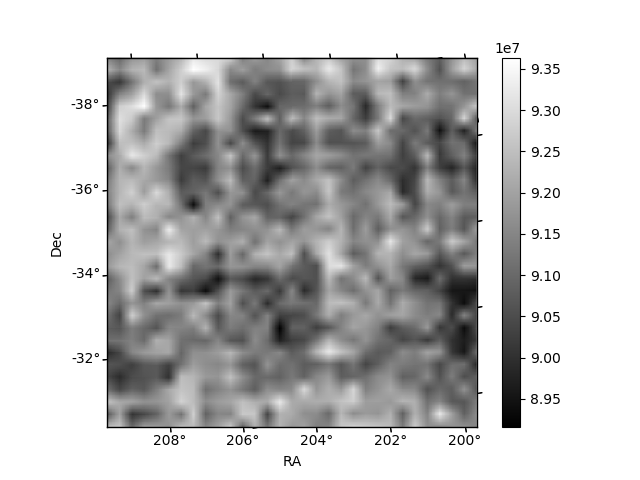
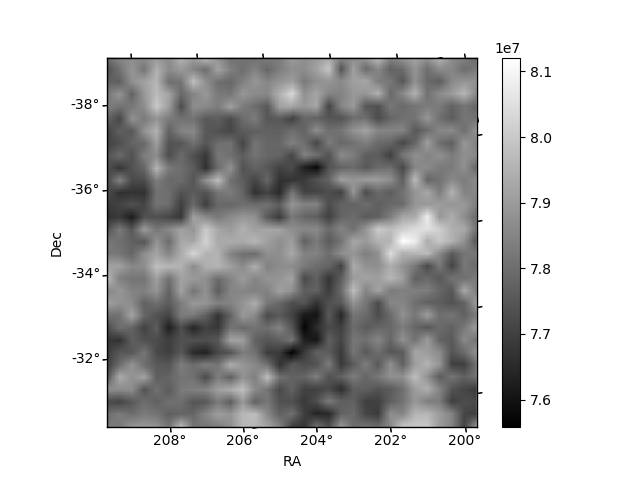
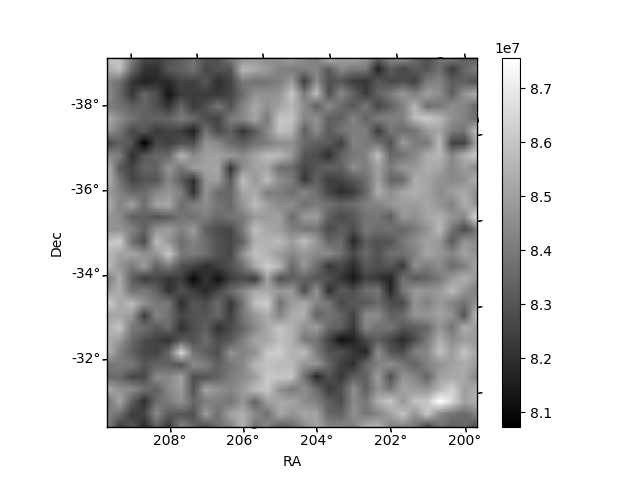
Histogram calculated using DETX and DETY for each event in the final _common_clean file
| Quadrant A | 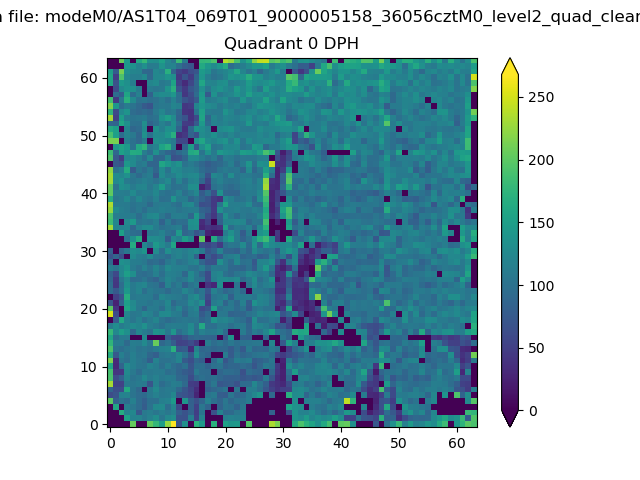 |
 |
Quadrant B |
|---|---|---|---|
| Quadrant D | 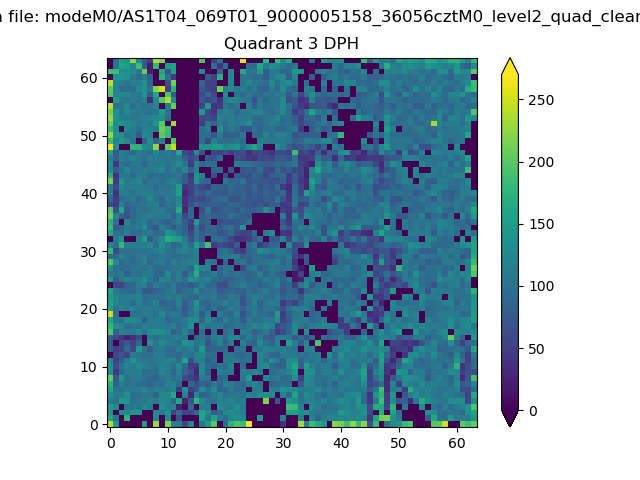 |
 |
Quadrant C |
| Plot type | Count rate plots | Images |
|---|---|---|
| Comparison with Poisson distribution Blue bars denote a histogram of data divided into 1 sec bins. Red curve is a Poisson curve with rate = median count rate of data. |
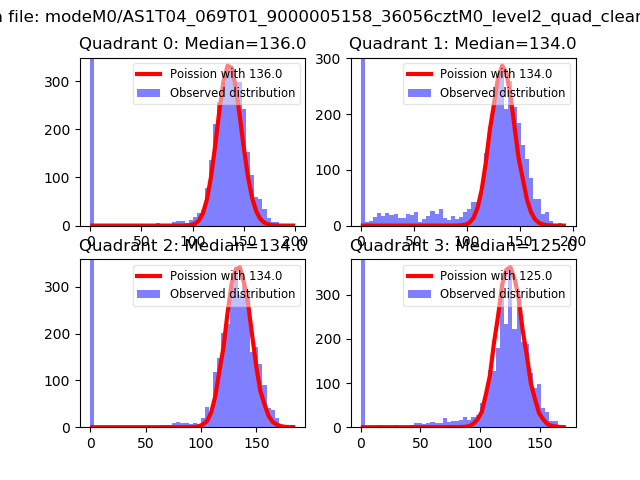 |
 |
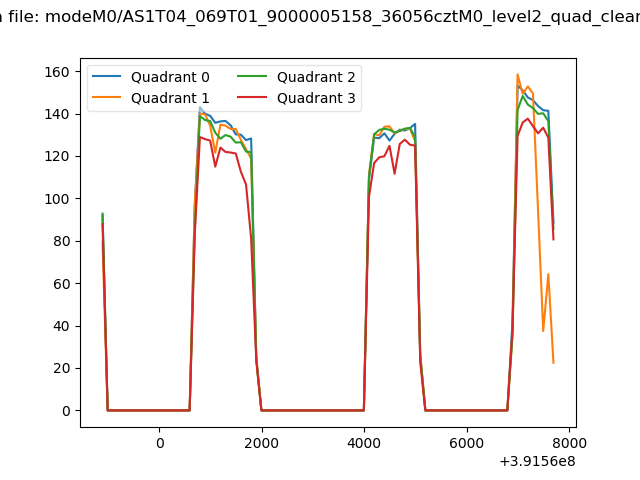
| Quadrant-wise count rates Data is divided into 100 sec bins |
 |
|
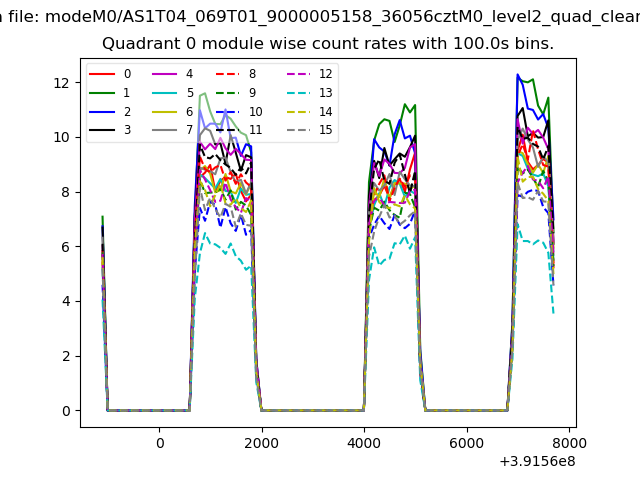
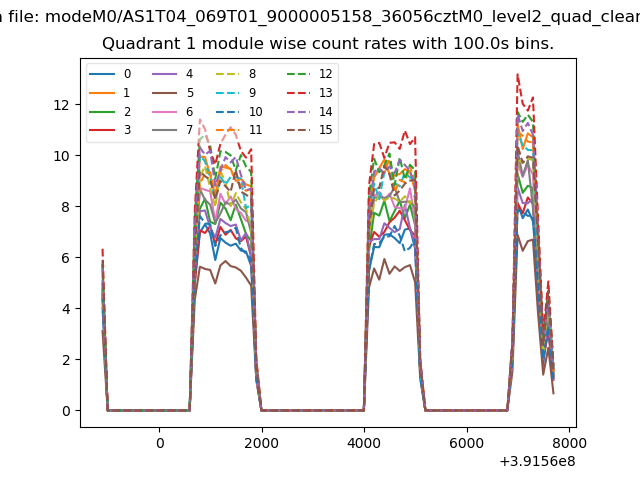
| Module-wise count rates for Quadrant A Data is divided into 100 sec bins |
 |
 |
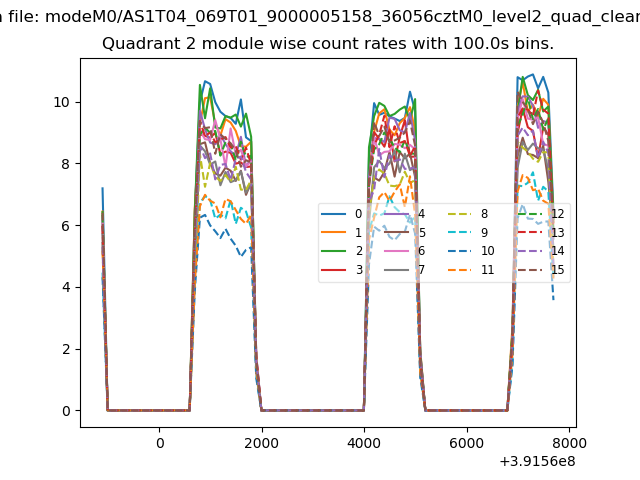
| Module-wise count rates for Quadrant B Data is divided into 100 sec bins |
 |
 |
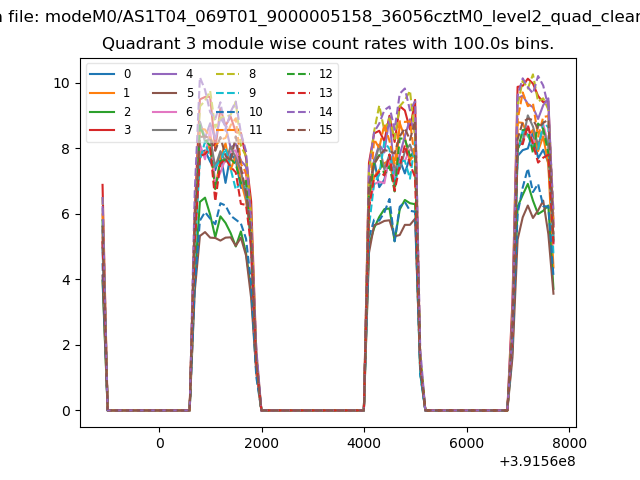
| Module-wise count rates for Quadrant C Data is divided into 100 sec bins |
 |
 |
| Module-wise count rates for Quadrant D Data is divided into 100 sec bins |
 |
 |
| Parameter | Plot |
|---|---|
| CZT HV Monitor | 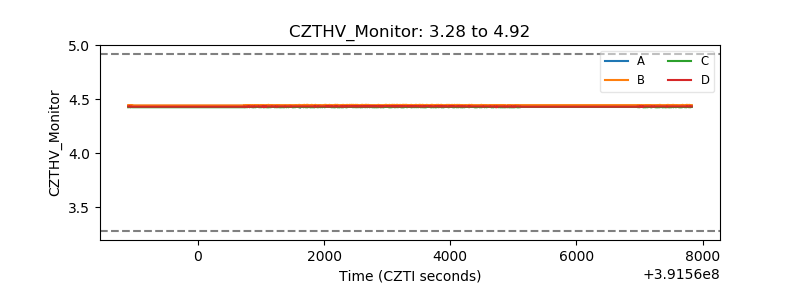 |
| D_VDD | 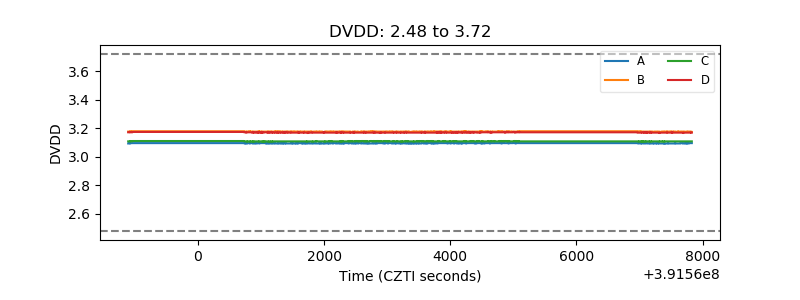 |
| Temperature 1 | 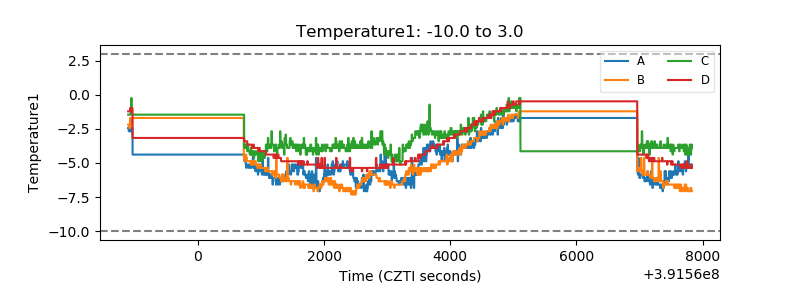 |
| Veto HV Monitor | 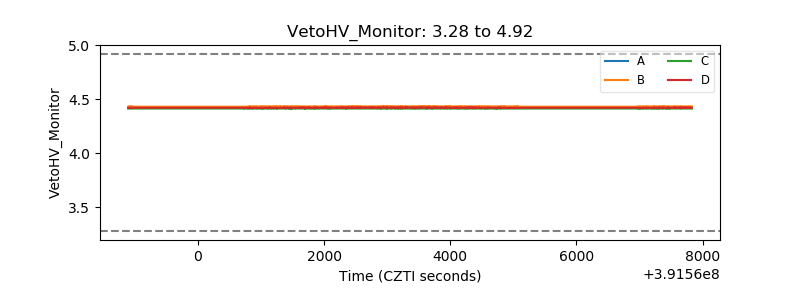 |
| Veto LLD | 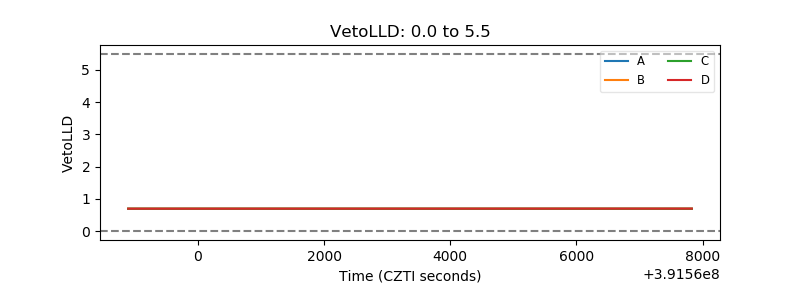 |
| Alpha Counter | 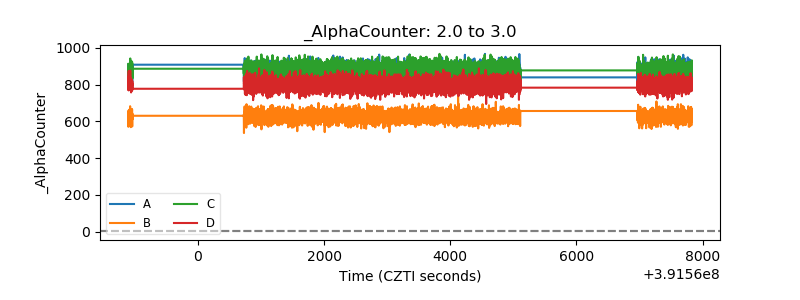 |
| _CPM_Rate | 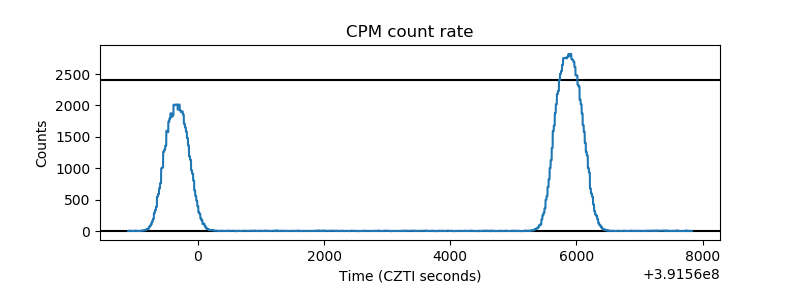 |
| CZT Counter | 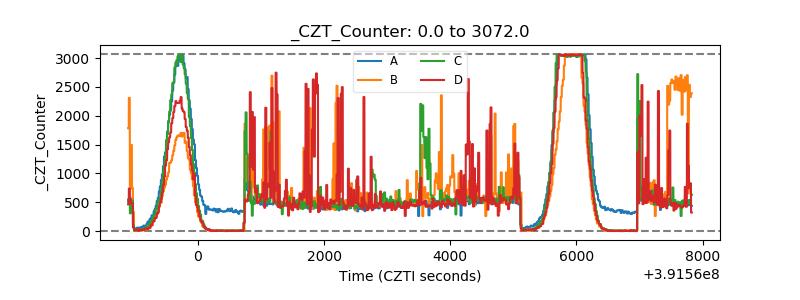 |
| +2.5 Volts monitor | 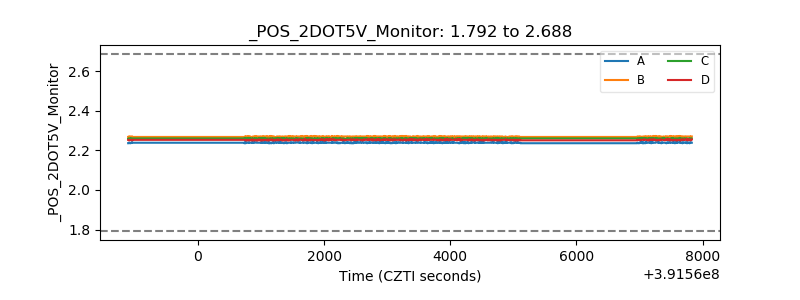 |
| +5 Volts monitor | 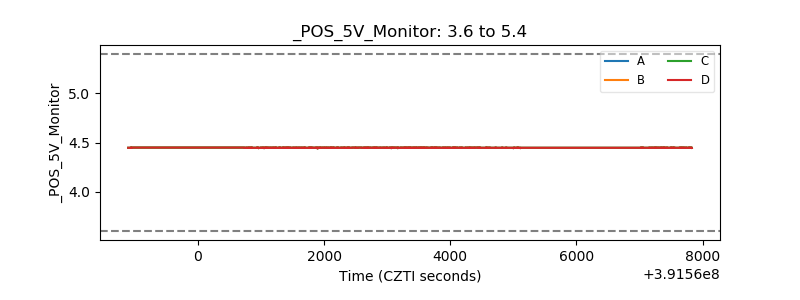 |
| _ROLL_ROT | 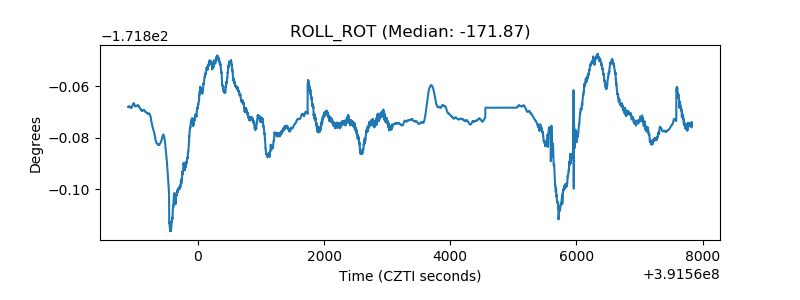 |
| _Roll_DEC | 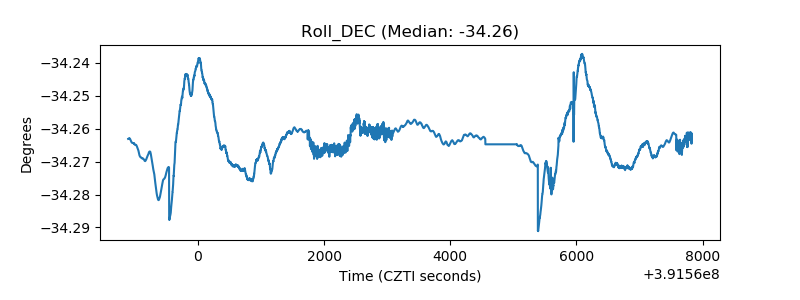 |
| _Roll_RA | 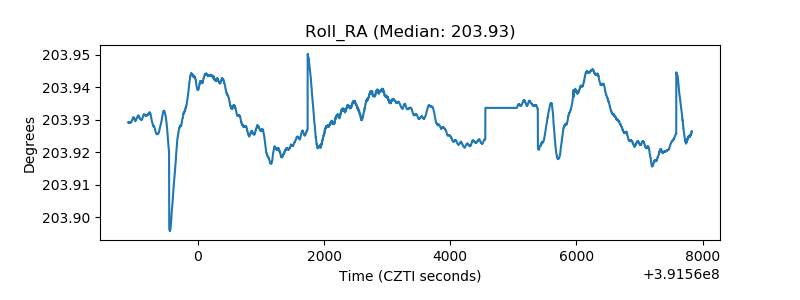 |
| Veto Counter | 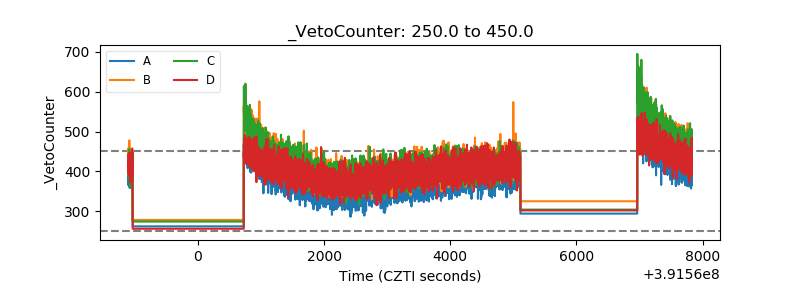 |