| Param | Original file | Final file |
|---|---|---|
| Filename | modeM0/AS1T04_069T01_9000005158_36055cztM0_level2.evt | modeM0/AS1T04_069T01_9000005158_36055cztM0_level2_quad_clean.evt |
| Size (bytes) | 473,054,400 | 62,769,600 |
| Size | 451.1 MB | 59.9 MB |
| Events in quadrant A | 2,531,369 | 402,689 |
| Events in quadrant B | 4,790,146 | 377,948 |
| Events in quadrant C | 2,998,063 | 387,858 |
| Events in quadrant D | 3,648,022 | 361,407 |
| Mode M0 | |||
|---|---|---|---|
| Quadrant | BADHDUFLAG | Total packets | Discarded packets |
| A | 0 | 10955 | 3 |
| B | 0 | 17740 | 2 |
| C | 0 | 12043 | 2 |
| D | 0 | 14484 | 2 |
| Mode M9 | |||
|---|---|---|---|
| Quadrant | BADHDUFLAG | Total packets | Discarded packets |
| A | 0 | 25 | 0 |
| B | 0 | 25 | 0 |
| C | 0 | 25 | 0 |
| D | 0 | 26 | 0 |
| Mode SS | |||
|---|---|---|---|
| Quadrant | BADHDUFLAG | Total packets | Discarded packets |
| A | 0 | 106 | 0 |
| B | 0 | 106 | 0 |
| C | 0 | 106 | 0 |
| D | 0 | 106 | 0 |
| Quadrant | Total seconds | Saturated seconds | Saturation percentage |
|---|---|---|---|
| A | 5293 | 5 | 0.094464% |
| B | 5293 | 713 | 13.470622% |
| C | 5293 | 73 | 1.379180% |
| D | 5293 | 279 | 5.271113% |
Noise dominated data is calculated using 1-second bins in cleaned event files. If a bin has >2000 counts, and if more than 50% of those come from <1% of pixels, then it is considered to be noise-dominated and hence unusable.
| Quadrant | # 1 sec bins | Bins with >0 counts | Bins with >2000 counts | High rate bins dominated by noise | Noise dominated (total time) | Noise dominated (detector-on time) | Marked lightcurve |
|---|---|---|---|---|---|---|---|
| A | 7056 | 5294 | 0 | 0 | 0.00% | 0.00% | 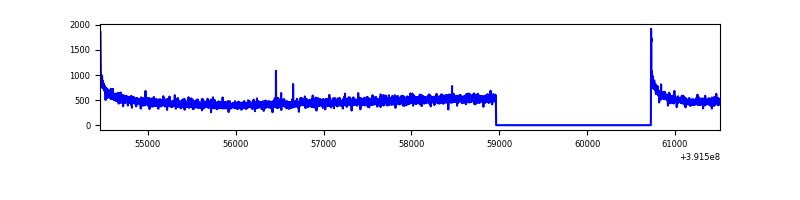 |
| B | 7056 | 5294 | 516 | 516 | 7.31% | 9.75% | 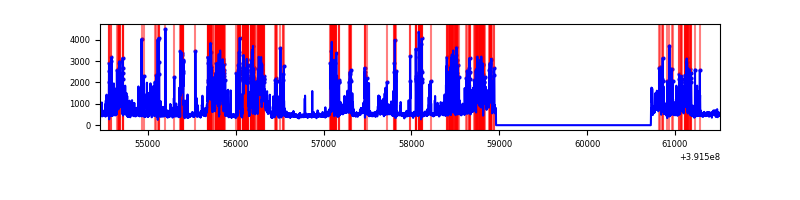 |
| C | 7056 | 5294 | 63 | 63 | 0.89% | 1.19% | 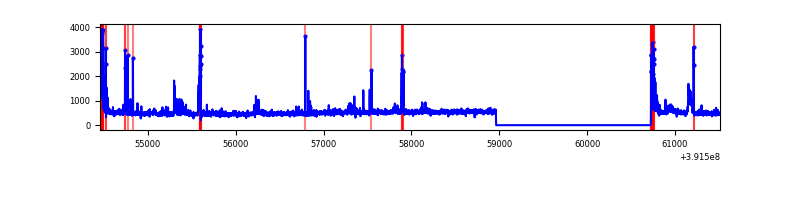 |
| D | 7056 | 5294 | 260 | 260 | 3.68% | 4.91% | 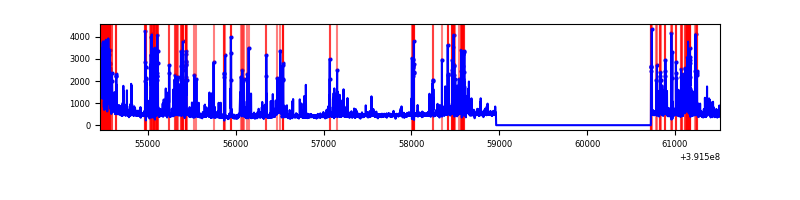 |
Top three noisy pixels from each quadrant. If the there are fewer than three noisy pixels in the level2.evt file, extra rows are filled as -1
| Pixel properties | Quadrant properties | ||||||
|---|---|---|---|---|---|---|---|
| Quadrant | DetID | PixID | Counts | Sigma | Mean | Median | Sigma |
| A | 10 | 83 | 167932 | 1355.49 | 606 | 593 | 123.5 |
| A | 13 | 6 | 12896 | 99.66 | 606 | 593 | 123.5 |
| A | 13 | 254 | 8281 | 62.27 | 606 | 593 | 123.5 |
| B | 5 | 236 | 1792022 | 16053.76 | 575 | 560 | 111.6 |
| B | 0 | 190 | 316622 | 2832.31 | 575 | 560 | 111.6 |
| B | 5 | 172 | 179392 | 1602.56 | 575 | 560 | 111.6 |
| C | 9 | 187 | 240133 | 1738.61 | 585 | 590 | 137.8 |
| C | 15 | 214 | 219518 | 1588.98 | 585 | 590 | 137.8 |
| C | 0 | 10 | 205458 | 1486.94 | 585 | 590 | 137.8 |
| D | 12 | 6 | 621362 | 4419.95 | 573 | 558 | 140.5 |
| D | 1 | 52 | 241467 | 1715.21 | 573 | 558 | 140.5 |
| D | 13 | 249 | 160564 | 1139.2 | 573 | 558 | 140.5 |
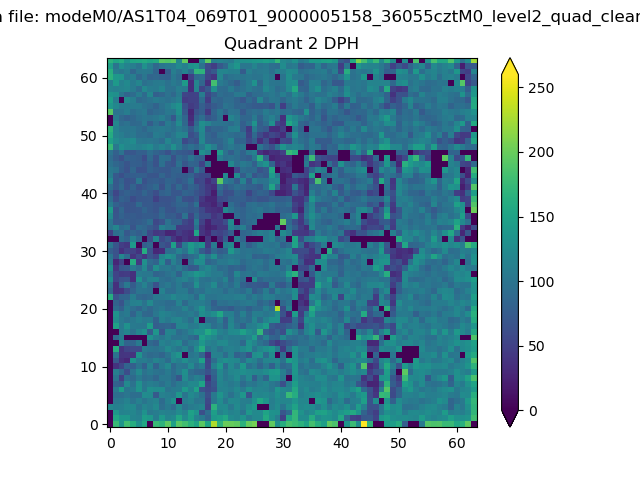
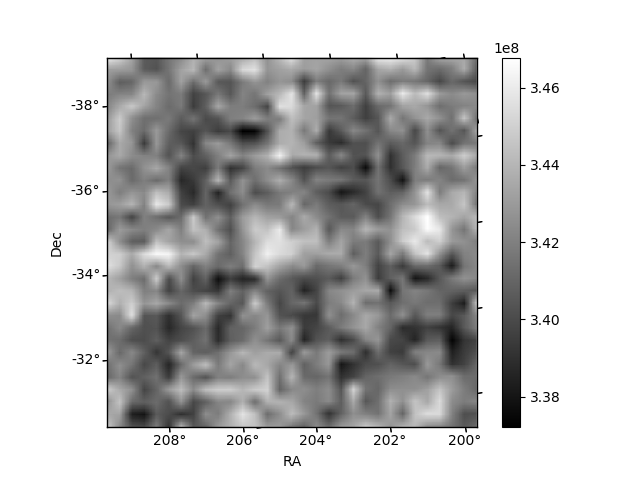
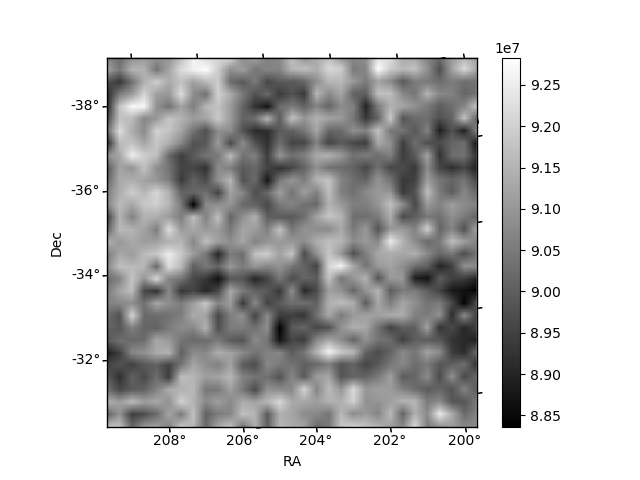
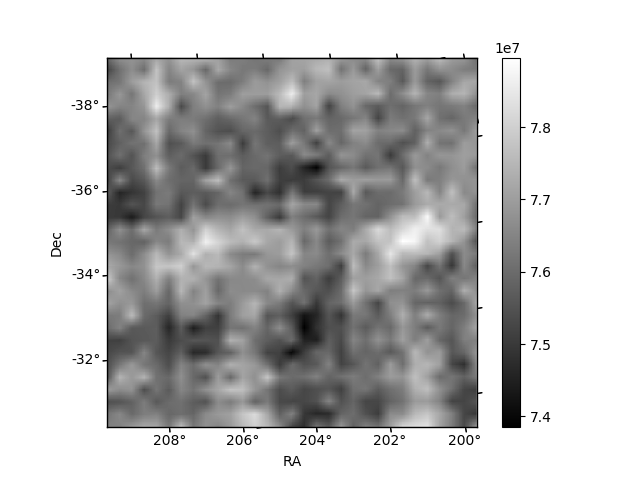
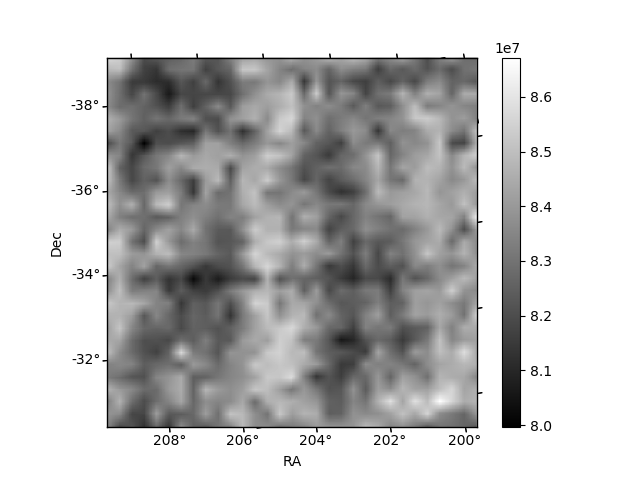
Histogram calculated using DETX and DETY for each event in the final _common_clean file
| Quadrant A | 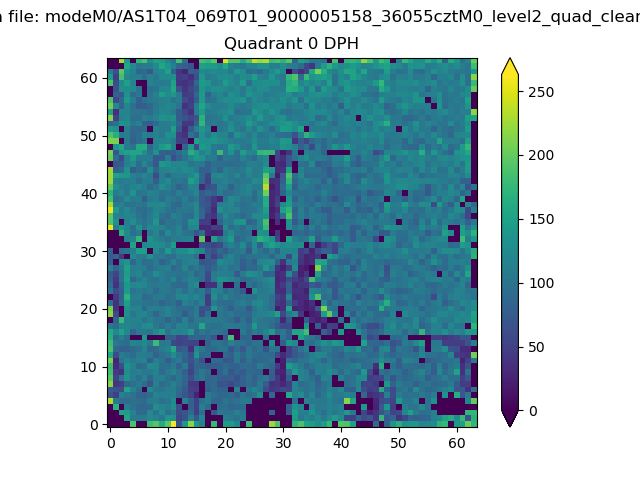 |
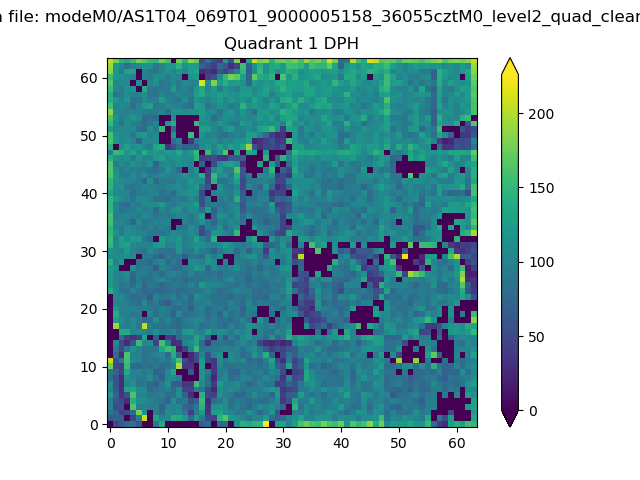 |
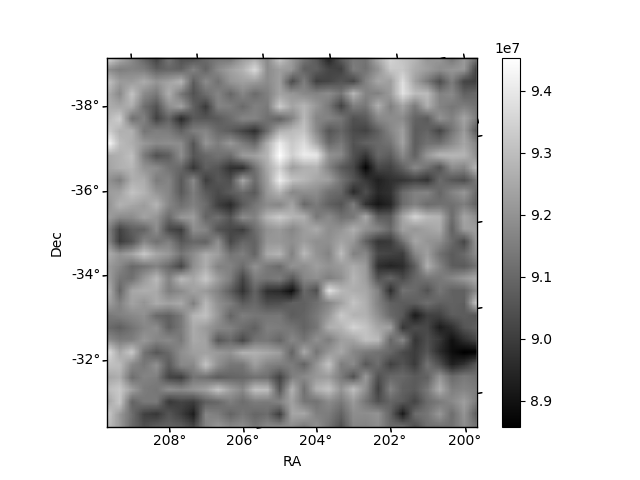
Quadrant B |
|---|---|---|---|
| Quadrant D | 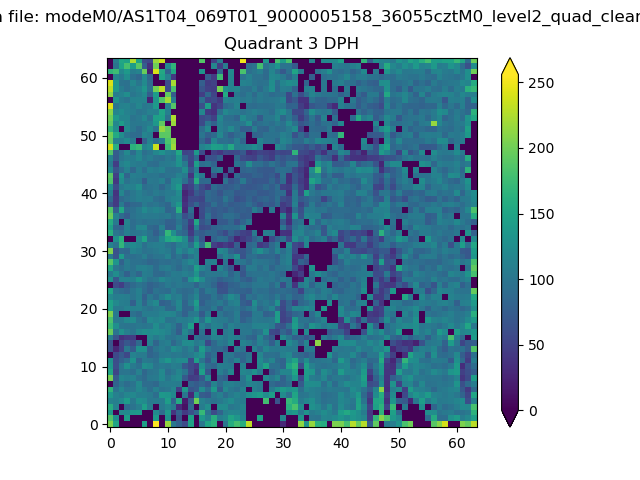 |
 |
Quadrant C |
| Plot type | Count rate plots | Images |
|---|---|---|
| Comparison with Poisson distribution Blue bars denote a histogram of data divided into 1 sec bins. Red curve is a Poisson curve with rate = median count rate of data. |
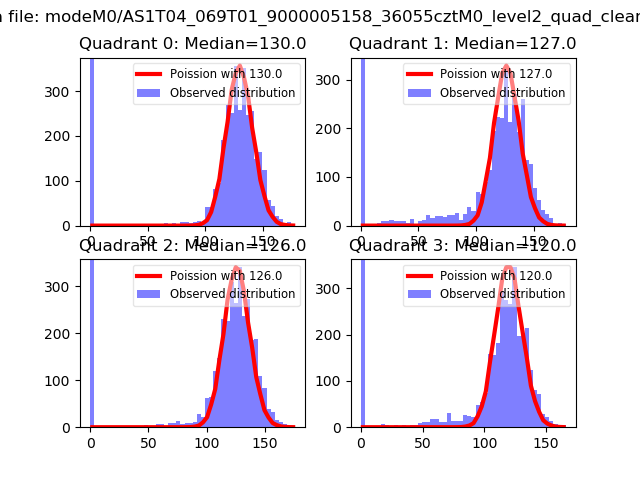 |
 |
| Quadrant-wise count rates Data is divided into 100 sec bins |
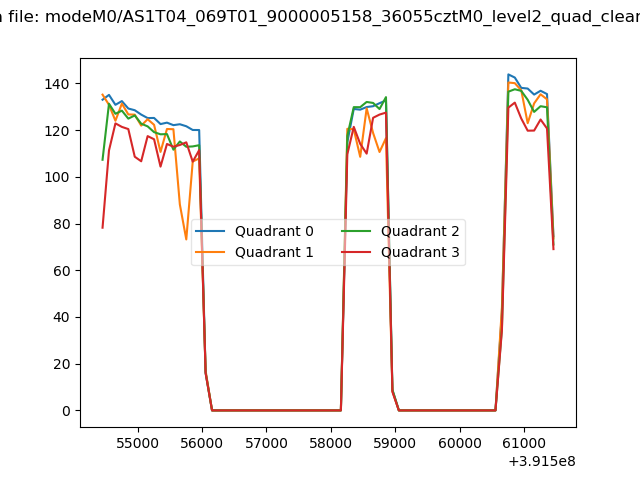 |
|
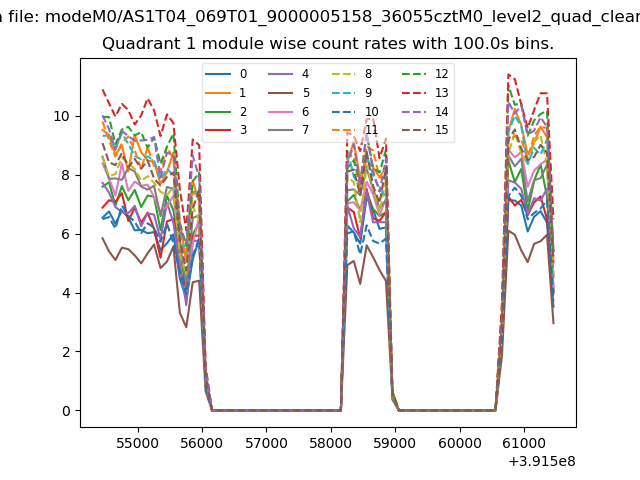
| Module-wise count rates for Quadrant A Data is divided into 100 sec bins |
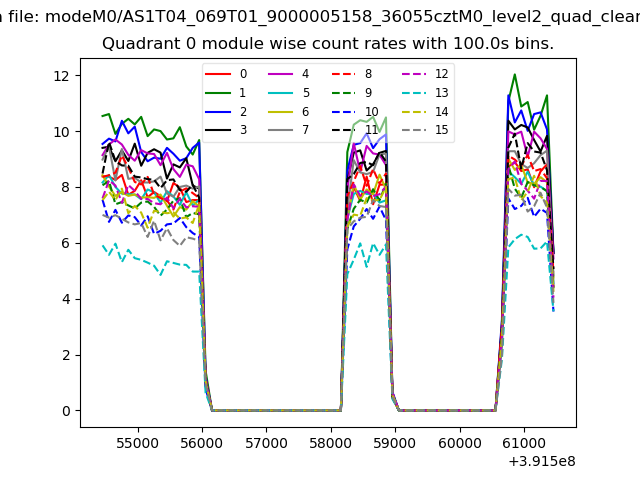 |
 |
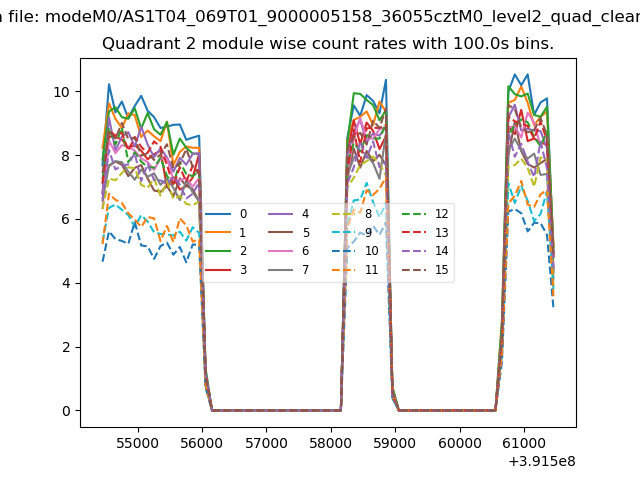
| Module-wise count rates for Quadrant B Data is divided into 100 sec bins |
 |
 |
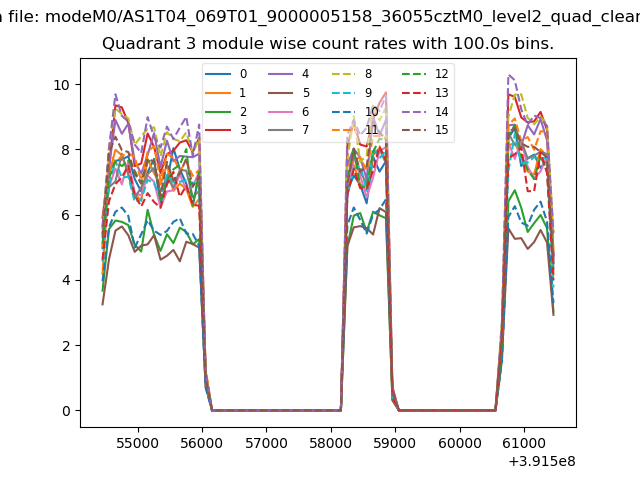
| Module-wise count rates for Quadrant C Data is divided into 100 sec bins |
 |
 |
| Module-wise count rates for Quadrant D Data is divided into 100 sec bins |
 |
 |
| Parameter | Plot |
|---|---|
| CZT HV Monitor | 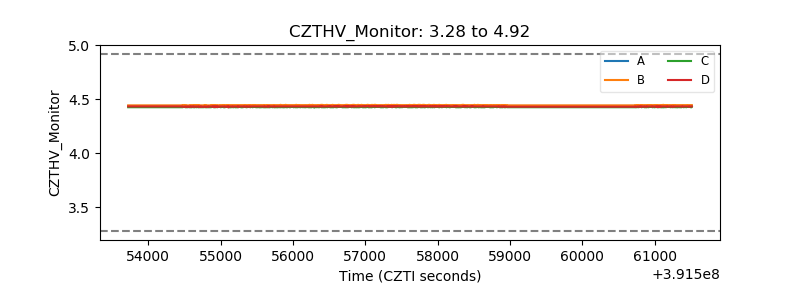 |
| D_VDD | 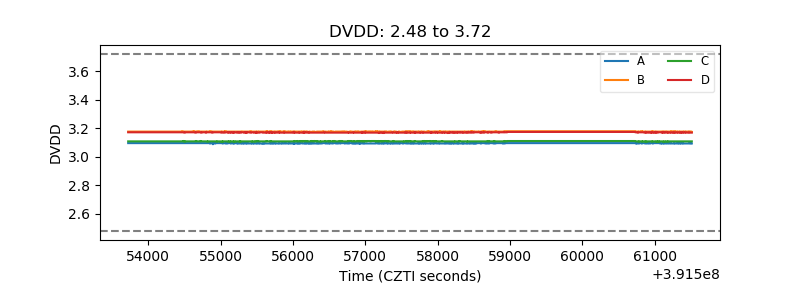 |
| Temperature 1 | 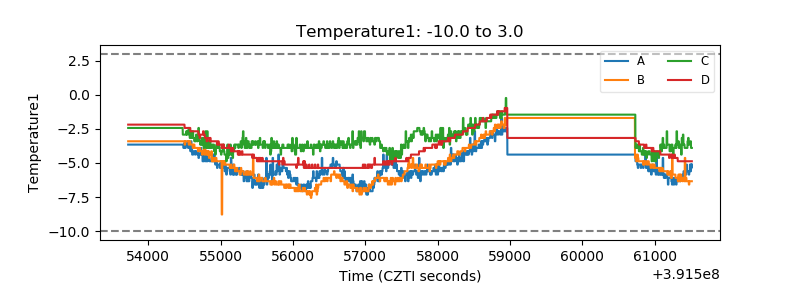 |
| Veto HV Monitor | 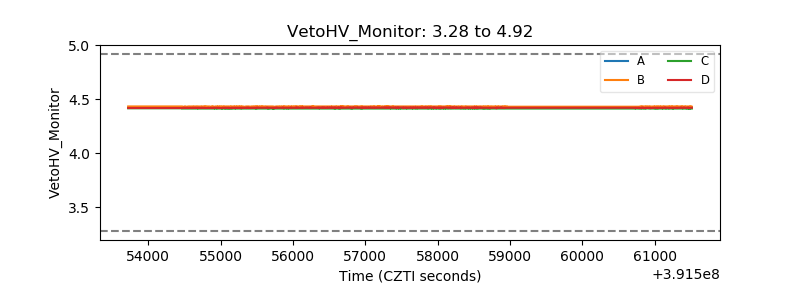 |
| Veto LLD | 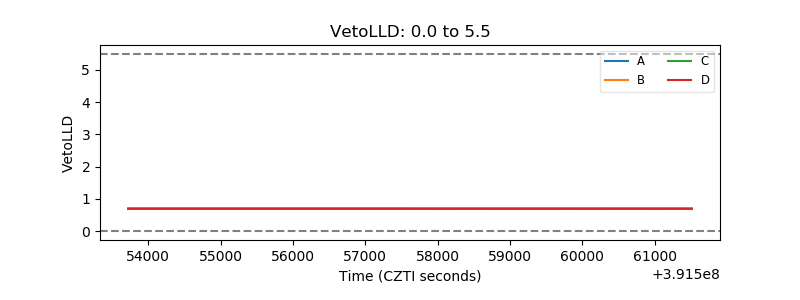 |
| Alpha Counter | 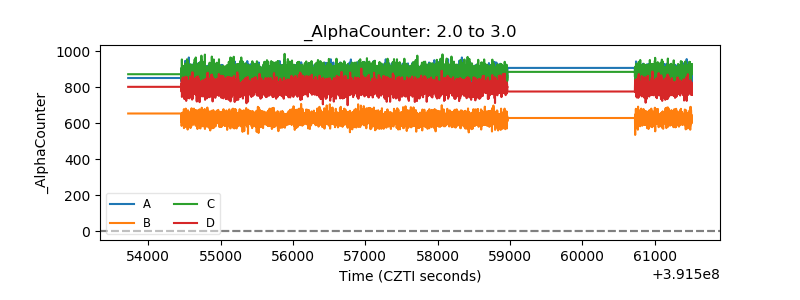 |
| _CPM_Rate | 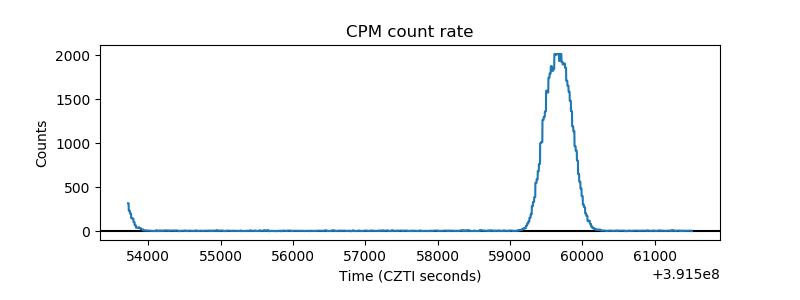 |
| CZT Counter | 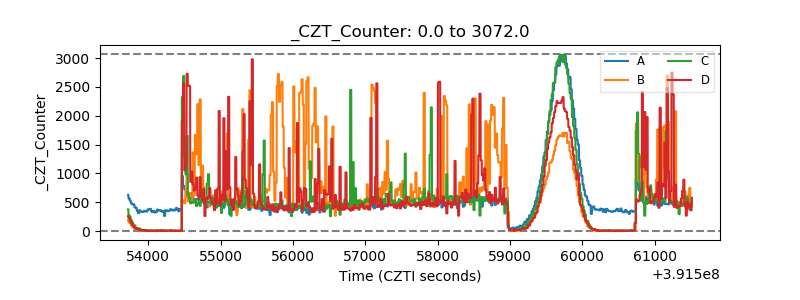 |
| +2.5 Volts monitor | 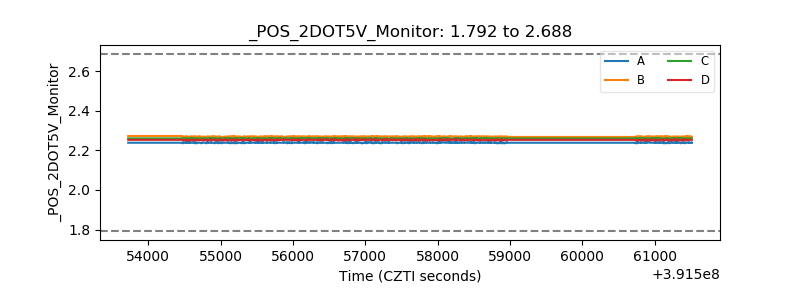 |
| +5 Volts monitor | 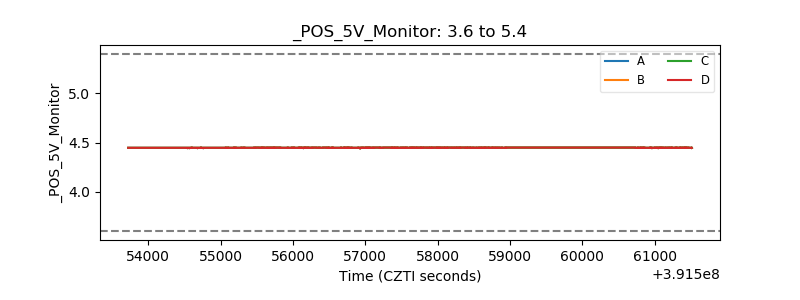 |
| _ROLL_ROT | 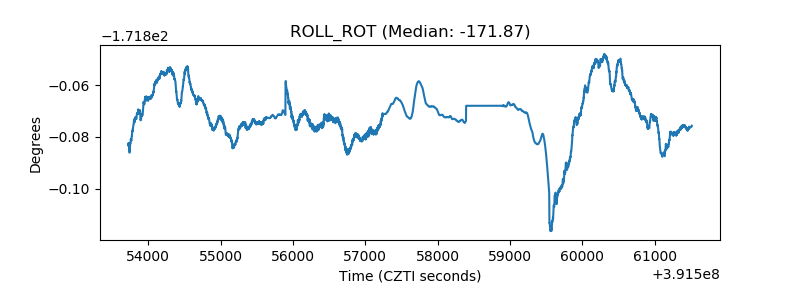 |
| _Roll_DEC | 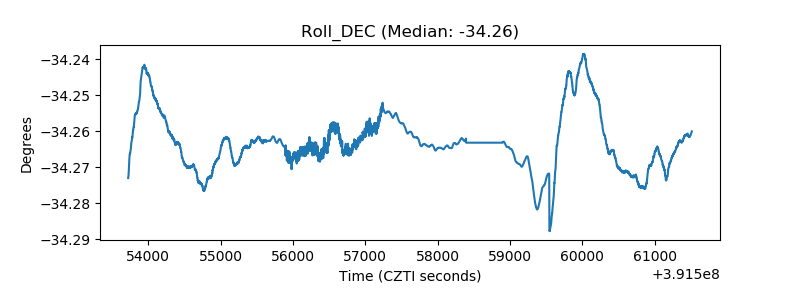 |
| _Roll_RA | 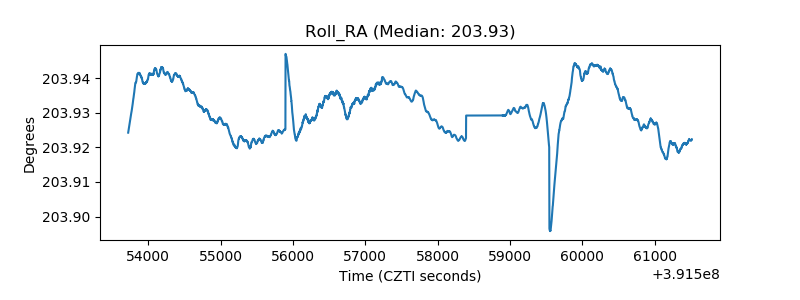 |
| Veto Counter | 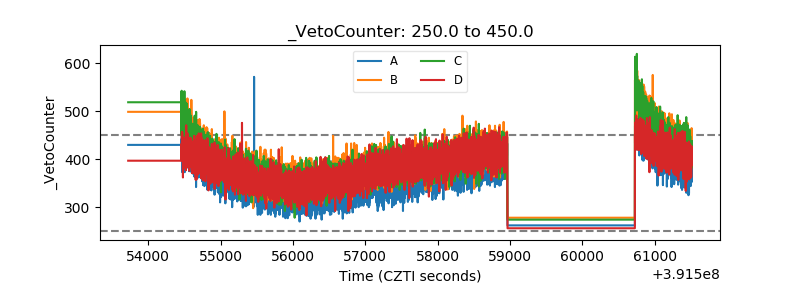 |