| Param | Original file | Final file |
|---|---|---|
| Filename | modeM0/AS1T04_069T01_9000005158_36053cztM0_level2.evt | modeM0/AS1T04_069T01_9000005158_36053cztM0_level2_quad_clean.evt |
| Size (bytes) | 485,807,040 | 65,240,640 |
| Size | 463.3 MB | 62.2 MB |
| Events in quadrant A | 2,628,476 | 418,190 |
| Events in quadrant B | 3,533,923 | 405,862 |
| Events in quadrant C | 4,117,210 | 386,488 |
| Events in quadrant D | 4,057,249 | 376,942 |
| Mode M0 | |||
|---|---|---|---|
| Quadrant | BADHDUFLAG | Total packets | Discarded packets |
| A | 0 | 11490 | 3 |
| B | 0 | 14133 | 2 |
| C | 0 | 15854 | 2 |
| D | 0 | 15852 | 2 |
| Mode M9 | |||
|---|---|---|---|
| Quadrant | BADHDUFLAG | Total packets | Discarded packets |
| A | 0 | 25 | 0 |
| B | 0 | 25 | 0 |
| C | 0 | 25 | 0 |
| D | 0 | 26 | 0 |
| Mode SS | |||
|---|---|---|---|
| Quadrant | BADHDUFLAG | Total packets | Discarded packets |
| A | 0 | 114 | 0 |
| B | 0 | 114 | 0 |
| C | 0 | 114 | 0 |
| D | 0 | 114 | 0 |
| Quadrant | Total seconds | Saturated seconds | Saturation percentage |
|---|---|---|---|
| A | 5535 | 13 | 0.234869% |
| B | 5535 | 189 | 3.414634% |
| C | 5535 | 337 | 6.088528% |
| D | 5535 | 333 | 6.016260% |
Noise dominated data is calculated using 1-second bins in cleaned event files. If a bin has >2000 counts, and if more than 50% of those come from <1% of pixels, then it is considered to be noise-dominated and hence unusable.
| Quadrant | # 1 sec bins | Bins with >0 counts | Bins with >2000 counts | High rate bins dominated by noise | Noise dominated (total time) | Noise dominated (detector-on time) | Marked lightcurve |
|---|---|---|---|---|---|---|---|
| A | 7149 | 5536 | 0 | 0 | 0.00% | 0.00% | 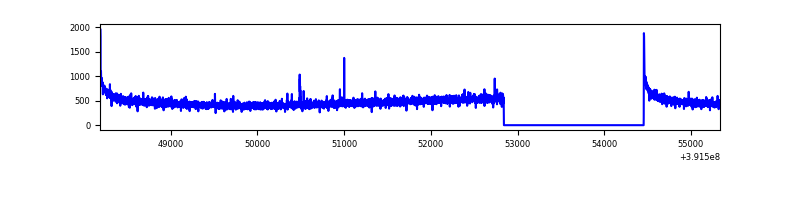 |
| B | 7149 | 5536 | 110 | 110 | 1.54% | 1.99% | 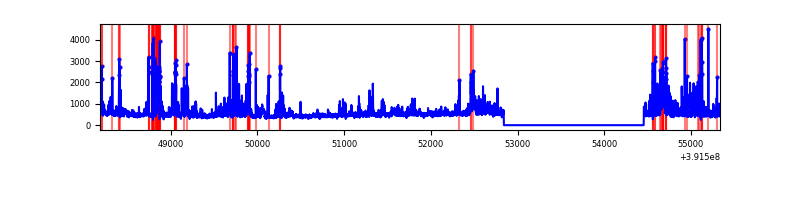 |
| C | 7149 | 5536 | 262 | 262 | 3.66% | 4.73% | 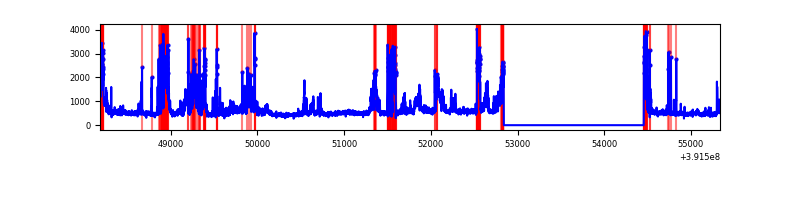 |
| D | 7149 | 5536 | 303 | 303 | 4.24% | 5.47% | 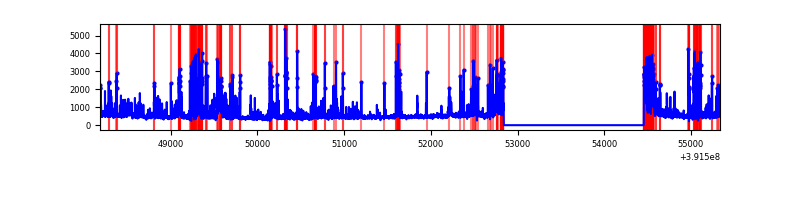 |
Top three noisy pixels from each quadrant. If the there are fewer than three noisy pixels in the level2.evt file, extra rows are filled as -1
| Pixel properties | Quadrant properties | ||||||
|---|---|---|---|---|---|---|---|
| Quadrant | DetID | PixID | Counts | Sigma | Mean | Median | Sigma |
| A | 10 | 83 | 177840 | 1377.69 | 628 | 615 | 128.6 |
| A | 13 | 254 | 9074 | 65.76 | 628 | 615 | 128.6 |
| A | 13 | 6 | 7724 | 55.26 | 628 | 615 | 128.6 |
| B | 5 | 236 | 726017 | 6042.74 | 618 | 602 | 120.0 |
| B | 0 | 190 | 175416 | 1456.21 | 618 | 602 | 120.0 |
| B | 4 | 232 | 77104 | 637.27 | 618 | 602 | 120.0 |
| C | 9 | 187 | 1255266 | 9063.72 | 589 | 592 | 138.4 |
| C | 15 | 214 | 225181 | 1622.42 | 589 | 592 | 138.4 |
| C | 0 | 10 | 186366 | 1342.02 | 589 | 592 | 138.4 |
| D | 12 | 6 | 547143 | 3770.74 | 590 | 573 | 145.0 |
| D | 1 | 52 | 388405 | 2675.62 | 590 | 573 | 145.0 |
| D | 7 | 223 | 183047 | 1258.87 | 590 | 573 | 145.0 |
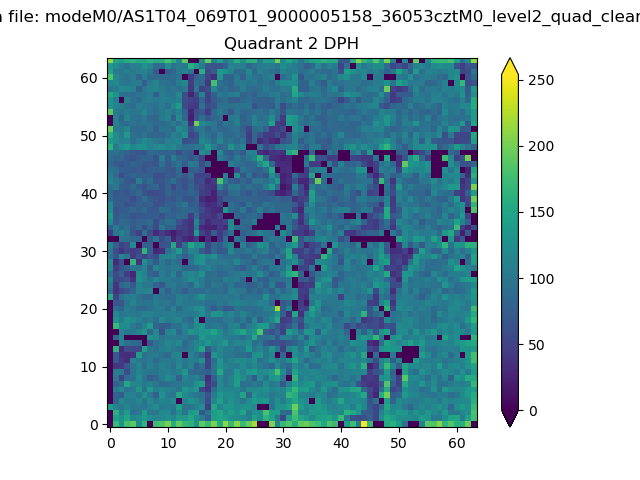
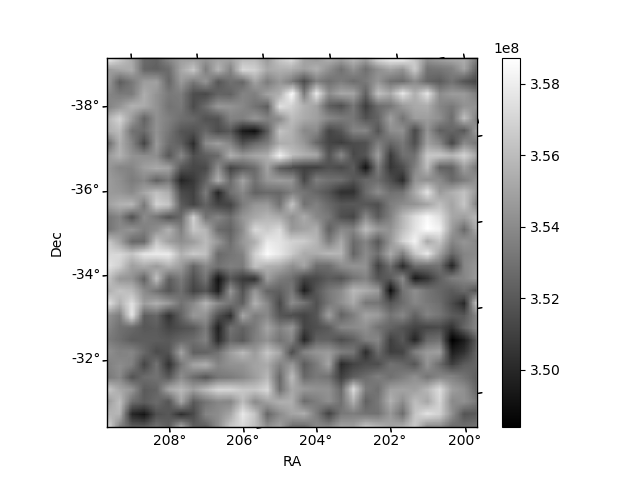
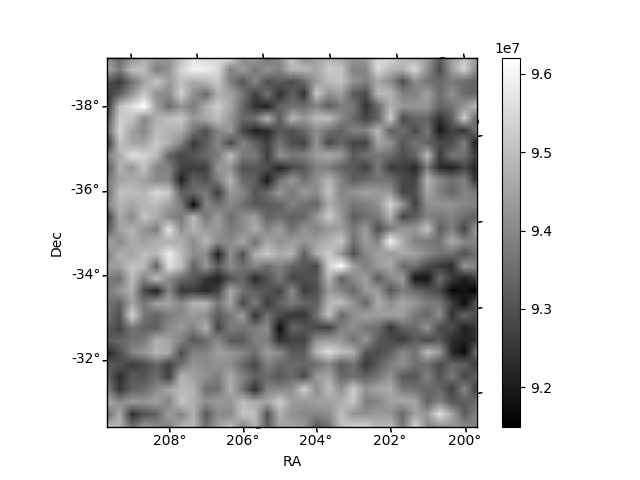
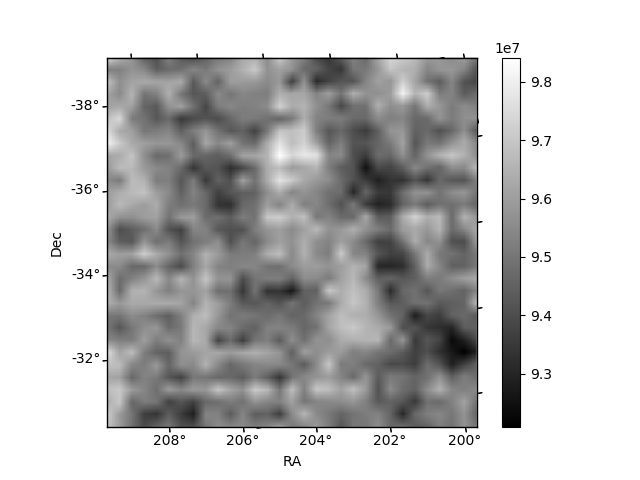
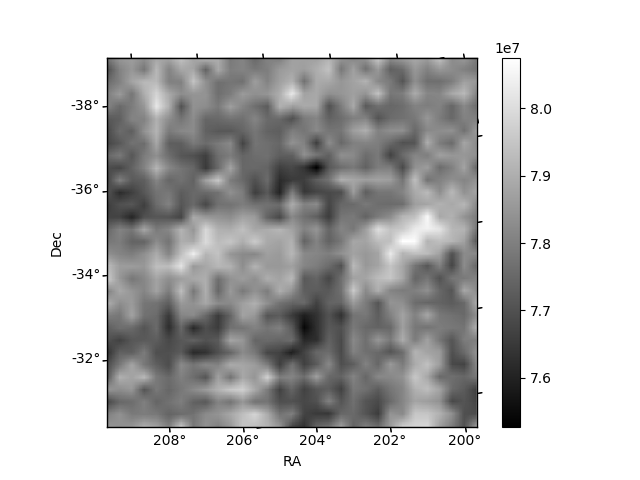
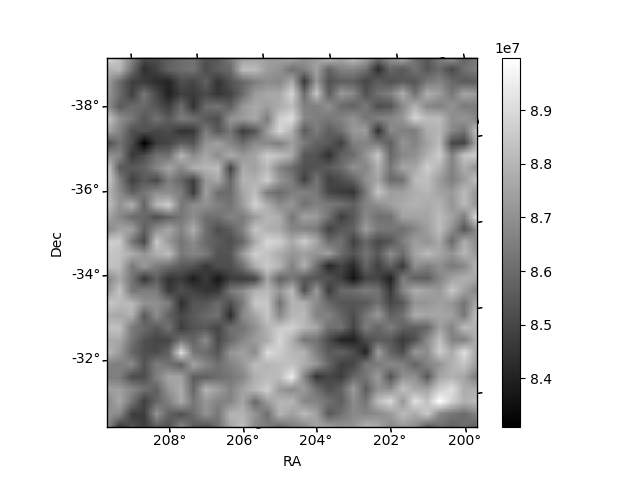
Histogram calculated using DETX and DETY for each event in the final _common_clean file
| Quadrant A | 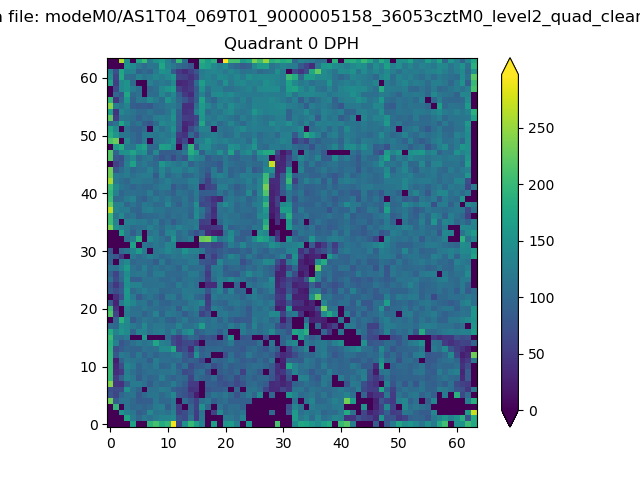 |
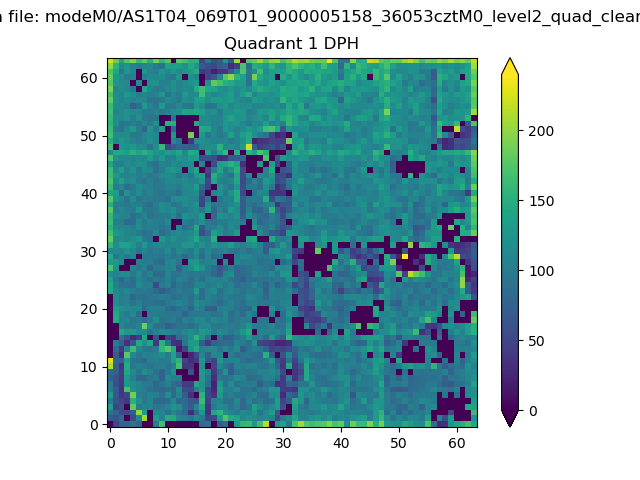 |
Quadrant B |
|---|---|---|---|
| Quadrant D | 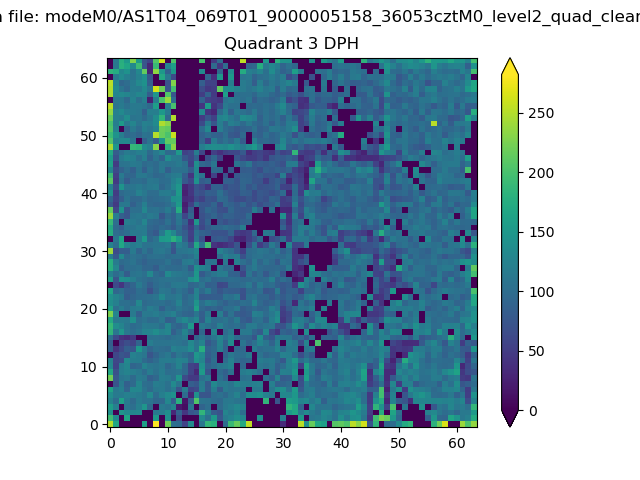 |
 |
Quadrant C |
| Plot type | Count rate plots | Images |
|---|---|---|
| Comparison with Poisson distribution Blue bars denote a histogram of data divided into 1 sec bins. Red curve is a Poisson curve with rate = median count rate of data. |
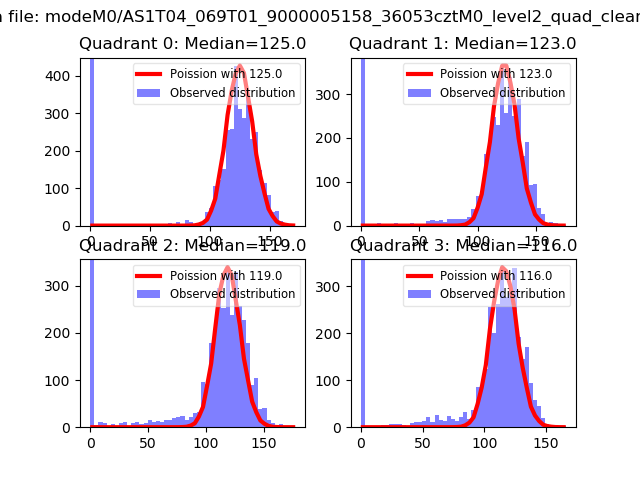 |
 |
| Quadrant-wise count rates Data is divided into 100 sec bins |
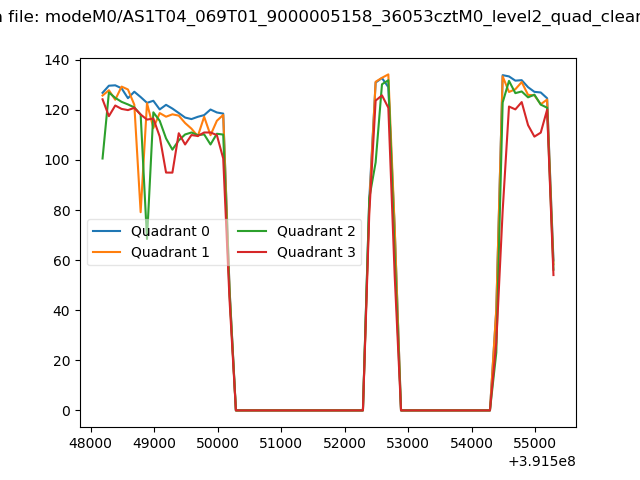 |
|
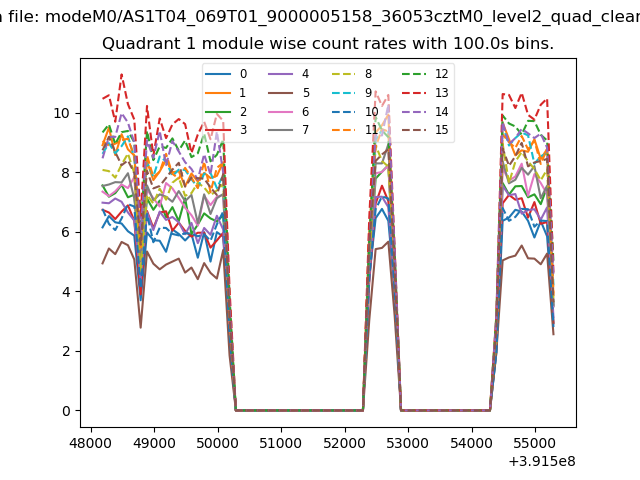
| Module-wise count rates for Quadrant A Data is divided into 100 sec bins |
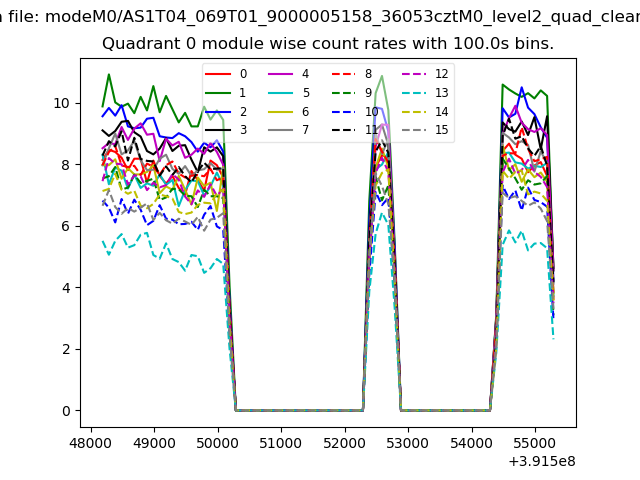 |
 |
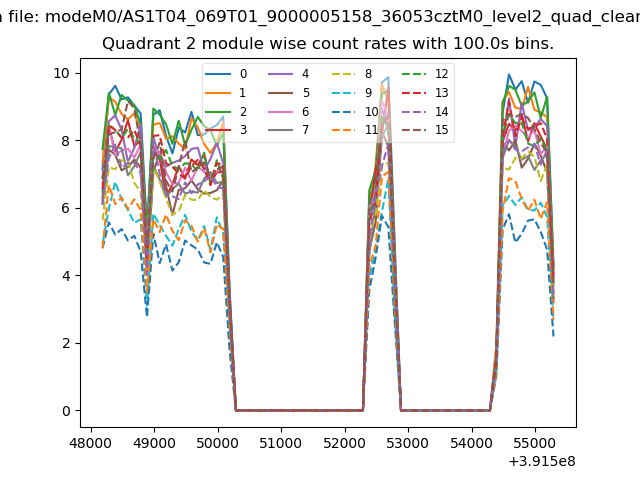
| Module-wise count rates for Quadrant B Data is divided into 100 sec bins |
 |
 |
| Module-wise count rates for Quadrant C Data is divided into 100 sec bins |
 |
 |
| Module-wise count rates for Quadrant D Data is divided into 100 sec bins |
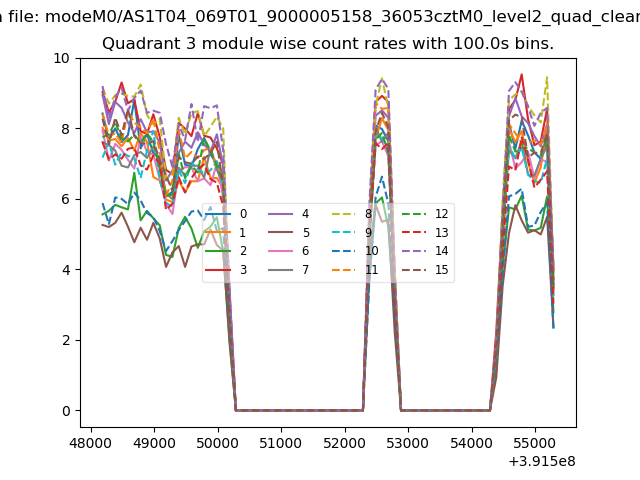 |
 |
| Parameter | Plot |
|---|---|
| CZT HV Monitor | 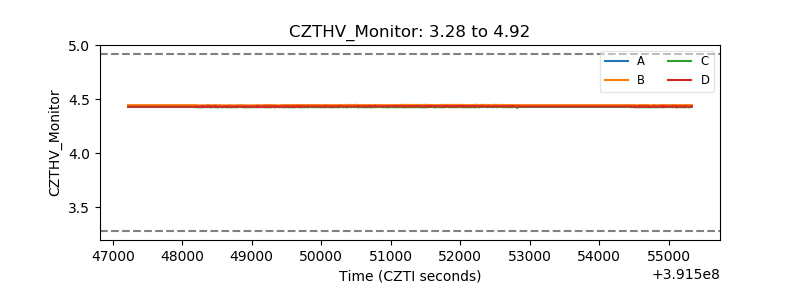 |
| D_VDD | 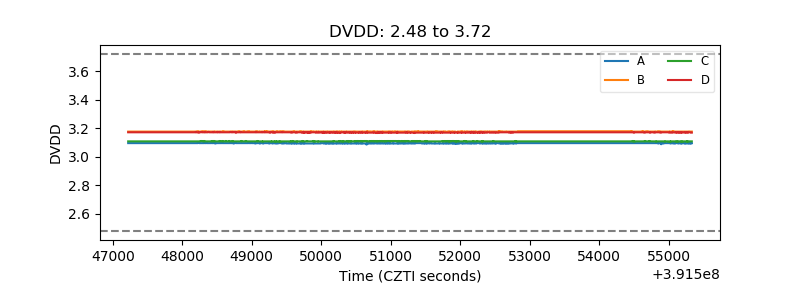 |
| Temperature 1 | 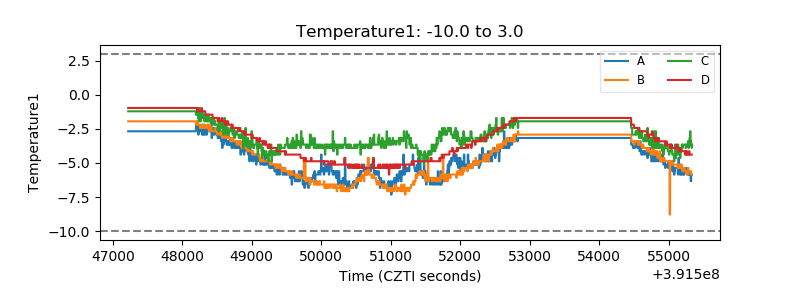 |
| Veto HV Monitor | 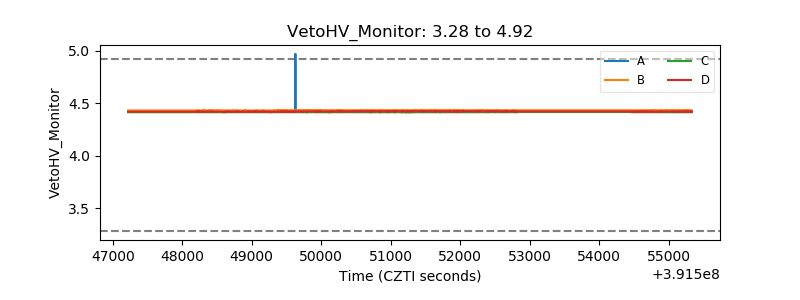 |
| Veto LLD | 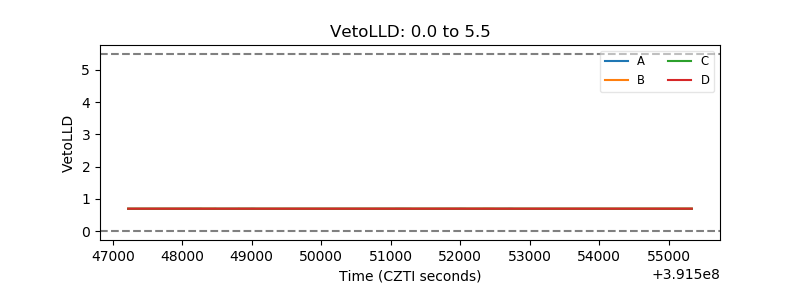 |
| Alpha Counter | 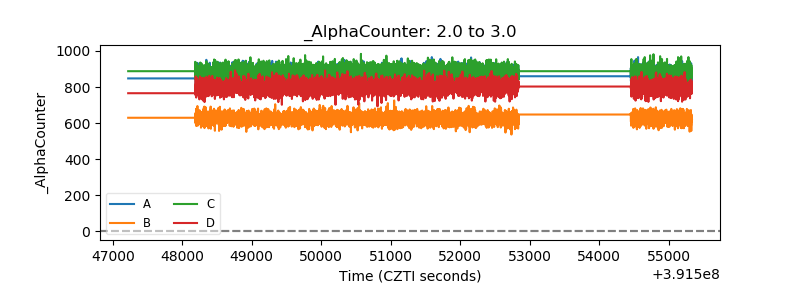 |
| _CPM_Rate | 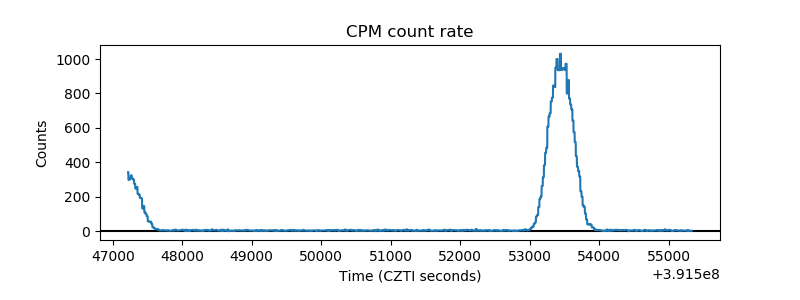 |
| CZT Counter | 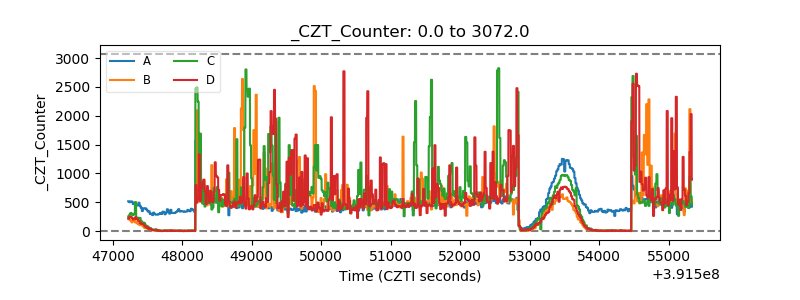 |
| +2.5 Volts monitor | 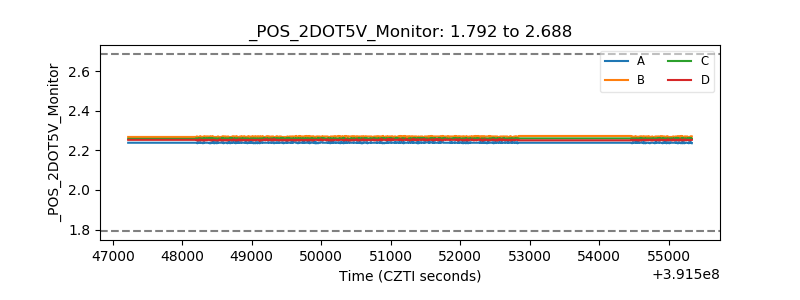 |
| +5 Volts monitor | 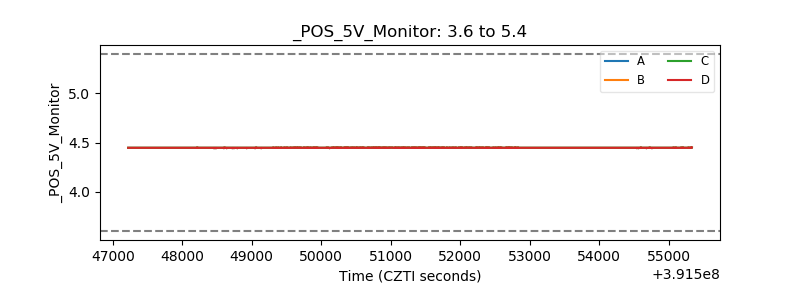 |
| _ROLL_ROT | 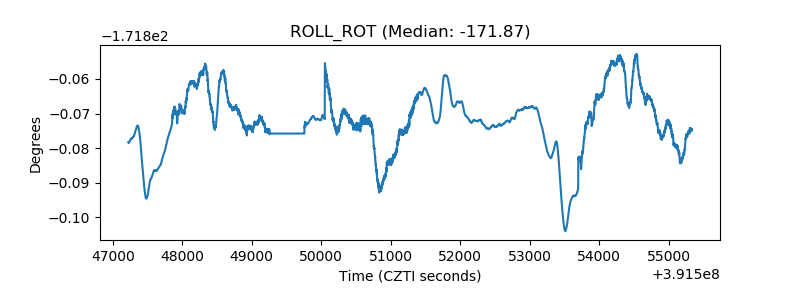 |
| _Roll_DEC | 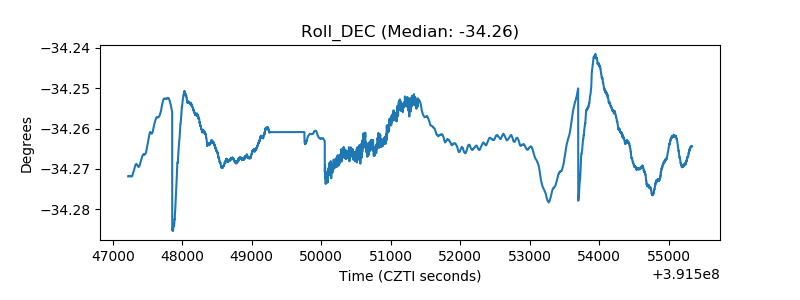 |
| _Roll_RA | 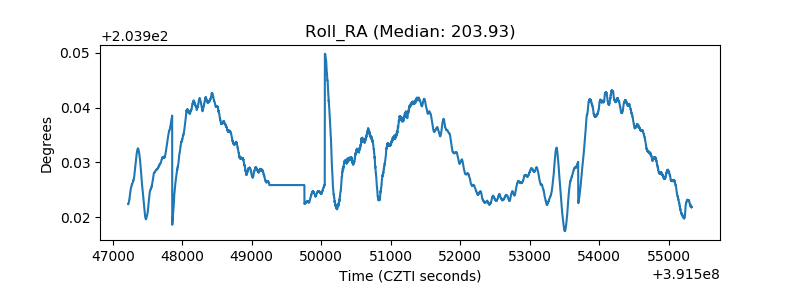 |
| Veto Counter |  |