| Param | Original file | Final file |
|---|---|---|
| Filename | modeM0/AS1T04_069T01_9000005158_36049cztM0_level2.evt | modeM0/AS1T04_069T01_9000005158_36049cztM0_level2_quad_clean.evt |
| Size (bytes) | 640,558,080 | 82,448,640 |
| Size | 610.9 MB | 78.6 MB |
| Events in quadrant A | 2,855,461 | 556,129 |
| Events in quadrant B | 4,476,079 | 529,289 |
| Events in quadrant C | 3,756,510 | 544,933 |
| Events in quadrant D | 7,908,425 | 449,581 |
| Mode M0 | |||
|---|---|---|---|
| Quadrant | BADHDUFLAG | Total packets | Discarded packets |
| A | 0 | 12257 | 3 |
| B | 0 | 17126 | 2 |
| C | 0 | 14902 | 2 |
| D | 0 | 27528 | 2 |
| Mode M9 | |||
|---|---|---|---|
| Quadrant | BADHDUFLAG | Total packets | Discarded packets |
| A | 0 | 27 | 0 |
| B | 0 | 27 | 0 |
| C | 0 | 27 | 0 |
| D | 0 | 27 | 0 |
| Mode SS | |||
|---|---|---|---|
| Quadrant | BADHDUFLAG | Total packets | Discarded packets |
| A | 0 | 124 | 0 |
| B | 0 | 124 | 0 |
| C | 0 | 124 | 0 |
| D | 0 | 124 | 0 |
| Quadrant | Total seconds | Saturated seconds | Saturation percentage |
|---|---|---|---|
| A | 5951 | 13 | 0.218451% |
| B | 5951 | 484 | 8.133087% |
| C | 5951 | 278 | 4.671484% |
| D | 5951 | 1659 | 27.877668% |
Noise dominated data is calculated using 1-second bins in cleaned event files. If a bin has >2000 counts, and if more than 50% of those come from <1% of pixels, then it is considered to be noise-dominated and hence unusable.
| Quadrant | # 1 sec bins | Bins with >0 counts | Bins with >2000 counts | High rate bins dominated by noise | Noise dominated (total time) | Noise dominated (detector-on time) | Marked lightcurve |
|---|---|---|---|---|---|---|---|
| A | 8697 | 5953 | 1 | 1 | 0.01% | 0.02% | 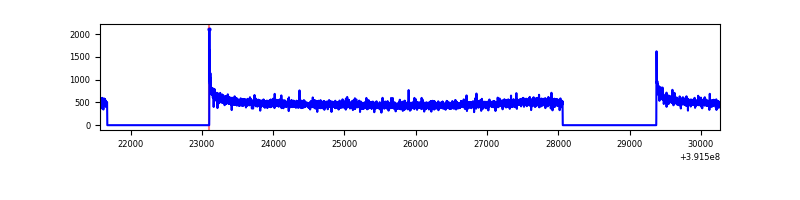 |
| B | 8697 | 5953 | 330 | 330 | 3.79% | 5.54% | 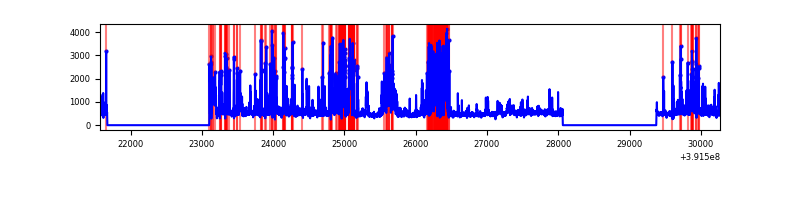 |
| C | 8697 | 5953 | 214 | 214 | 2.46% | 3.59% | 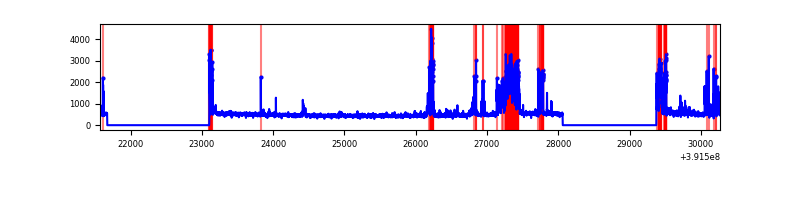 |
| D | 8696 | 5952 | 1527 | 1527 | 17.56% | 25.66% | 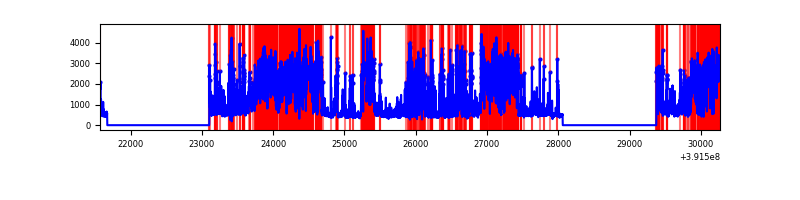 |
Top three noisy pixels from each quadrant. If the there are fewer than three noisy pixels in the level2.evt file, extra rows are filled as -1
| Pixel properties | Quadrant properties | ||||||
|---|---|---|---|---|---|---|---|
| Quadrant | DetID | PixID | Counts | Sigma | Mean | Median | Sigma |
| A | 10 | 83 | 184057 | 1317.69 | 685 | 671 | 139.2 |
| A | 13 | 254 | 9966 | 66.79 | 685 | 671 | 139.2 |
| A | 13 | 6 | 8167 | 53.86 | 685 | 671 | 139.2 |
| B | 5 | 236 | 1154739 | 9024.37 | 657 | 640 | 127.9 |
| B | 0 | 190 | 293359 | 2288.89 | 657 | 640 | 127.9 |
| B | 5 | 172 | 245368 | 1913.63 | 657 | 640 | 127.9 |
| C | 9 | 187 | 817883 | 5369.76 | 650 | 653 | 152.2 |
| C | 15 | 214 | 246213 | 1613.5 | 650 | 653 | 152.2 |
| C | 0 | 10 | 72454 | 471.78 | 650 | 653 | 152.2 |
| D | 12 | 235 | 4117663 | 28019.26 | 589 | 571 | 146.9 |
| D | 12 | 6 | 648248 | 4407.83 | 589 | 571 | 146.9 |
| D | 7 | 223 | 249324 | 1692.91 | 589 | 571 | 146.9 |
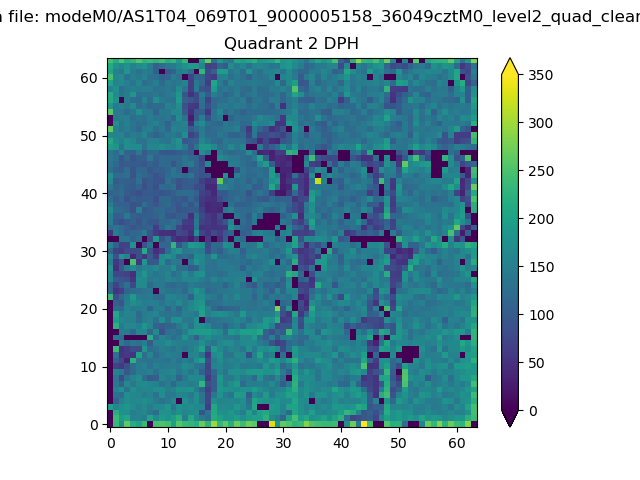
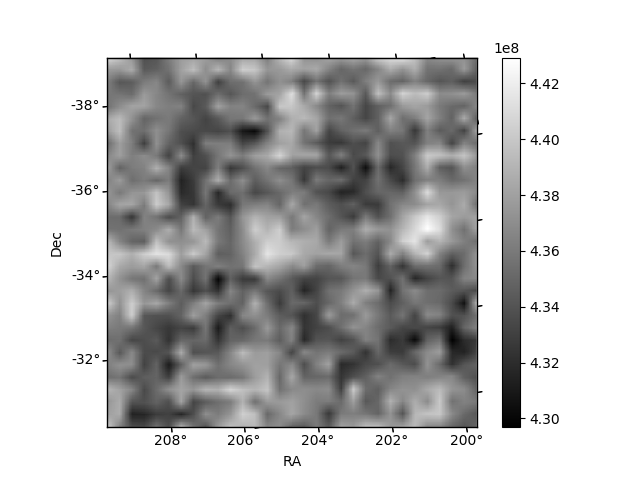
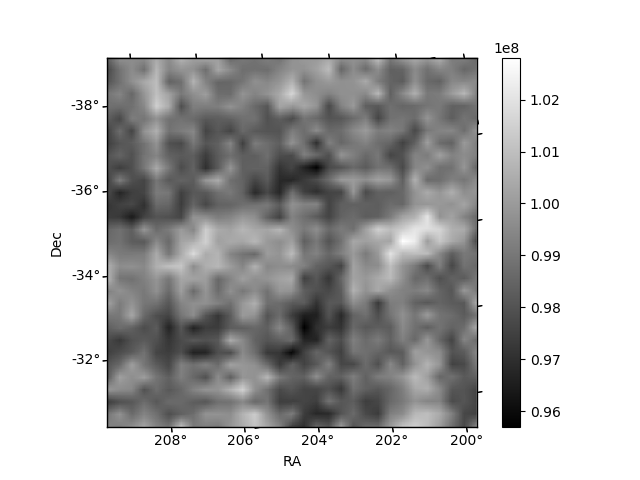
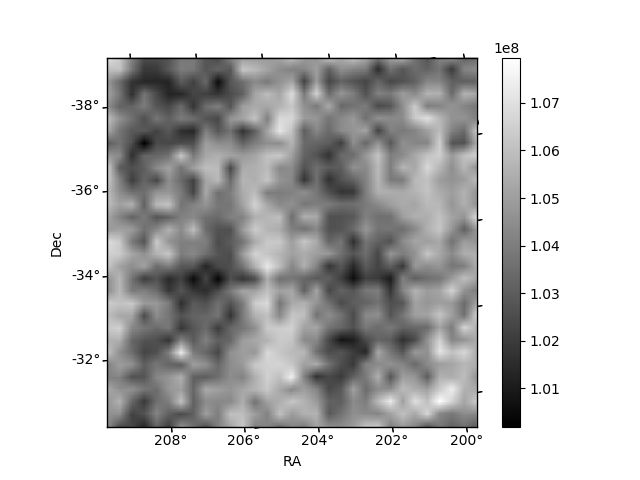
Histogram calculated using DETX and DETY for each event in the final _common_clean file
| Quadrant A | 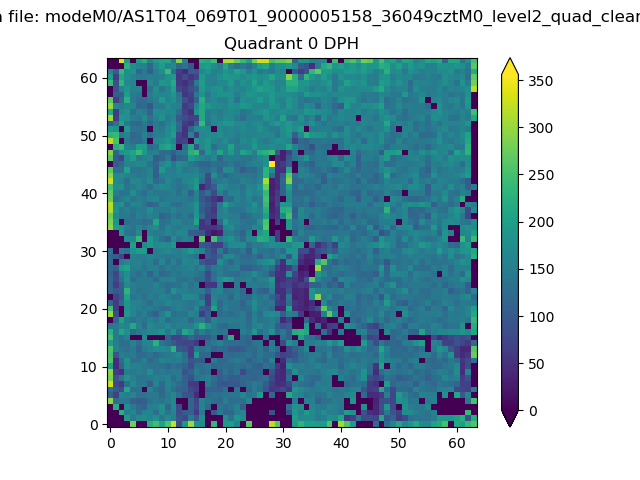 |
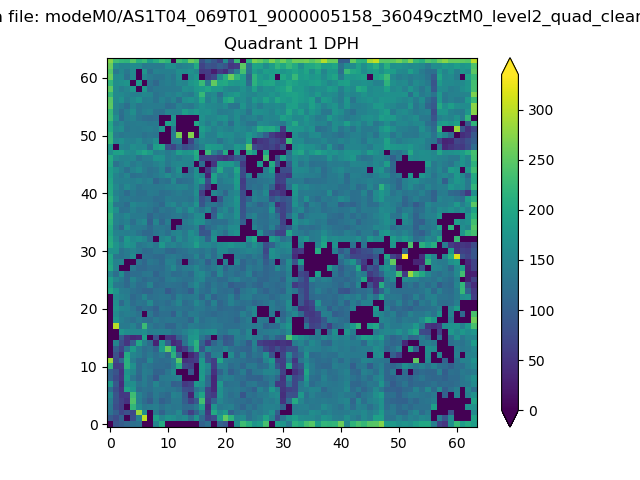 |
Quadrant B |
|---|---|---|---|
| Quadrant D | 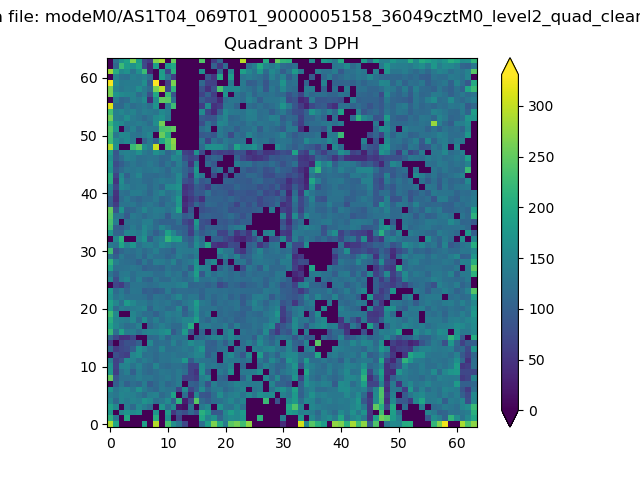 |
 |
Quadrant C |
| Plot type | Count rate plots | Images |
|---|---|---|
| Comparison with Poisson distribution Blue bars denote a histogram of data divided into 1 sec bins. Red curve is a Poisson curve with rate = median count rate of data. |
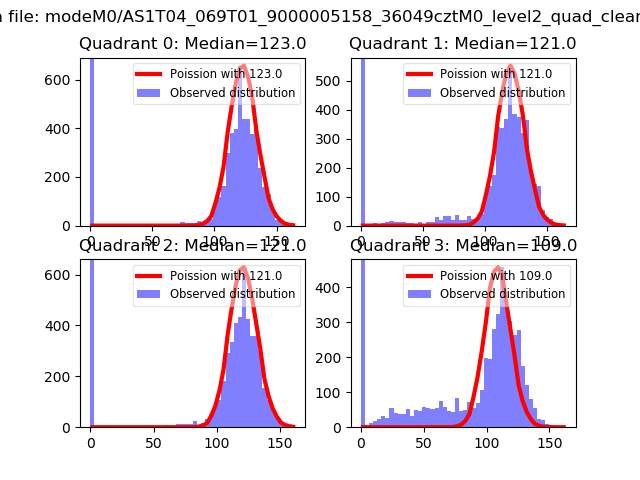 |
 |
| Quadrant-wise count rates Data is divided into 100 sec bins |
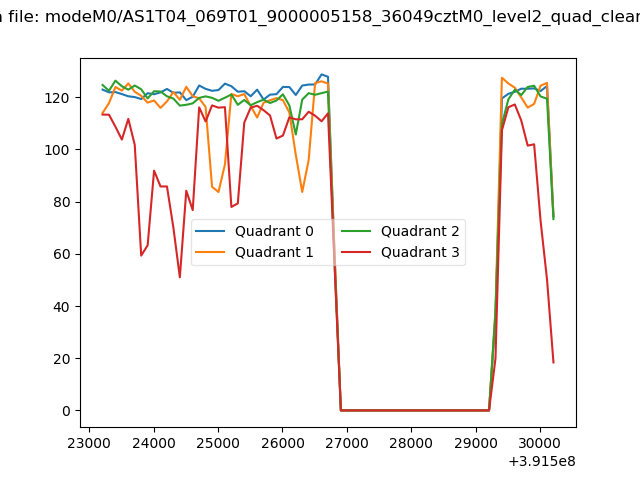 |
|
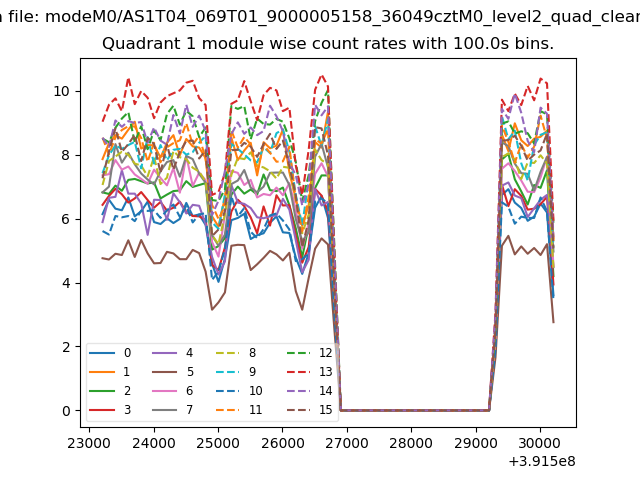
| Module-wise count rates for Quadrant A Data is divided into 100 sec bins |
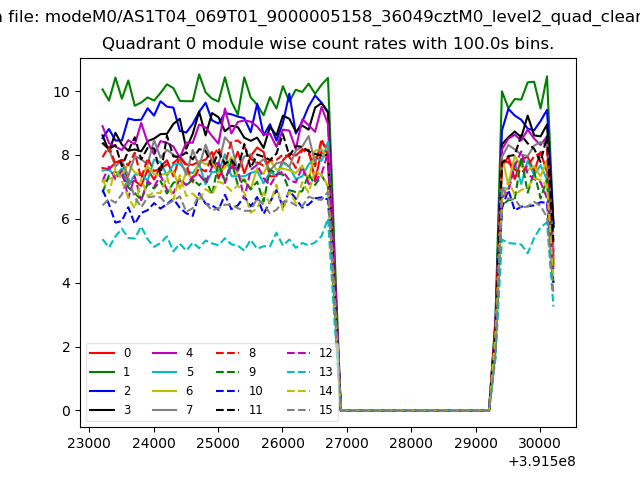 |
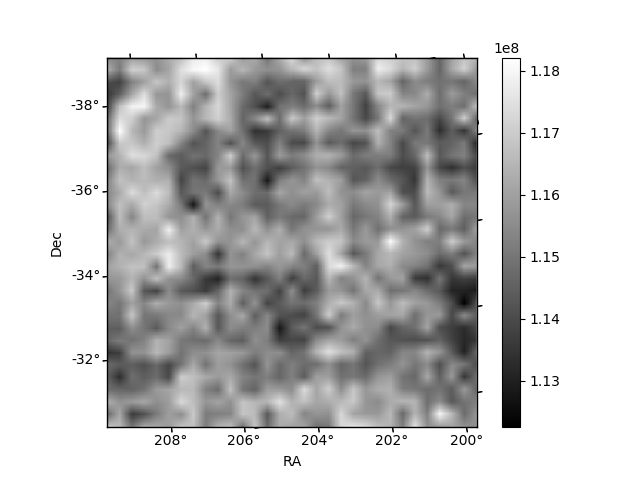 |
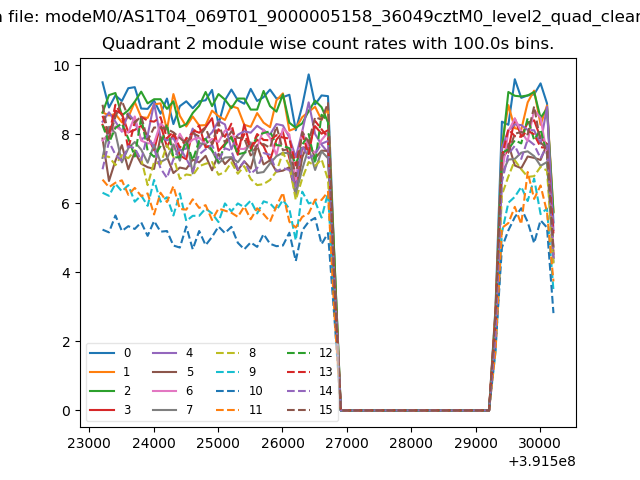
| Module-wise count rates for Quadrant B Data is divided into 100 sec bins |
 |
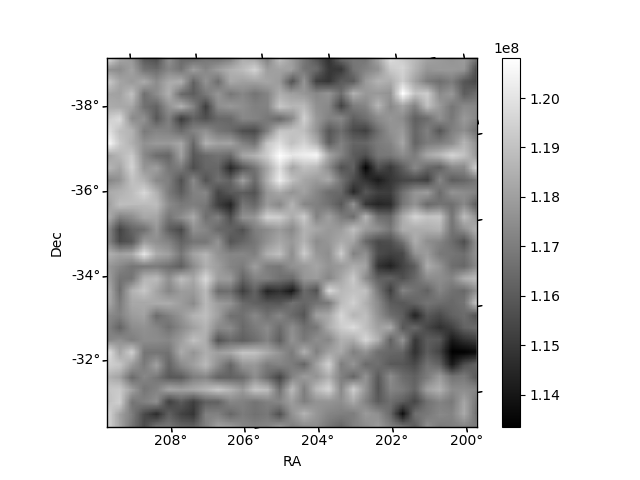 |
| Module-wise count rates for Quadrant C Data is divided into 100 sec bins |
 |
 |
| Module-wise count rates for Quadrant D Data is divided into 100 sec bins |
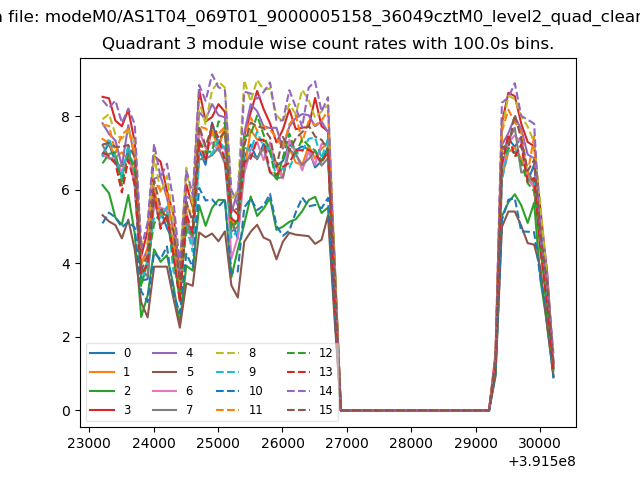 |
 |
| Parameter | Plot |
|---|---|
| CZT HV Monitor | 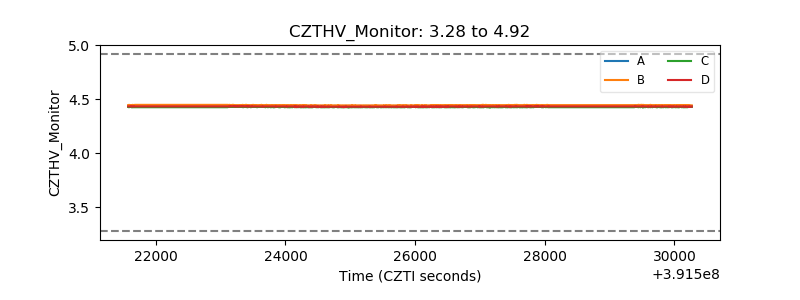 |
| D_VDD | 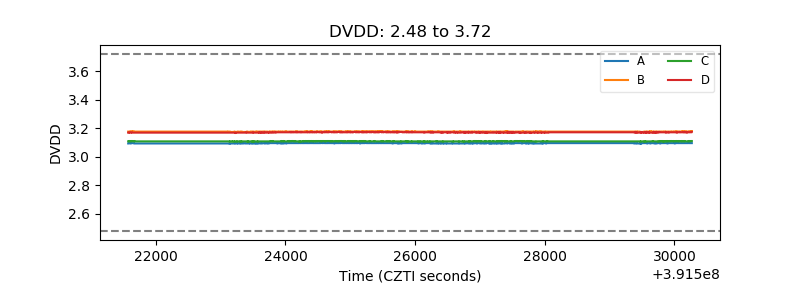 |
| Temperature 1 | 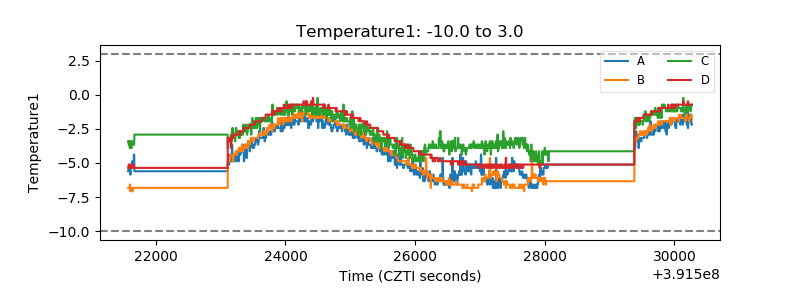 |
| Veto HV Monitor | 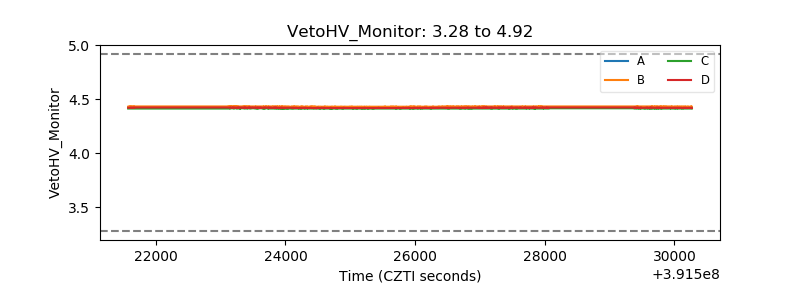 |
| Veto LLD | 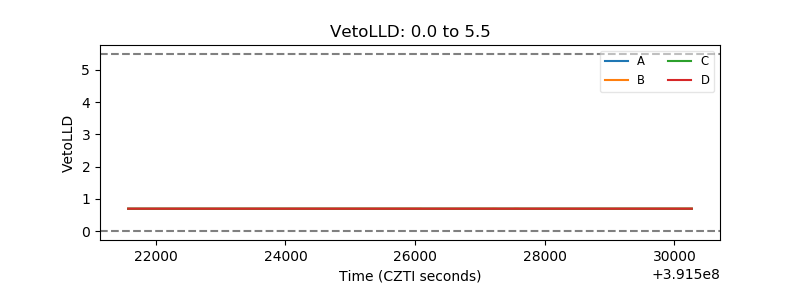 |
| Alpha Counter | 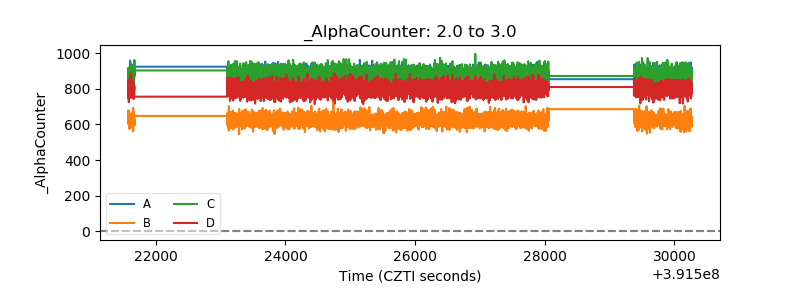 |
| _CPM_Rate | 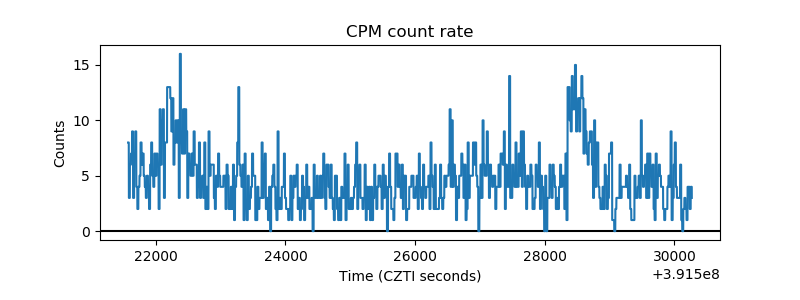 |
| CZT Counter | 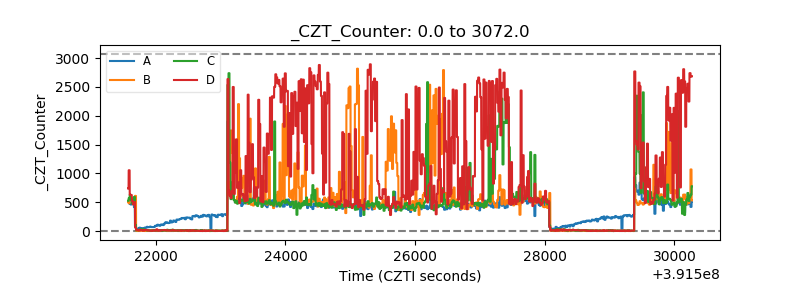 |
| +2.5 Volts monitor | 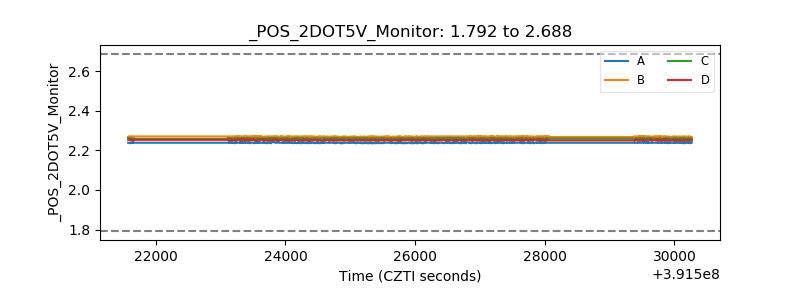 |
| +5 Volts monitor | 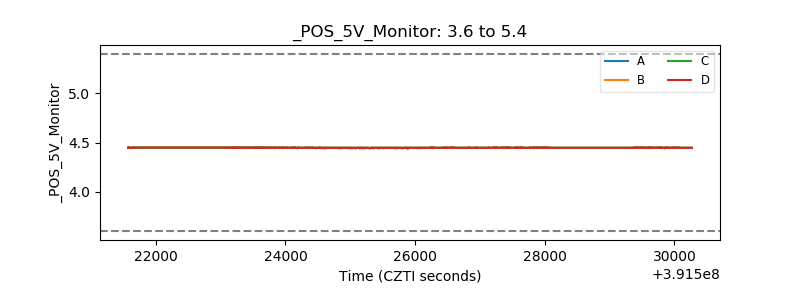 |
| _ROLL_ROT | 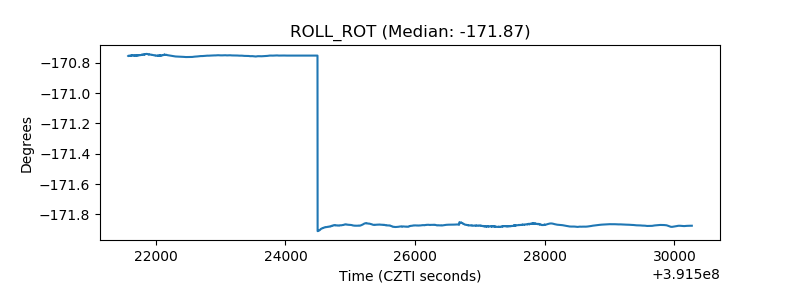 |
| _Roll_DEC | 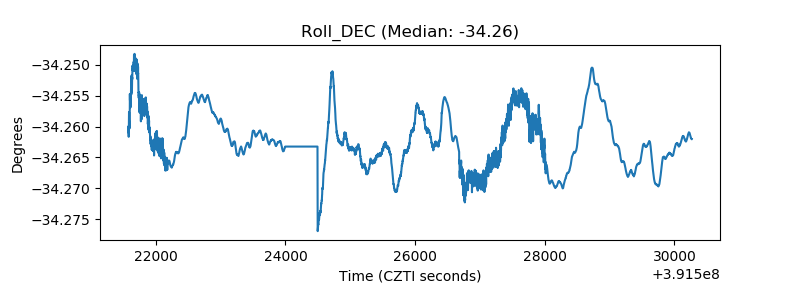 |
| _Roll_RA | 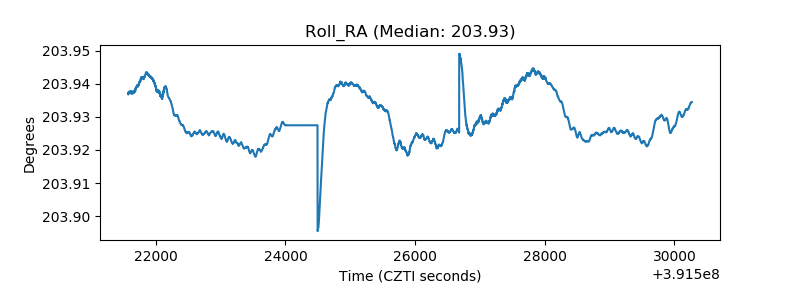 |
| Veto Counter | 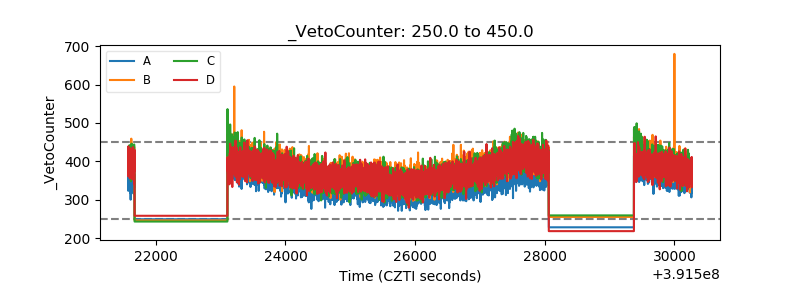 |