| Param | Original file | Final file |
|---|---|---|
| Filename | modeM0/AS1T04_069T01_9000005158_36045cztM0_level2.evt | modeM0/AS1T04_069T01_9000005158_36045cztM0_level2_quad_clean.evt |
| Size (bytes) | 420,336,000 | 52,669,440 |
| Size | 400.9 MB | 50.2 MB |
| Events in quadrant A | 2,556,318 | 319,189 |
| Events in quadrant B | 3,233,054 | 311,748 |
| Events in quadrant C | 3,035,903 | 316,280 |
| Events in quadrant D | 3,564,944 | 296,509 |
| Mode M0 | |||
|---|---|---|---|
| Quadrant | BADHDUFLAG | Total packets | Discarded packets |
| A | 0 | 10392 | 3 |
| B | 0 | 12661 | 2 |
| C | 0 | 11836 | 2 |
| D | 0 | 13791 | 2 |
| Mode M9 | |||
|---|---|---|---|
| Quadrant | BADHDUFLAG | Total packets | Discarded packets |
| A | 0 | 40 | 0 |
| B | 0 | 40 | 0 |
| C | 0 | 40 | 0 |
| D | 0 | 41 | 0 |
| Mode SS | |||
|---|---|---|---|
| Quadrant | BADHDUFLAG | Total packets | Discarded packets |
| A | 0 | 102 | 0 |
| B | 0 | 102 | 0 |
| C | 0 | 102 | 0 |
| D | 0 | 102 | 0 |
| Quadrant | Total seconds | Saturated seconds | Saturation percentage |
|---|---|---|---|
| A | 4998 | 7 | 0.140056% |
| B | 4998 | 185 | 3.701481% |
| C | 4998 | 140 | 2.801120% |
| D | 4998 | 173 | 3.461385% |
Noise dominated data is calculated using 1-second bins in cleaned event files. If a bin has >2000 counts, and if more than 50% of those come from <1% of pixels, then it is considered to be noise-dominated and hence unusable.
| Quadrant | # 1 sec bins | Bins with >0 counts | Bins with >2000 counts | High rate bins dominated by noise | Noise dominated (total time) | Noise dominated (detector-on time) | Marked lightcurve |
|---|---|---|---|---|---|---|---|
| A | 7121 | 4999 | 0 | 0 | 0.00% | 0.00% | 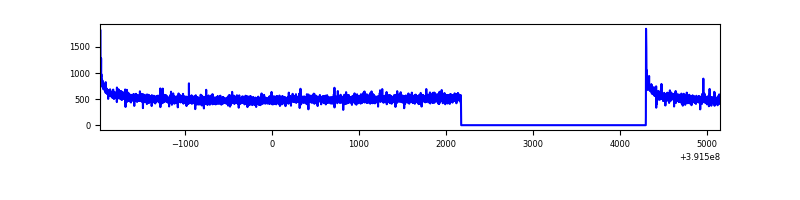 |
| B | 7121 | 4999 | 124 | 124 | 1.74% | 2.48% | 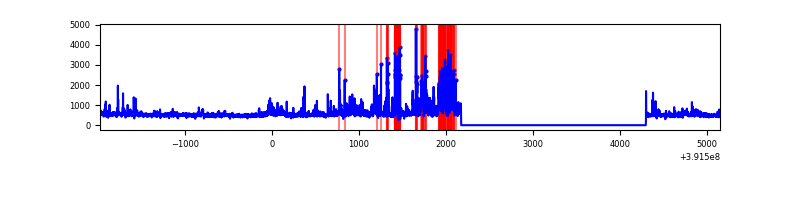 |
| C | 7121 | 4999 | 105 | 105 | 1.47% | 2.10% | 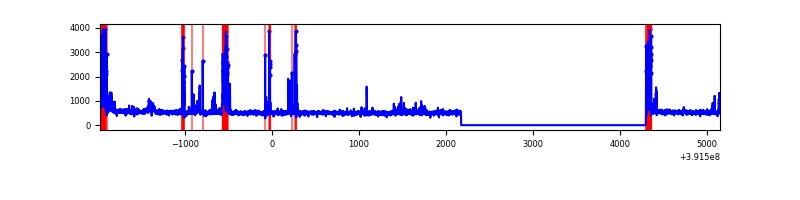 |
| D | 7121 | 4999 | 146 | 146 | 2.05% | 2.92% | 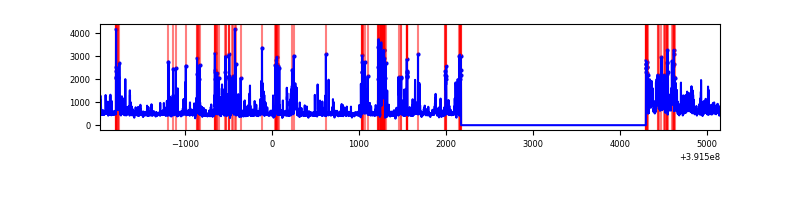 |
Top three noisy pixels from each quadrant. If the there are fewer than three noisy pixels in the level2.evt file, extra rows are filled as -1
| Pixel properties | Quadrant properties | ||||||
|---|---|---|---|---|---|---|---|
| Quadrant | DetID | PixID | Counts | Sigma | Mean | Median | Sigma |
| A | 10 | 83 | 165567 | 1347.14 | 613 | 604 | 122.5 |
| A | 13 | 6 | 11764 | 91.14 | 613 | 604 | 122.5 |
| A | 13 | 254 | 8213 | 62.14 | 613 | 604 | 122.5 |
| B | 5 | 255 | 364339 | 3156.59 | 602 | 588 | 115.2 |
| B | 5 | 236 | 217036 | 1878.31 | 602 | 588 | 115.2 |
| B | 0 | 190 | 73909 | 636.27 | 602 | 588 | 115.2 |
| C | 9 | 187 | 291598 | 2131.89 | 592 | 597 | 136.5 |
| C | 15 | 214 | 210499 | 1537.75 | 592 | 597 | 136.5 |
| C | 0 | 10 | 193572 | 1413.75 | 592 | 597 | 136.5 |
| D | 12 | 6 | 472339 | 3284.79 | 590 | 575 | 143.6 |
| D | 12 | 235 | 256976 | 1785.26 | 590 | 575 | 143.6 |
| D | 13 | 249 | 196920 | 1367.11 | 590 | 575 | 143.6 |
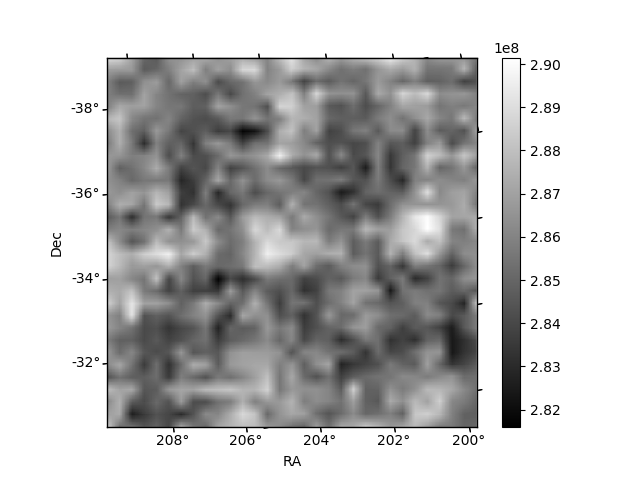
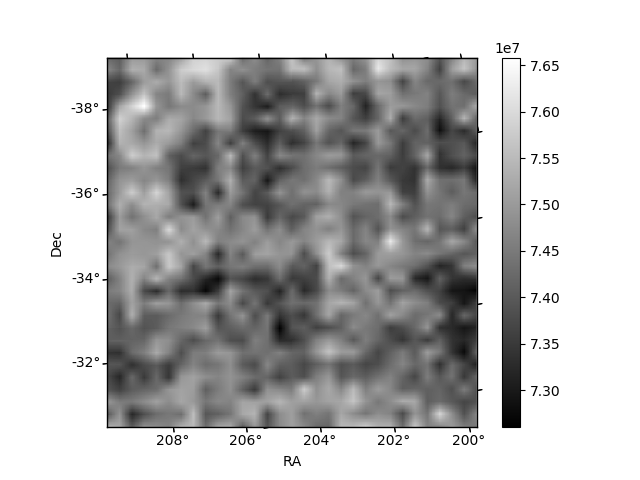
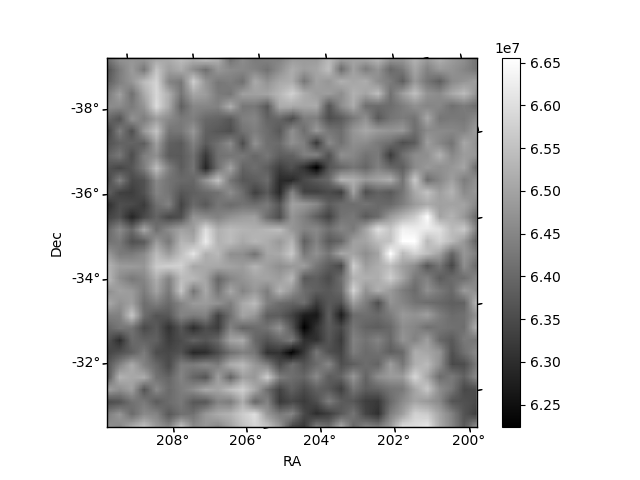
Histogram calculated using DETX and DETY for each event in the final _common_clean file
| Quadrant A | 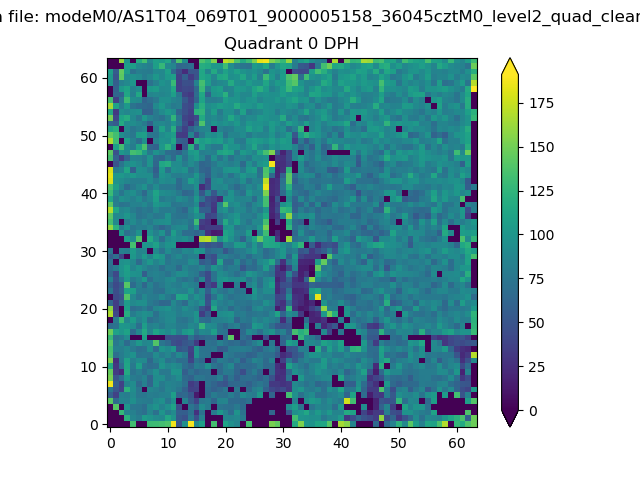 |
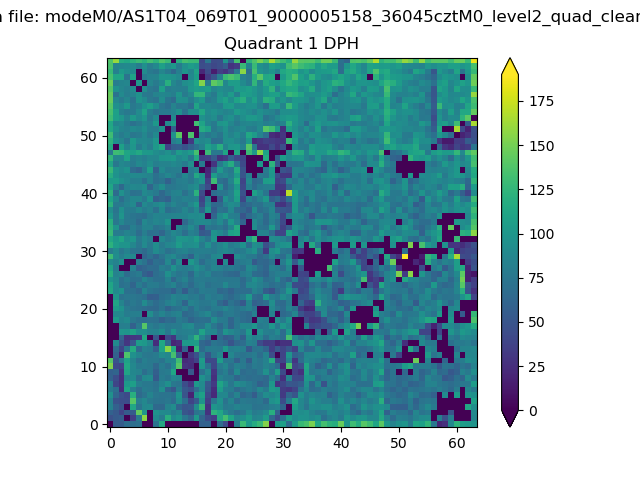 |
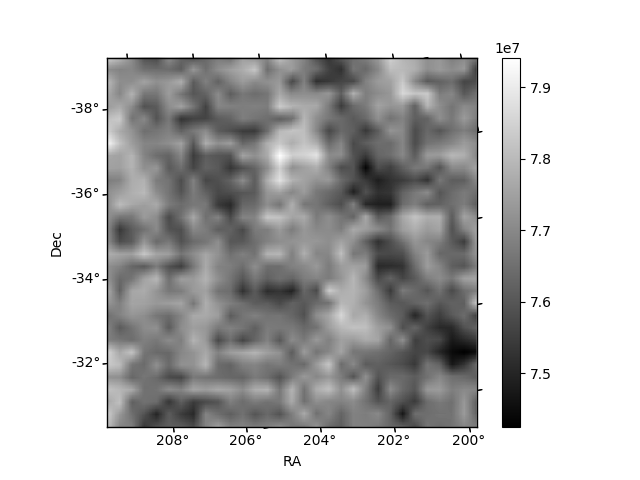
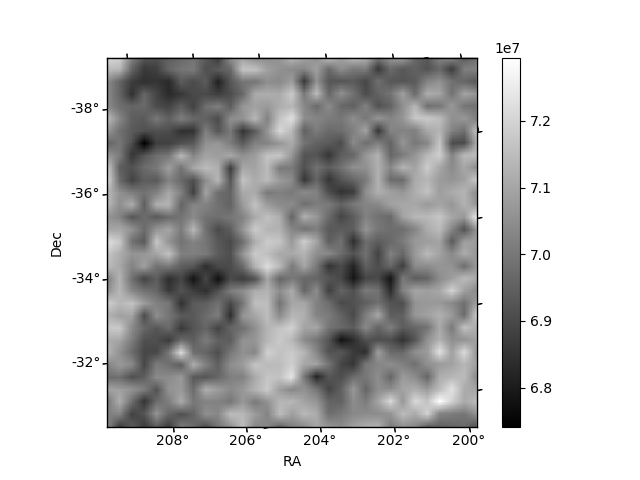
Quadrant B |
|---|---|---|---|
| Quadrant D | 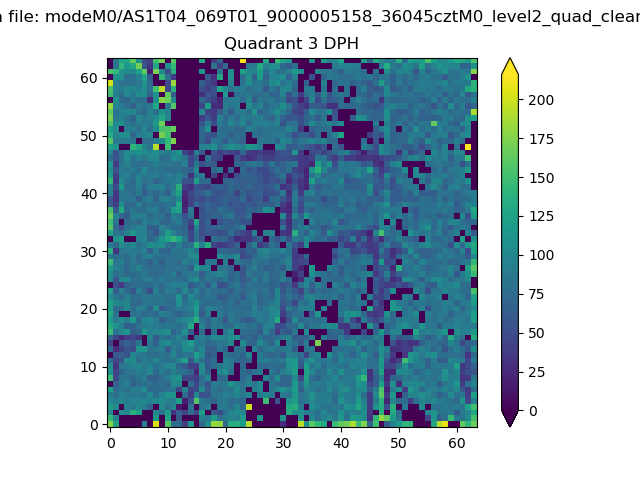 |
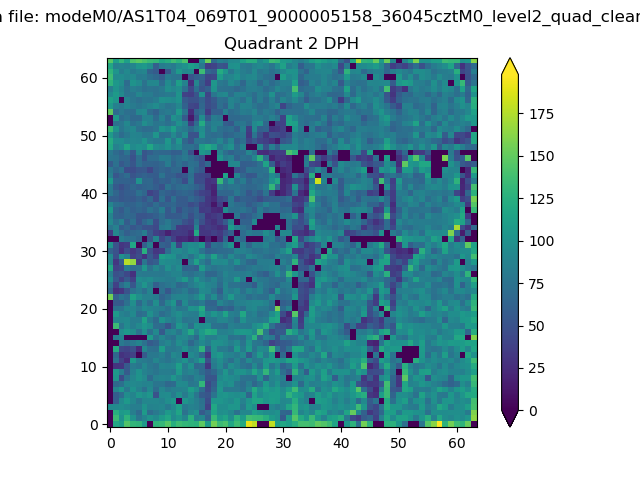 |
Quadrant C |
| Plot type | Count rate plots | Images |
|---|---|---|
| Comparison with Poisson distribution Blue bars denote a histogram of data divided into 1 sec bins. Red curve is a Poisson curve with rate = median count rate of data. |
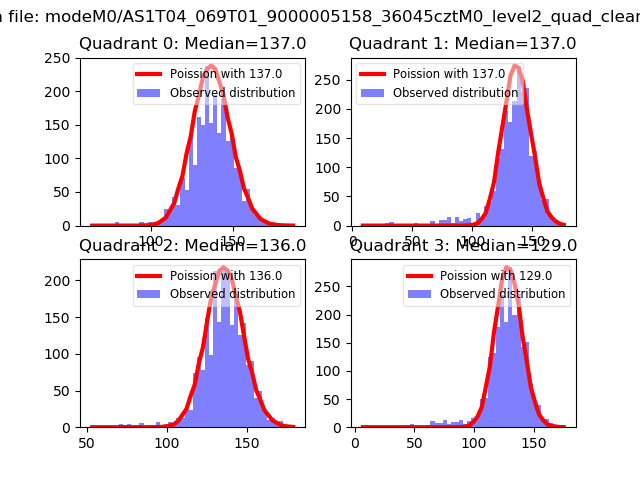 |
 |
| Quadrant-wise count rates Data is divided into 100 sec bins |
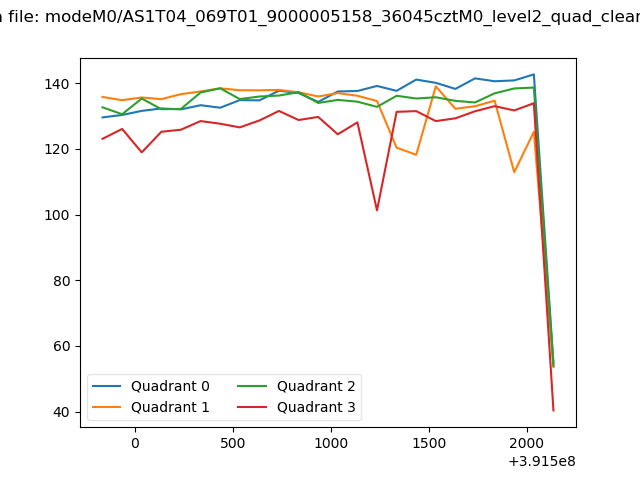 |
|
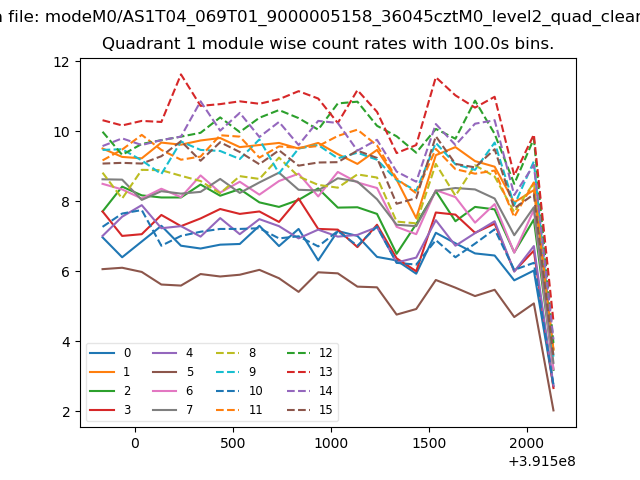
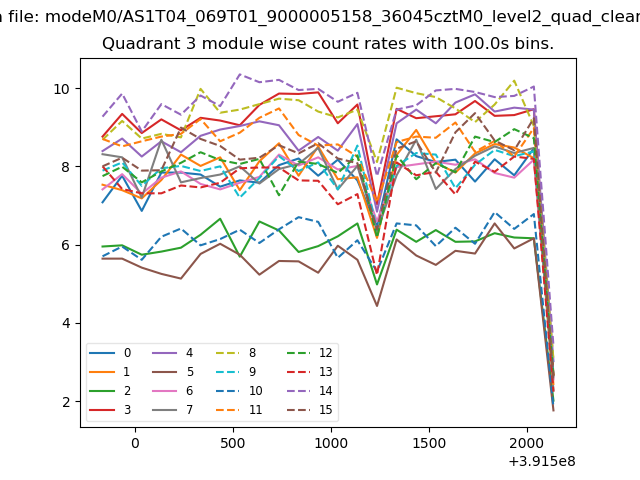
| Module-wise count rates for Quadrant A Data is divided into 100 sec bins |
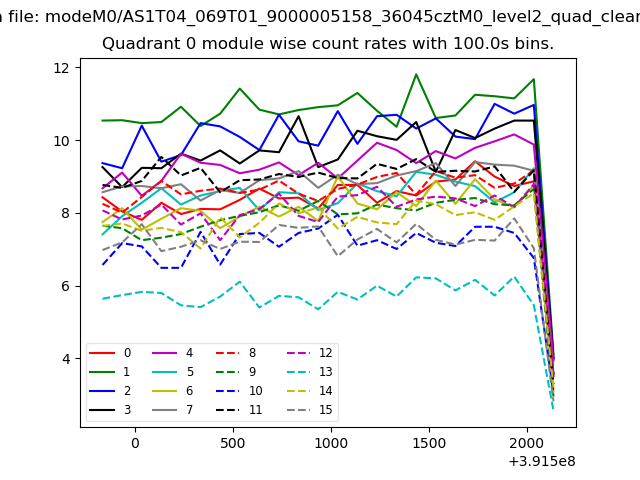 |
 |
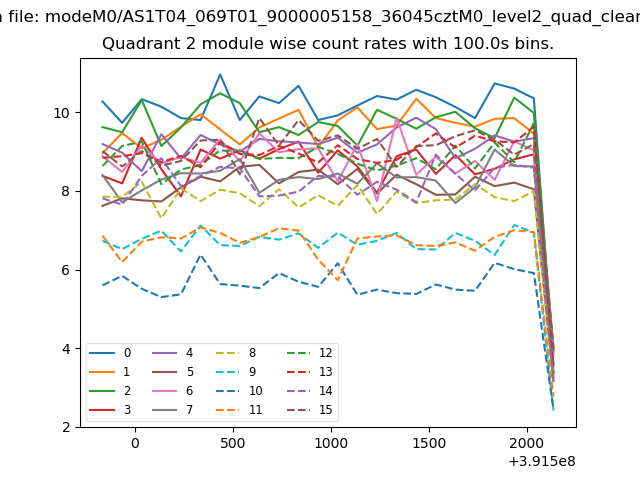
| Module-wise count rates for Quadrant B Data is divided into 100 sec bins |
 |
 |
| Module-wise count rates for Quadrant C Data is divided into 100 sec bins |
 |
 |
| Module-wise count rates for Quadrant D Data is divided into 100 sec bins |
 |
 |
| Parameter | Plot |
|---|---|
| CZT HV Monitor | 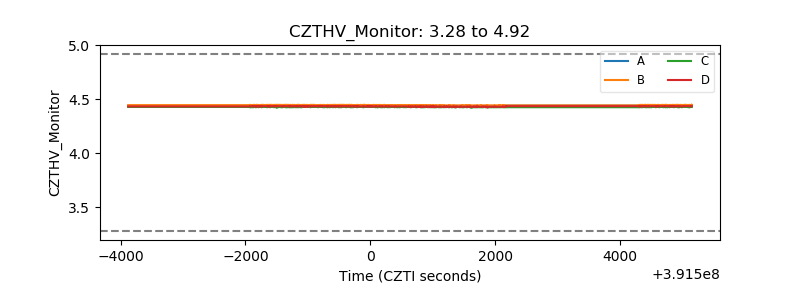 |
| D_VDD | 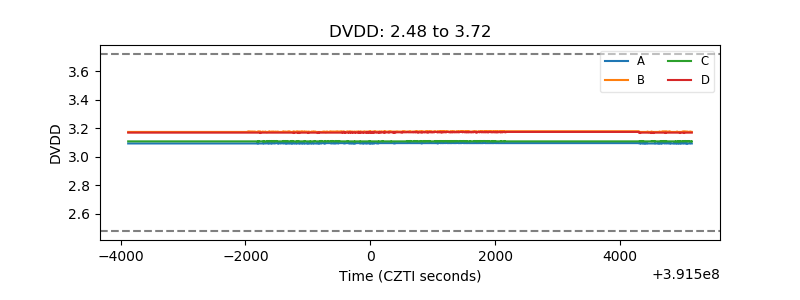 |
| Temperature 1 | 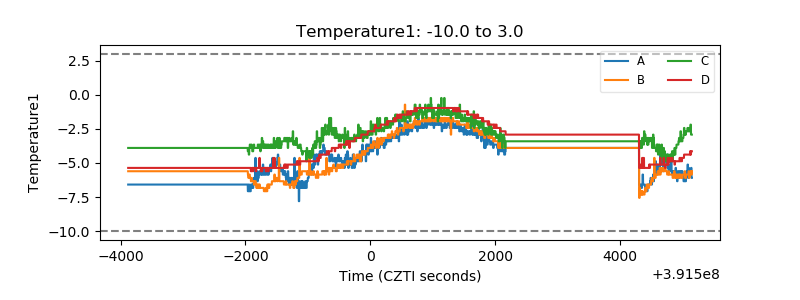 |
| Veto HV Monitor | 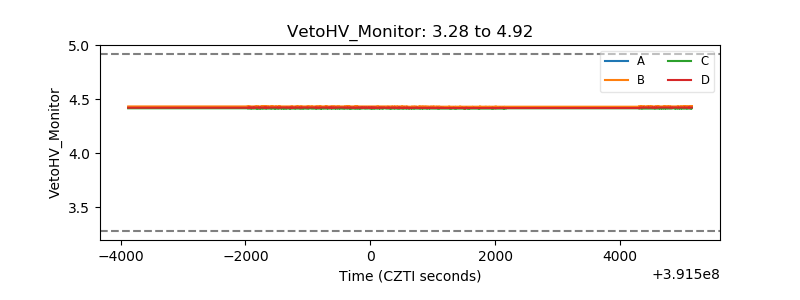 |
| Veto LLD | 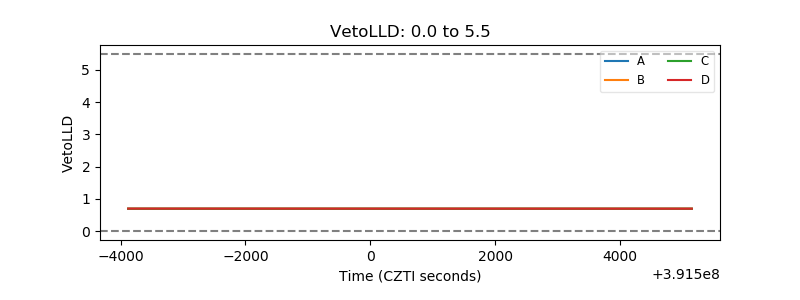 |
| Alpha Counter | 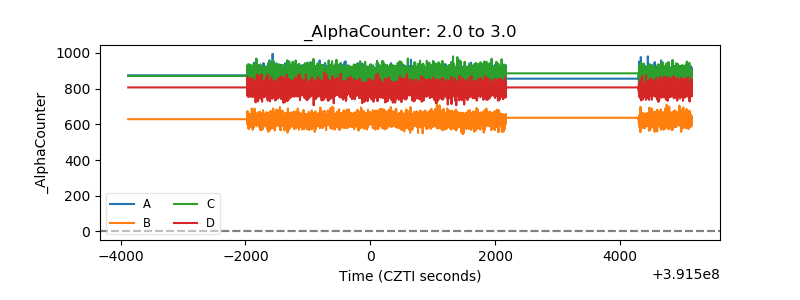 |
| _CPM_Rate | 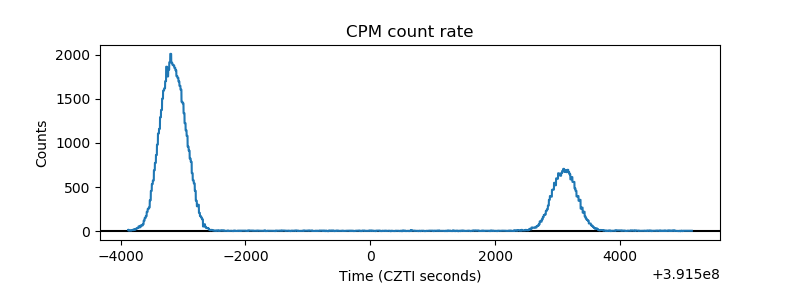 |
| CZT Counter | 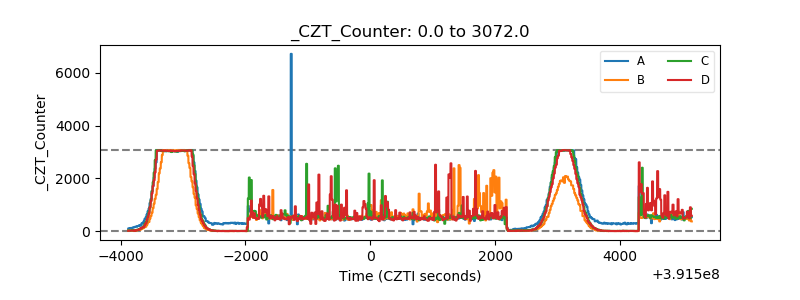 |
| +2.5 Volts monitor | 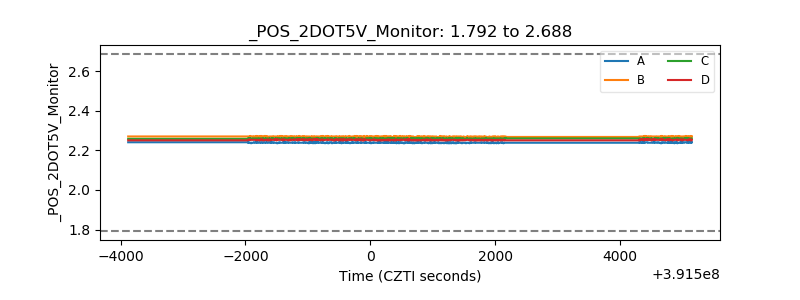 |
| +5 Volts monitor | 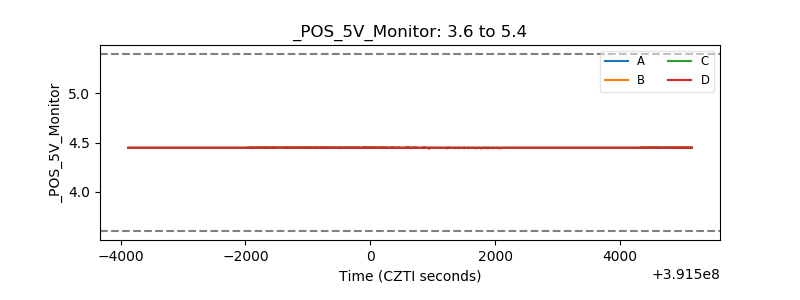 |
| _ROLL_ROT | 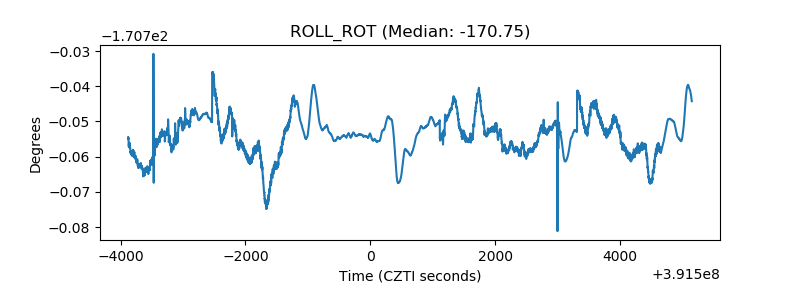 |
| _Roll_DEC | 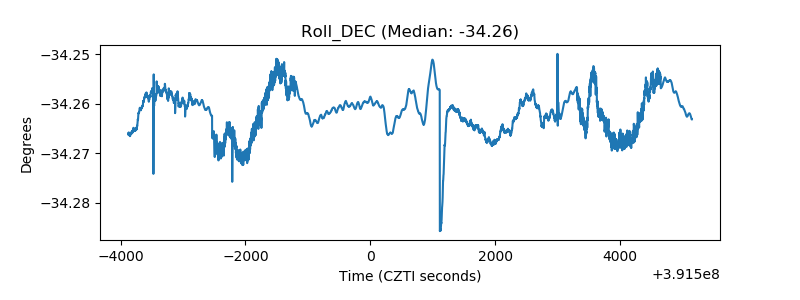 |
| _Roll_RA | 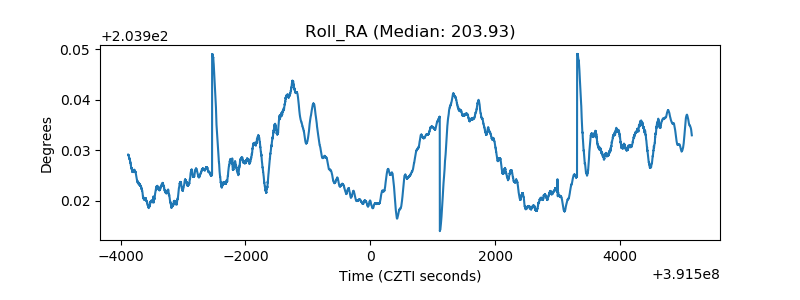 |
| Veto Counter | 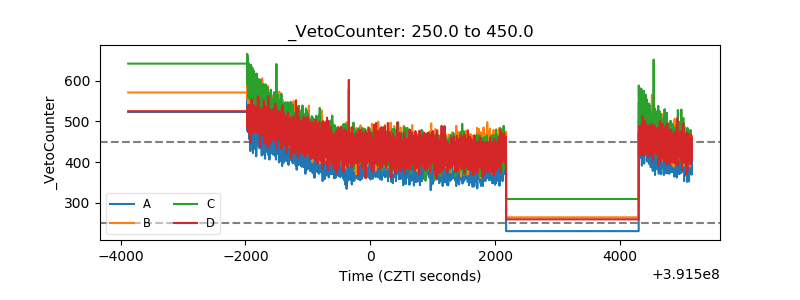 |