| Param | Original file | Final file |
|---|---|---|
| Filename | modeM0/AS1T04_069T01_9000005158_36041cztM0_level2.evt | modeM0/AS1T04_069T01_9000005158_36041cztM0_level2_quad_clean.evt |
| Size (bytes) | 478,048,320 | 65,603,520 |
| Size | 455.9 MB | 62.6 MB |
| Events in quadrant A | 2,611,596 | 424,316 |
| Events in quadrant B | 3,514,162 | 422,318 |
| Events in quadrant C | 4,697,173 | 370,891 |
| Events in quadrant D | 3,288,277 | 390,723 |
| Mode M0 | |||
|---|---|---|---|
| Quadrant | BADHDUFLAG | Total packets | Discarded packets |
| A | 0 | 11206 | 3 |
| B | 0 | 13940 | 2 |
| C | 0 | 17357 | 2 |
| D | 0 | 13537 | 2 |
| Mode M9 | |||
|---|---|---|---|
| Quadrant | BADHDUFLAG | Total packets | Discarded packets |
| A | 0 | 27 | 0 |
| B | 0 | 27 | 0 |
| C | 0 | 27 | 0 |
| D | 0 | 28 | 0 |
| Mode SS | |||
|---|---|---|---|
| Quadrant | BADHDUFLAG | Total packets | Discarded packets |
| A | 0 | 112 | 0 |
| B | 0 | 112 | 0 |
| C | 0 | 112 | 0 |
| D | 0 | 112 | 0 |
| Quadrant | Total seconds | Saturated seconds | Saturation percentage |
|---|---|---|---|
| A | 5389 | 9 | 0.167007% |
| B | 5389 | 203 | 3.766933% |
| C | 5389 | 689 | 12.785303% |
| D | 5389 | 213 | 3.952496% |
Noise dominated data is calculated using 1-second bins in cleaned event files. If a bin has >2000 counts, and if more than 50% of those come from <1% of pixels, then it is considered to be noise-dominated and hence unusable.
| Quadrant | # 1 sec bins | Bins with >0 counts | Bins with >2000 counts | High rate bins dominated by noise | Noise dominated (total time) | Noise dominated (detector-on time) | Marked lightcurve |
|---|---|---|---|---|---|---|---|
| A | 7182 | 5390 | 0 | 0 | 0.00% | 0.00% |  |
| B | 7182 | 5390 | 138 | 138 | 1.92% | 2.56% | 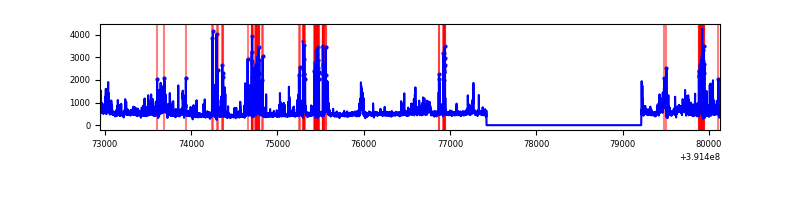 |
| C | 7182 | 5389 | 573 | 573 | 7.98% | 10.63% |  |
| D | 7182 | 5390 | 168 | 168 | 2.34% | 3.12% | 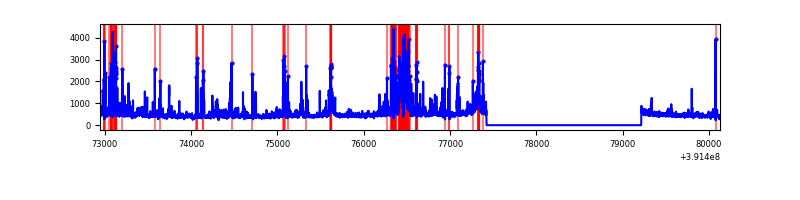 |
Top three noisy pixels from each quadrant. If the there are fewer than three noisy pixels in the level2.evt file, extra rows are filled as -1
| Pixel properties | Quadrant properties | ||||||
|---|---|---|---|---|---|---|---|
| Quadrant | DetID | PixID | Counts | Sigma | Mean | Median | Sigma |
| A | 10 | 83 | 167371 | 1306.35 | 623 | 610 | 127.7 |
| A | 0 | 31 | 24730 | 188.95 | 623 | 610 | 127.7 |
| A | 13 | 6 | 8151 | 59.07 | 623 | 610 | 127.7 |
| B | 5 | 236 | 737251 | 6227.01 | 613 | 598 | 118.3 |
| B | 0 | 213 | 143776 | 1210.3 | 613 | 598 | 118.3 |
| B | 0 | 190 | 131943 | 1110.27 | 613 | 598 | 118.3 |
| C | 9 | 187 | 1975701 | 14801.32 | 570 | 573 | 133.4 |
| C | 0 | 10 | 234538 | 1753.3 | 570 | 573 | 133.4 |
| C | 15 | 214 | 212399 | 1587.39 | 570 | 573 | 133.4 |
| D | 2 | 250 | 512378 | 3545.27 | 590 | 573 | 144.4 |
| D | 10 | 118 | 95842 | 659.93 | 590 | 573 | 144.4 |
| D | 12 | 235 | 82913 | 570.37 | 590 | 573 | 144.4 |
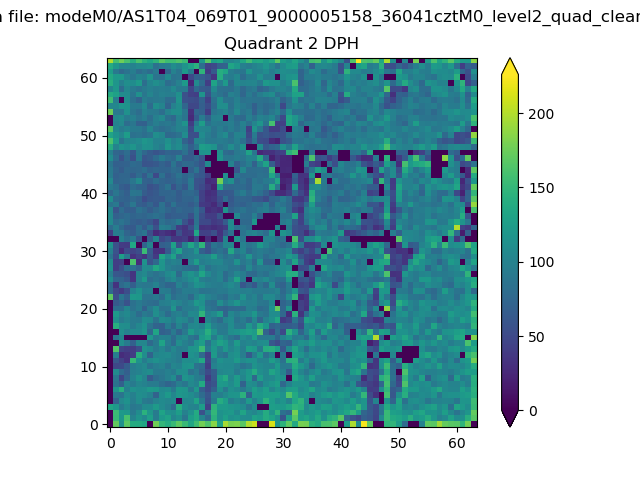
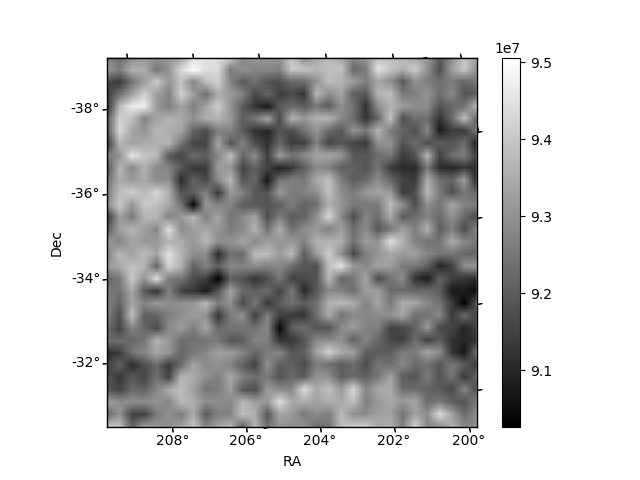
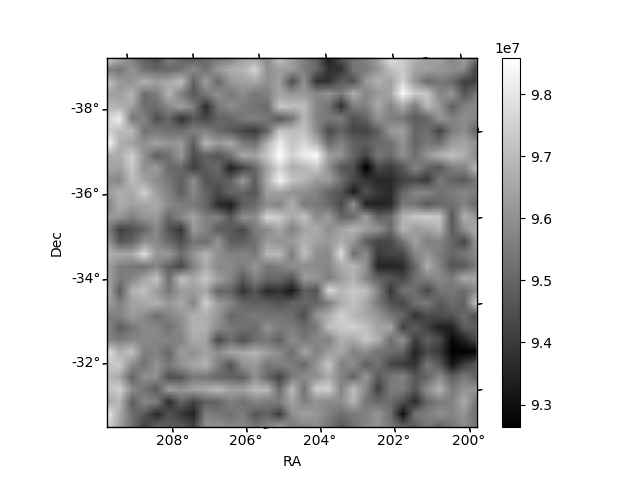
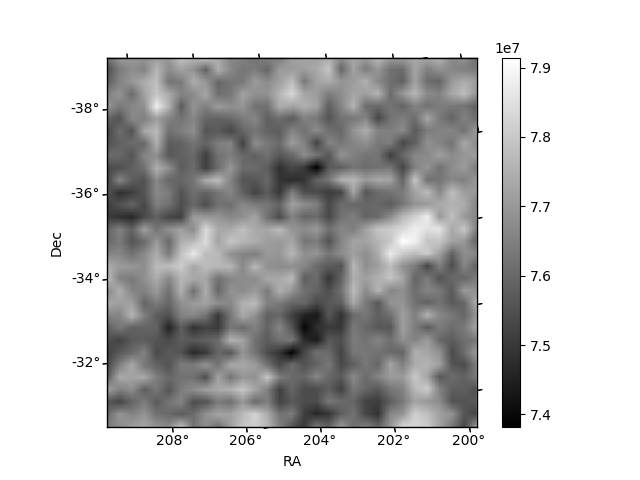
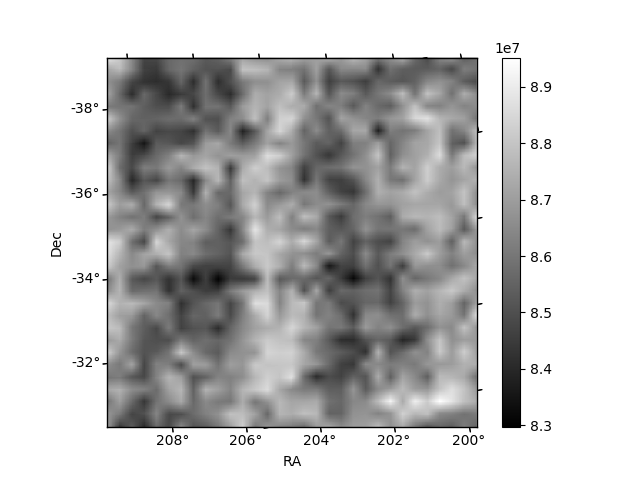
Histogram calculated using DETX and DETY for each event in the final _common_clean file
| Quadrant A | 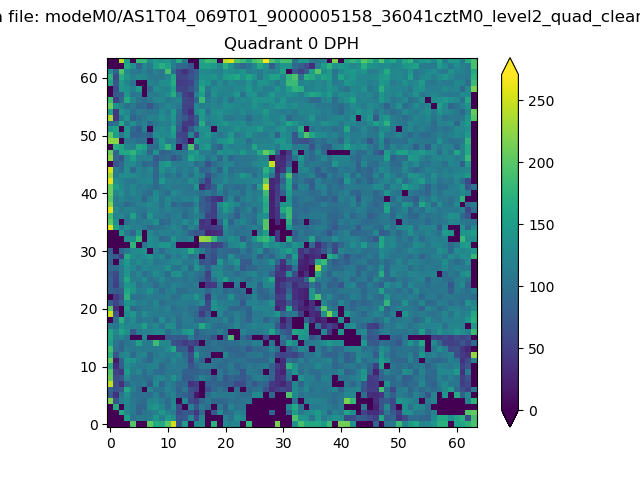 |
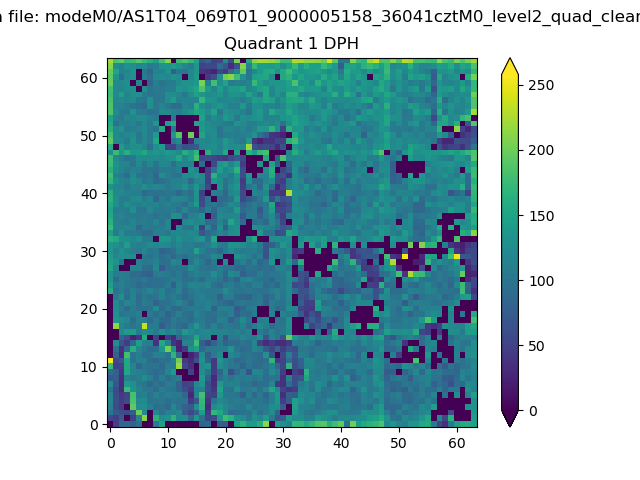 |
Quadrant B |
|---|---|---|---|
| Quadrant D | 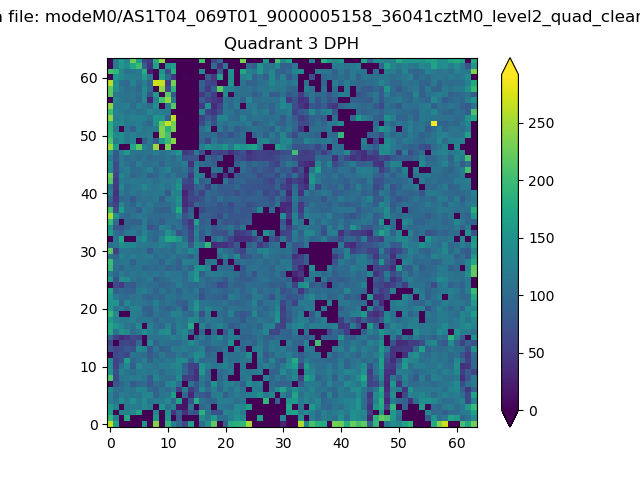 |
 |
Quadrant C |
| Plot type | Count rate plots | Images |
|---|---|---|
| Comparison with Poisson distribution Blue bars denote a histogram of data divided into 1 sec bins. Red curve is a Poisson curve with rate = median count rate of data. |
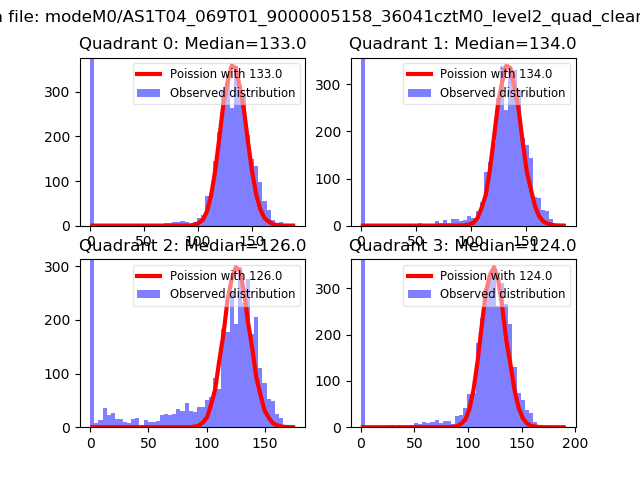 |
 |
| Quadrant-wise count rates Data is divided into 100 sec bins |
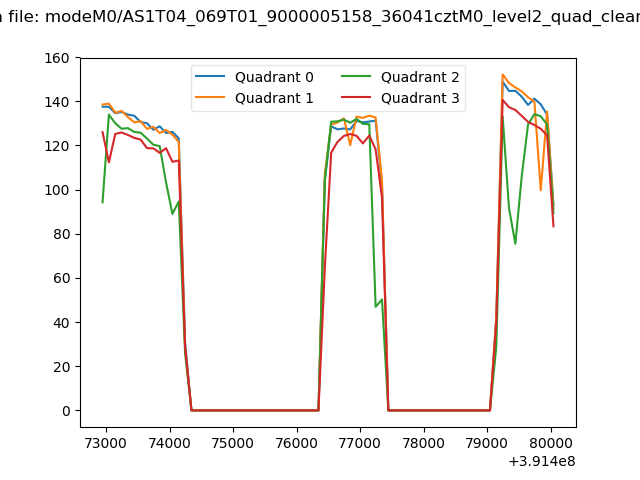 |
|
| Module-wise count rates for Quadrant A Data is divided into 100 sec bins |
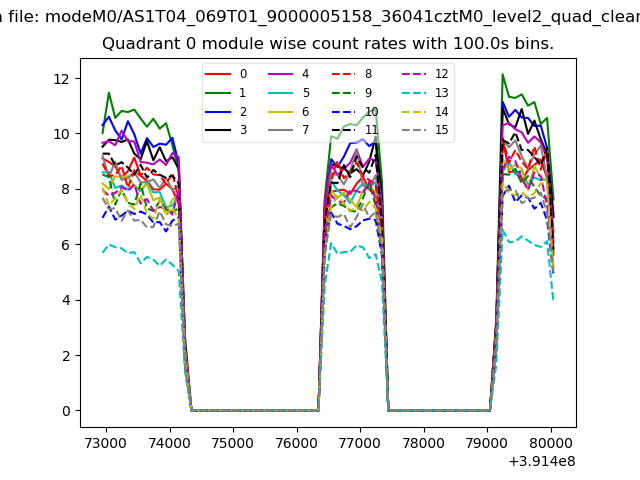 |
 |
| Module-wise count rates for Quadrant B Data is divided into 100 sec bins |
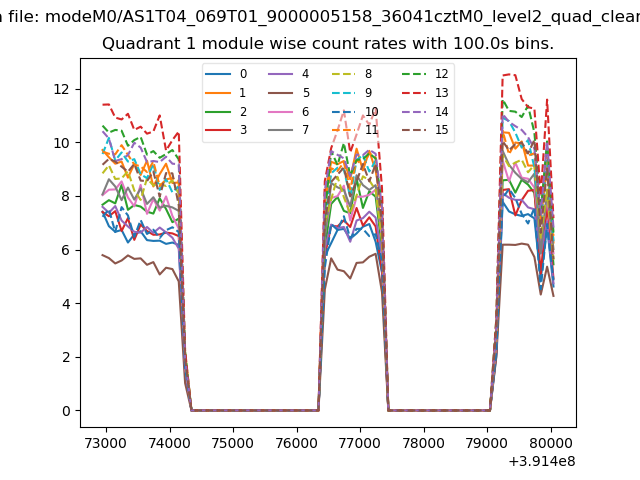 |
 |
| Module-wise count rates for Quadrant C Data is divided into 100 sec bins |
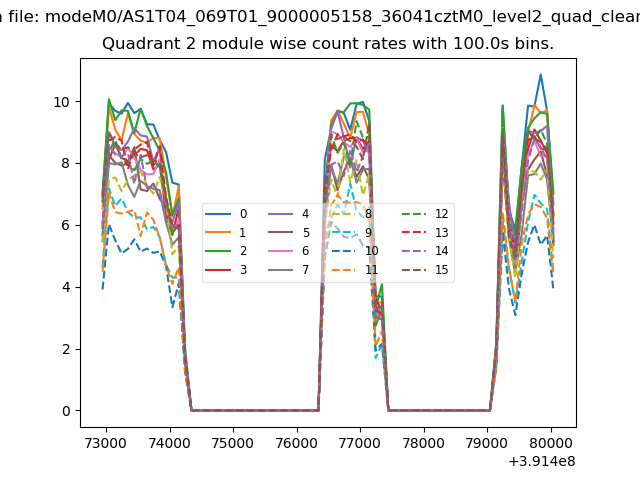 |
 |
| Module-wise count rates for Quadrant D Data is divided into 100 sec bins |
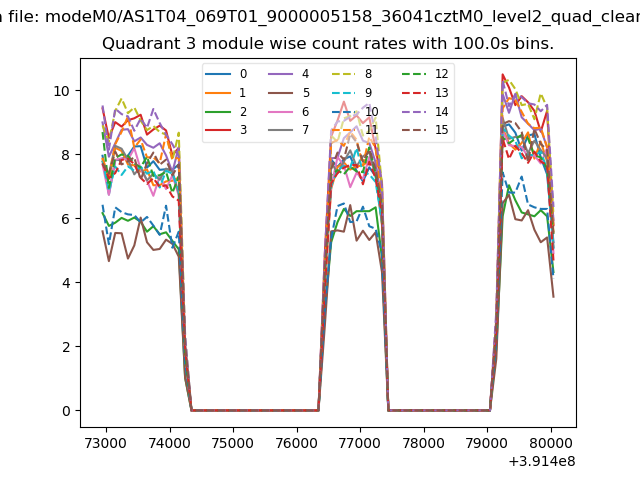 |
 |
| Parameter | Plot |
|---|---|
| CZT HV Monitor | 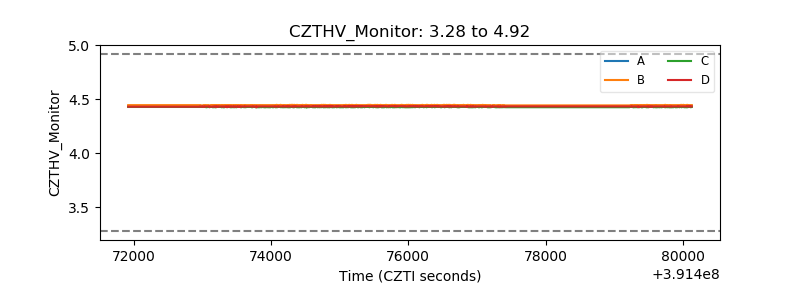 |
| D_VDD | 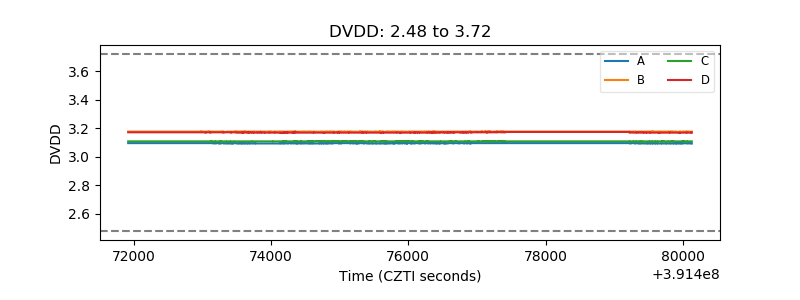 |
| Temperature 1 | 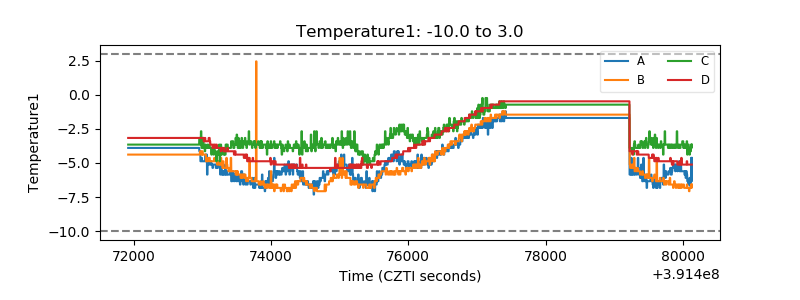 |
| Veto HV Monitor | 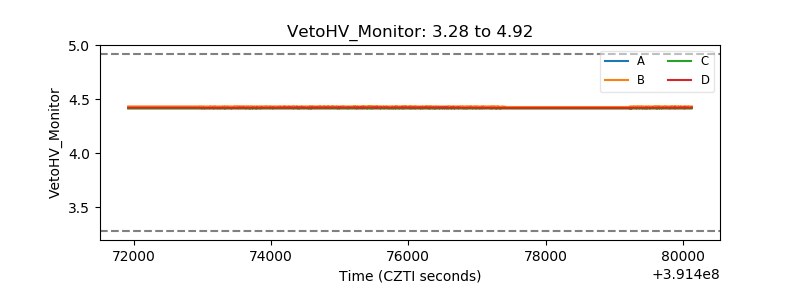 |
| Veto LLD | 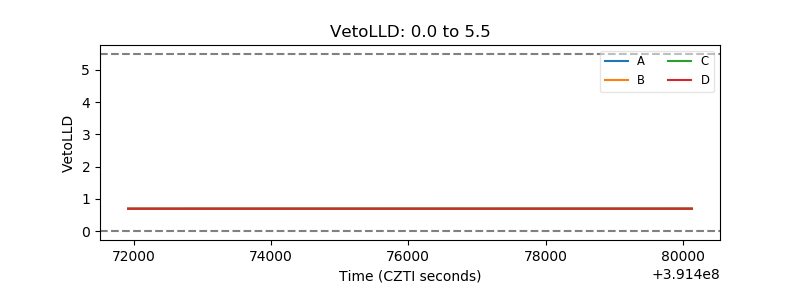 |
| Alpha Counter | 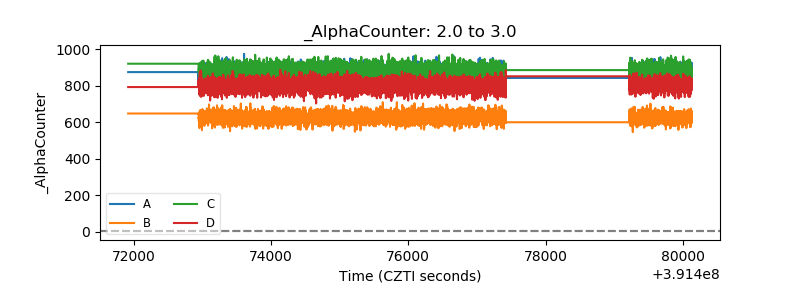 |
| _CPM_Rate | 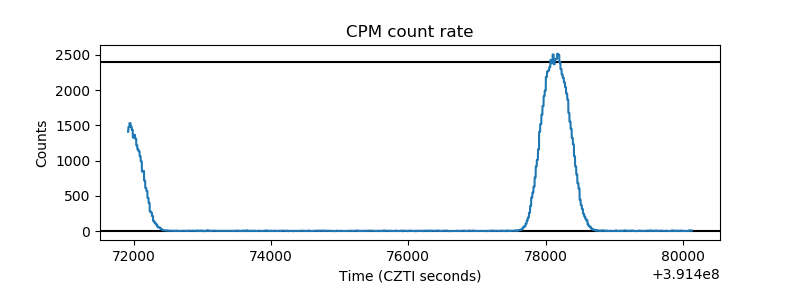 |
| CZT Counter | 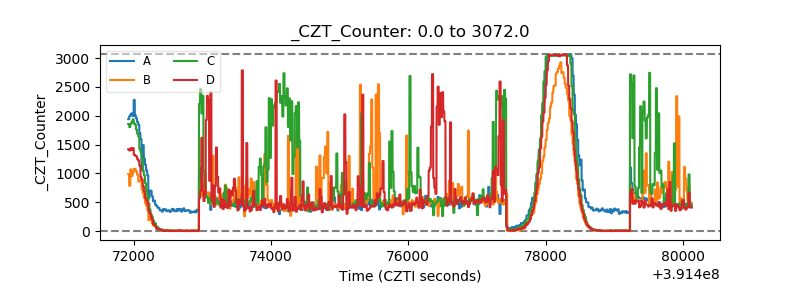 |
| +2.5 Volts monitor | 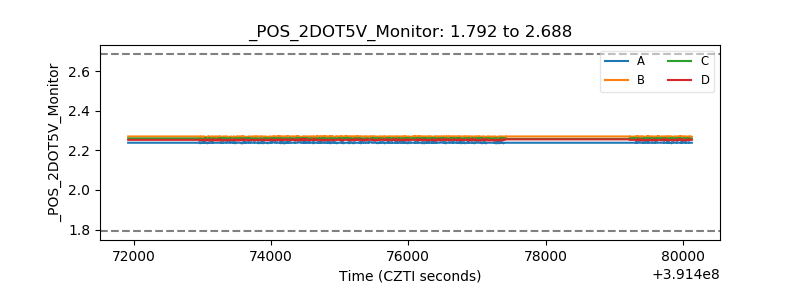 |
| +5 Volts monitor | 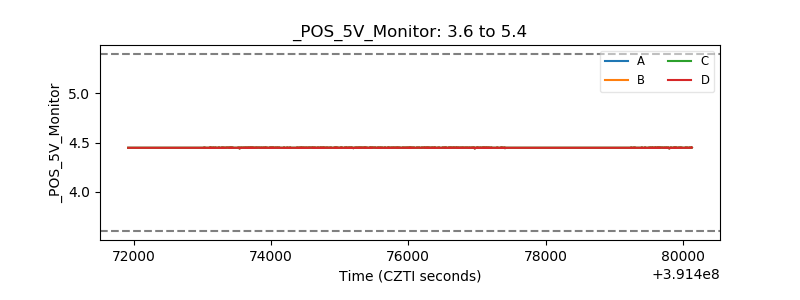 |
| _ROLL_ROT | 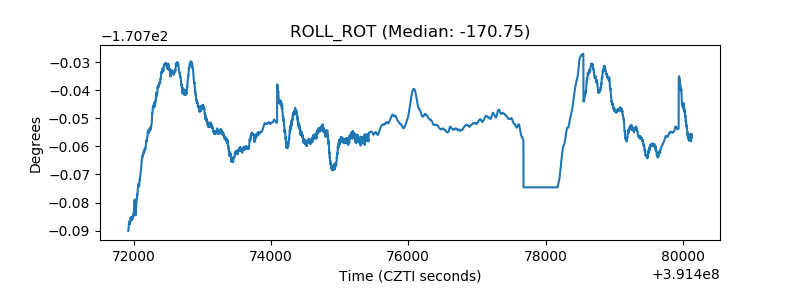 |
| _Roll_DEC | 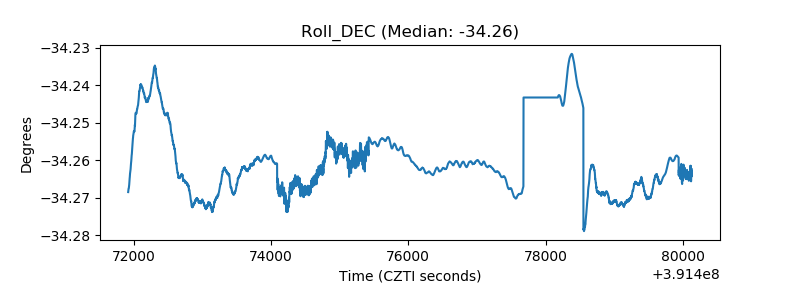 |
| _Roll_RA | 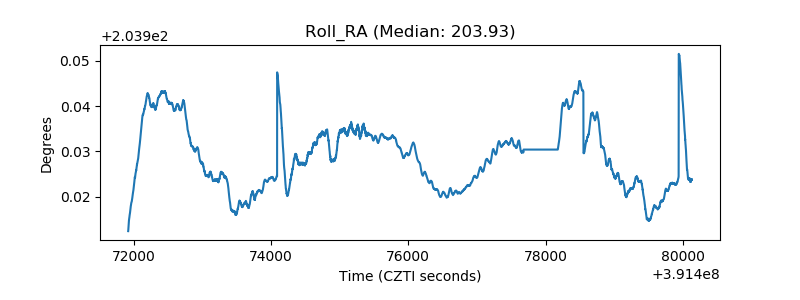 |
| Veto Counter | 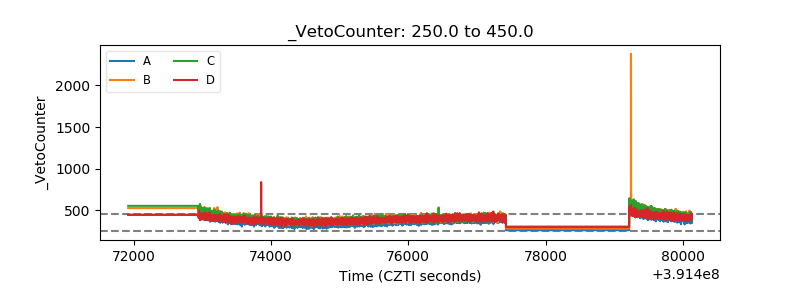 |