| Param | Original file | Final file |
|---|---|---|
| Filename | modeM0/AS1T04_069T01_9000005158_36039cztM0_level2.evt | modeM0/AS1T04_069T01_9000005158_36039cztM0_level2_quad_clean.evt |
| Size (bytes) | 456,880,320 | 66,303,360 |
| Size | 435.7 MB | 63.2 MB |
| Events in quadrant A | 2,607,084 | 422,030 |
| Events in quadrant B | 3,786,419 | 411,199 |
| Events in quadrant C | 3,352,768 | 403,745 |
| Events in quadrant D | 3,716,996 | 385,695 |
| Mode M0 | |||
|---|---|---|---|
| Quadrant | BADHDUFLAG | Total packets | Discarded packets |
| A | 0 | 11369 | 3 |
| B | 0 | 14984 | 2 |
| C | 0 | 13497 | 2 |
| D | 0 | 14901 | 2 |
| Mode M9 | |||
|---|---|---|---|
| Quadrant | BADHDUFLAG | Total packets | Discarded packets |
| A | 0 | 29 | 0 |
| B | 0 | 29 | 0 |
| C | 0 | 29 | 0 |
| D | 0 | 30 | 0 |
| Mode SS | |||
|---|---|---|---|
| Quadrant | BADHDUFLAG | Total packets | Discarded packets |
| A | 0 | 112 | 0 |
| B | 0 | 112 | 0 |
| C | 0 | 112 | 0 |
| D | 0 | 112 | 0 |
| Quadrant | Total seconds | Saturated seconds | Saturation percentage |
|---|---|---|---|
| A | 5497 | 8 | 0.145534% |
| B | 5497 | 243 | 4.420593% |
| C | 5497 | 239 | 4.347826% |
| D | 5497 | 241 | 4.384210% |
Noise dominated data is calculated using 1-second bins in cleaned event files. If a bin has >2000 counts, and if more than 50% of those come from <1% of pixels, then it is considered to be noise-dominated and hence unusable.
| Quadrant | # 1 sec bins | Bins with >0 counts | Bins with >2000 counts | High rate bins dominated by noise | Noise dominated (total time) | Noise dominated (detector-on time) | Marked lightcurve |
|---|---|---|---|---|---|---|---|
| A | 7170 | 5498 | 0 | 0 | 0.00% | 0.00% | 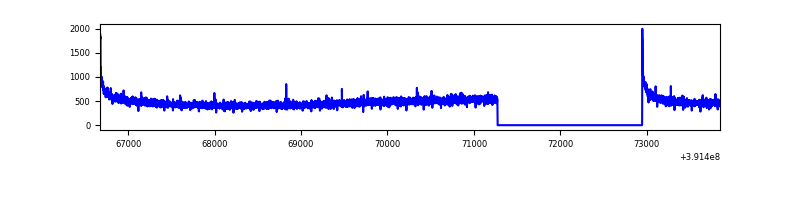 |
| B | 7170 | 5498 | 154 | 154 | 2.15% | 2.80% | 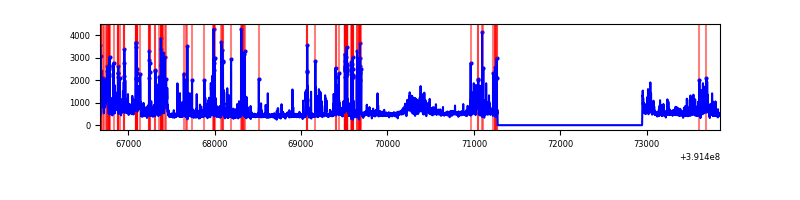 |
| C | 7170 | 5498 | 183 | 183 | 2.55% | 3.33% | 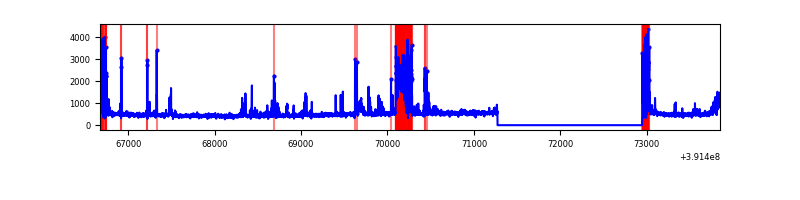 |
| D | 7170 | 5498 | 229 | 229 | 3.19% | 4.17% | 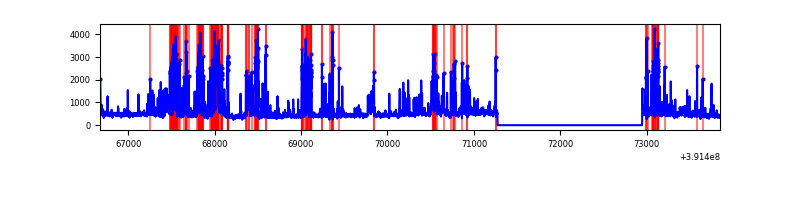 |
Top three noisy pixels from each quadrant. If the there are fewer than three noisy pixels in the level2.evt file, extra rows are filled as -1
| Pixel properties | Quadrant properties | ||||||
|---|---|---|---|---|---|---|---|
| Quadrant | DetID | PixID | Counts | Sigma | Mean | Median | Sigma |
| A | 10 | 83 | 172077 | 1354.59 | 624 | 611 | 126.6 |
| A | 13 | 6 | 13125 | 98.86 | 624 | 611 | 126.6 |
| A | 13 | 254 | 9093 | 67.01 | 624 | 611 | 126.6 |
| B | 5 | 236 | 744308 | 6221.98 | 611 | 594 | 119.5 |
| B | 0 | 190 | 411497 | 3437.65 | 611 | 594 | 119.5 |
| B | 0 | 213 | 114980 | 956.96 | 611 | 594 | 119.5 |
| C | 9 | 187 | 404797 | 2918.47 | 589 | 593 | 138.5 |
| C | 15 | 214 | 222812 | 1604.49 | 589 | 593 | 138.5 |
| C | 0 | 207 | 214694 | 1545.87 | 589 | 593 | 138.5 |
| D | 12 | 6 | 469412 | 3233.67 | 593 | 578 | 145.0 |
| D | 2 | 250 | 301589 | 2076.15 | 593 | 578 | 145.0 |
| D | 12 | 17 | 228574 | 1572.55 | 593 | 578 | 145.0 |
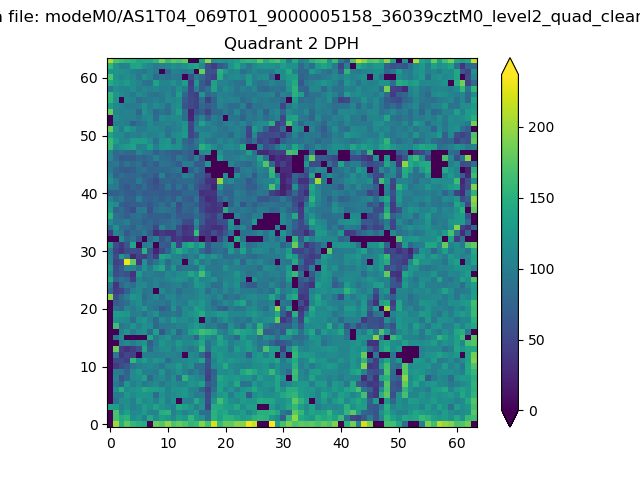
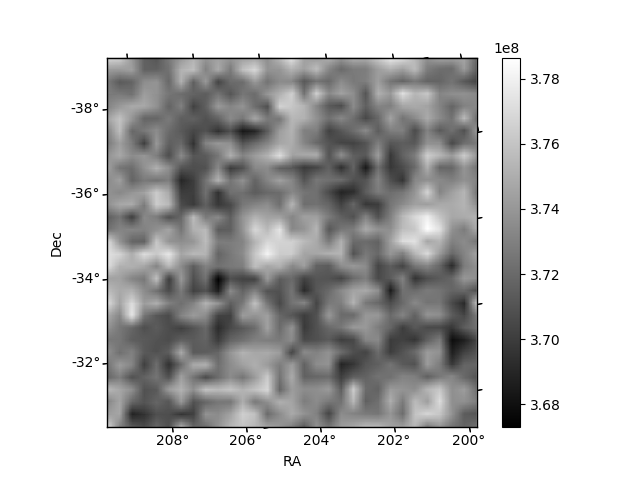
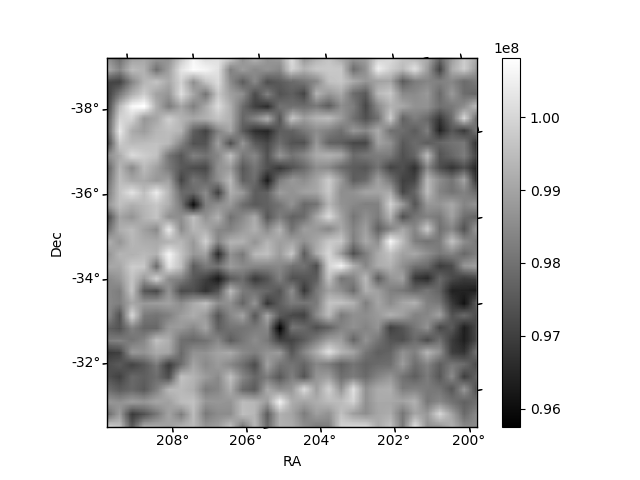
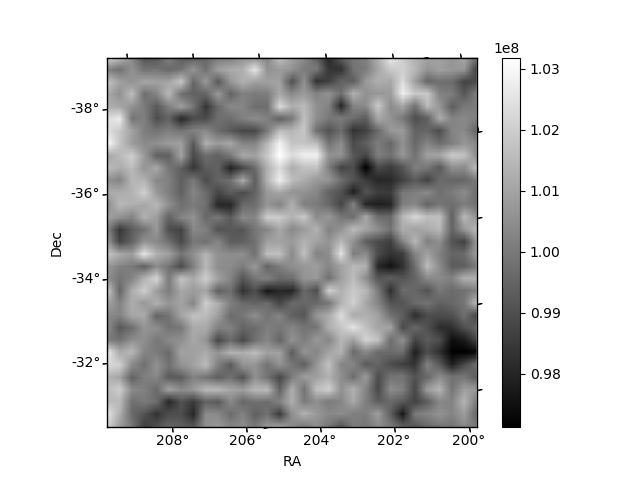
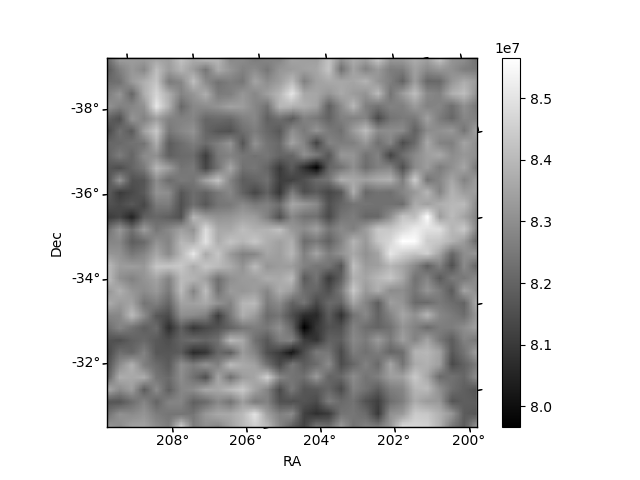
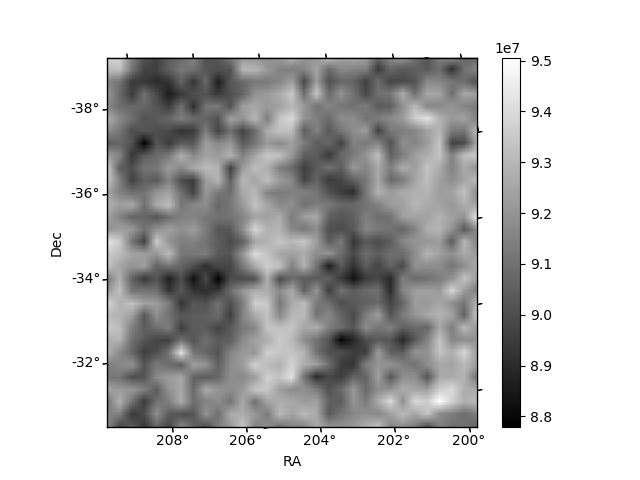
Histogram calculated using DETX and DETY for each event in the final _common_clean file
| Quadrant A | 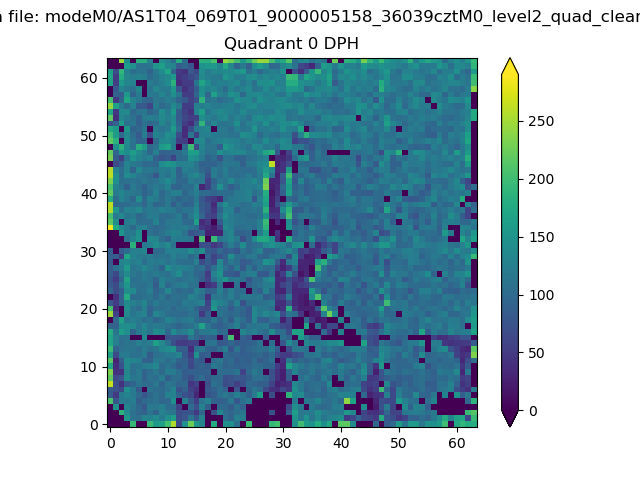 |
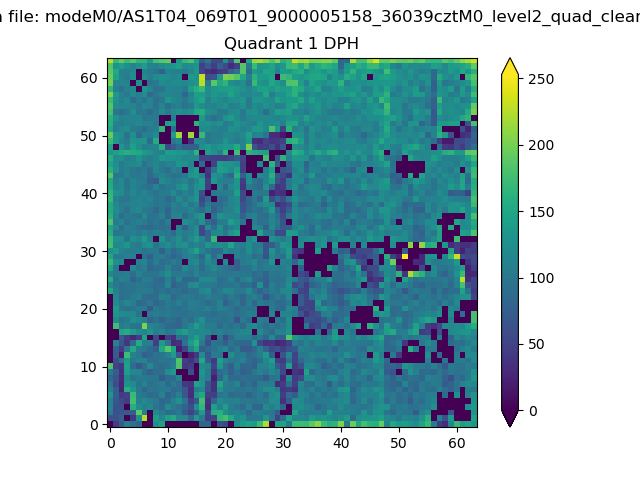 |
Quadrant B |
|---|---|---|---|
| Quadrant D | 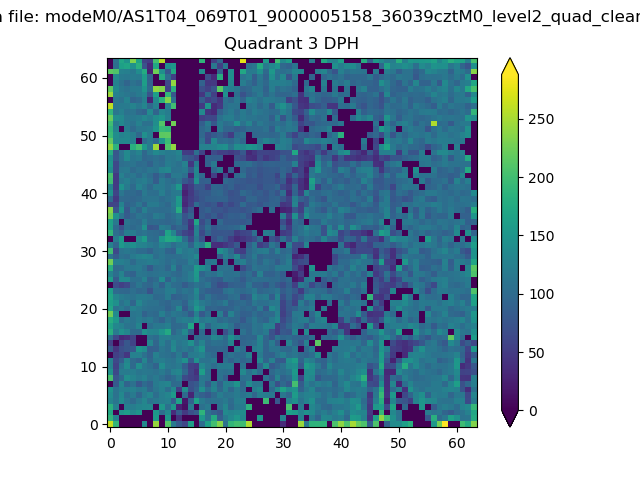 |
 |
Quadrant C |
| Plot type | Count rate plots | Images |
|---|---|---|
| Comparison with Poisson distribution Blue bars denote a histogram of data divided into 1 sec bins. Red curve is a Poisson curve with rate = median count rate of data. |
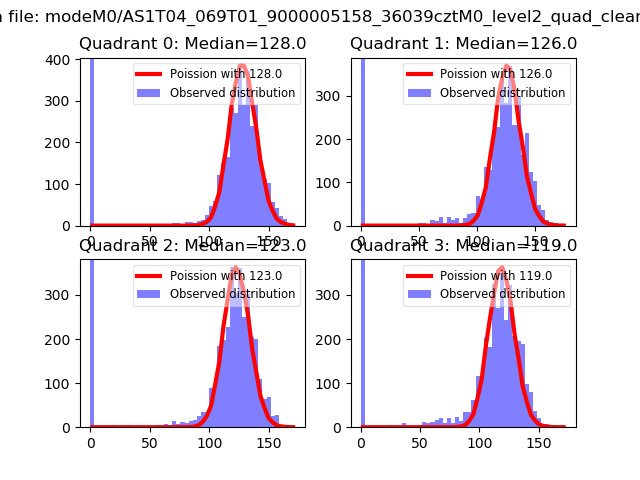 |
 |
| Quadrant-wise count rates Data is divided into 100 sec bins |
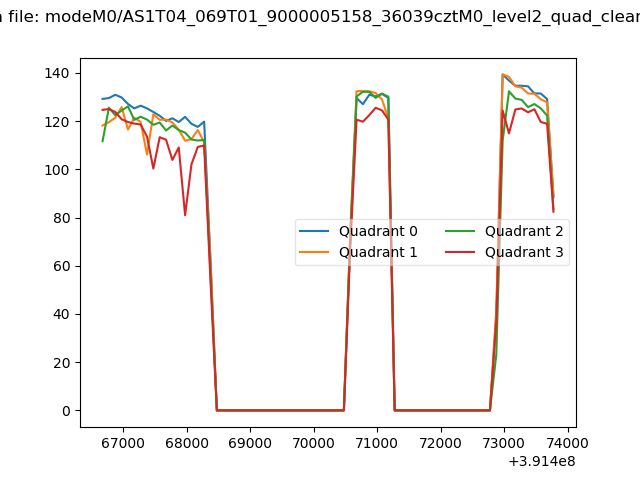 |
|
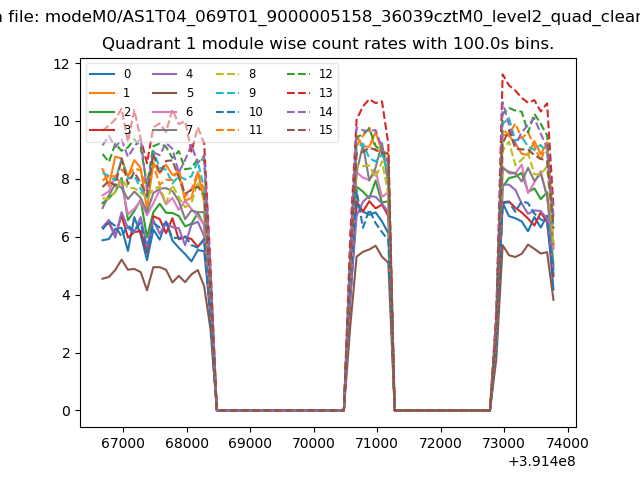
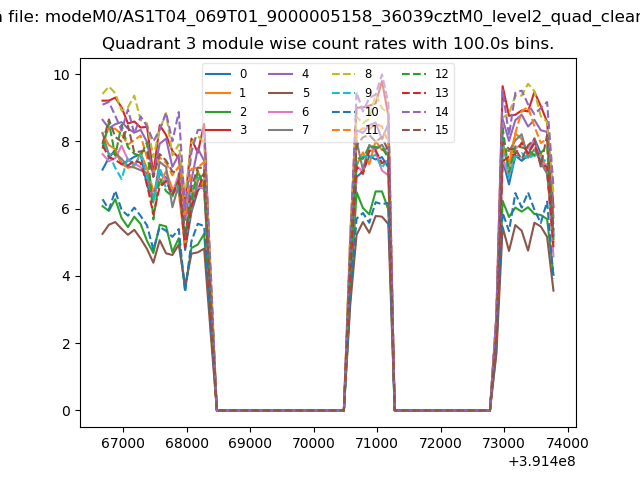
| Module-wise count rates for Quadrant A Data is divided into 100 sec bins |
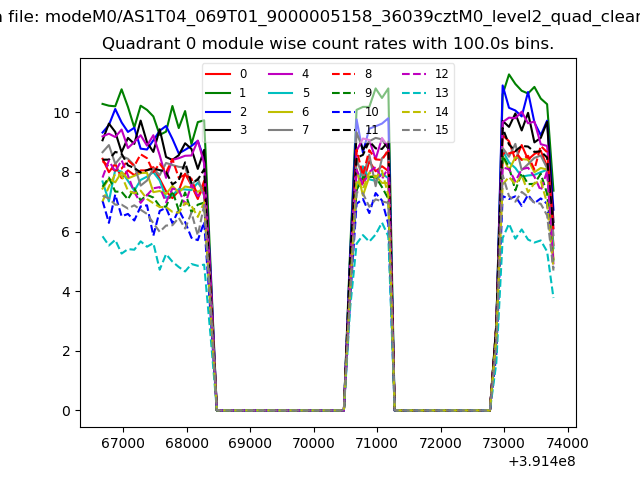 |
 |
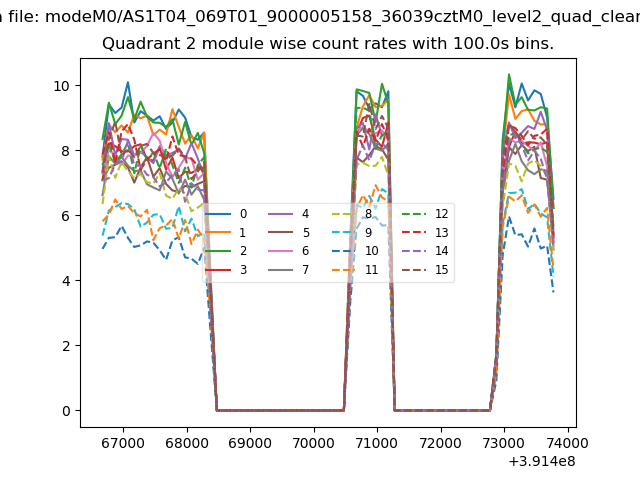
| Module-wise count rates for Quadrant B Data is divided into 100 sec bins |
 |
 |
| Module-wise count rates for Quadrant C Data is divided into 100 sec bins |
 |
 |
| Module-wise count rates for Quadrant D Data is divided into 100 sec bins |
 |
 |
| Parameter | Plot |
|---|---|
| CZT HV Monitor | 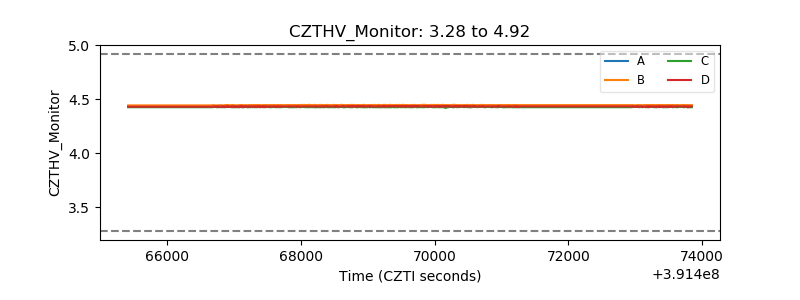 |
| D_VDD | 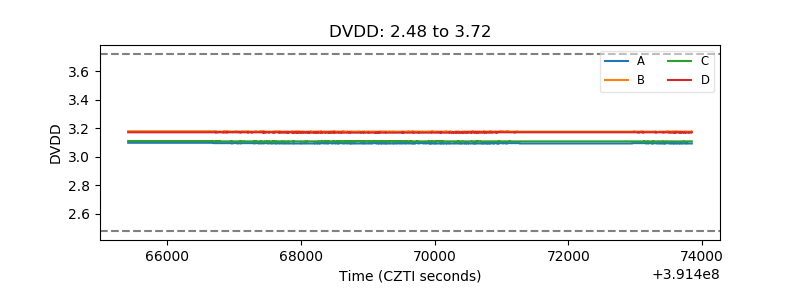 |
| Temperature 1 | 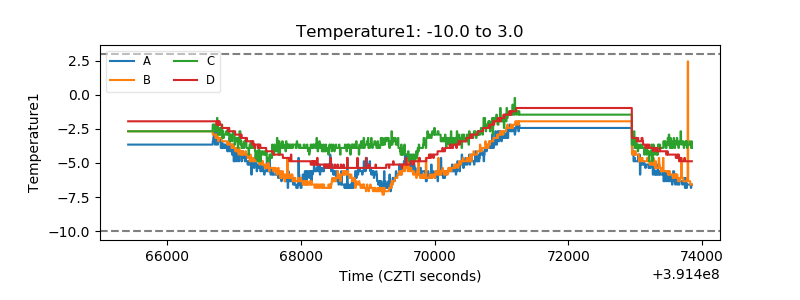 |
| Veto HV Monitor | 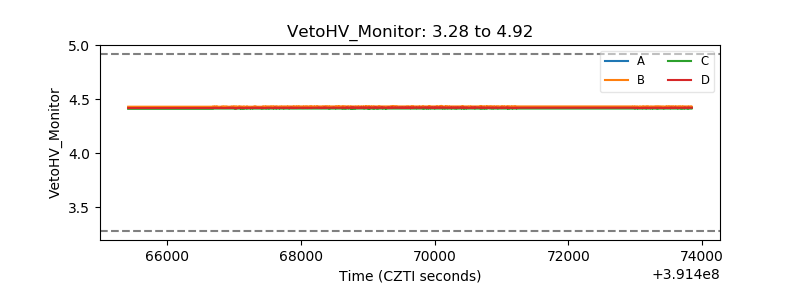 |
| Veto LLD | 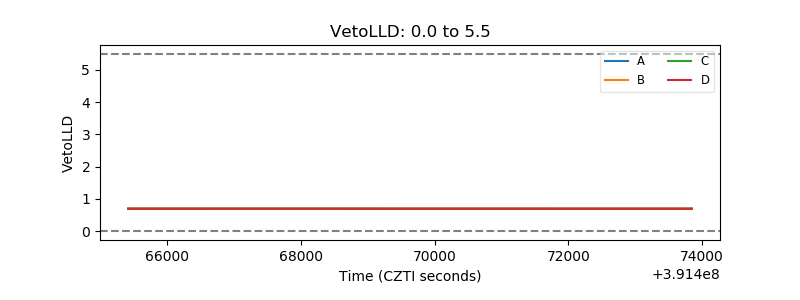 |
| Alpha Counter | 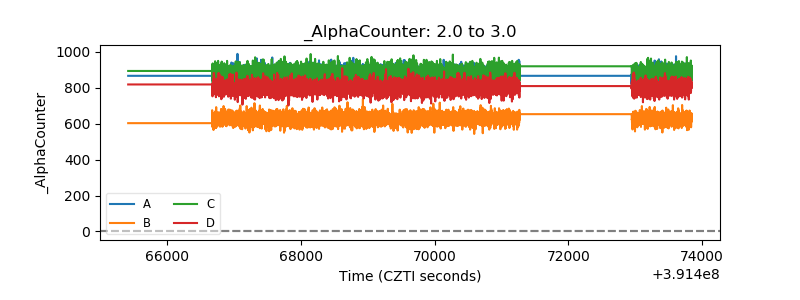 |
| _CPM_Rate | 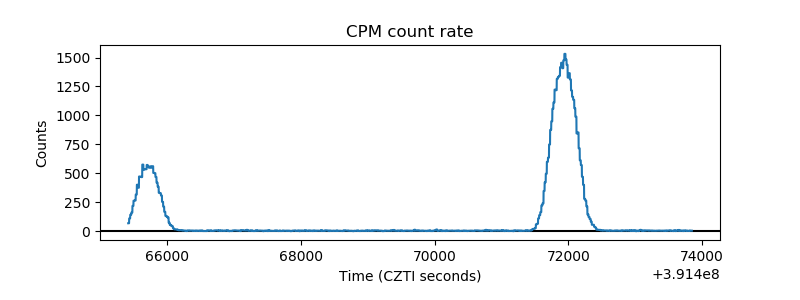 |
| CZT Counter | 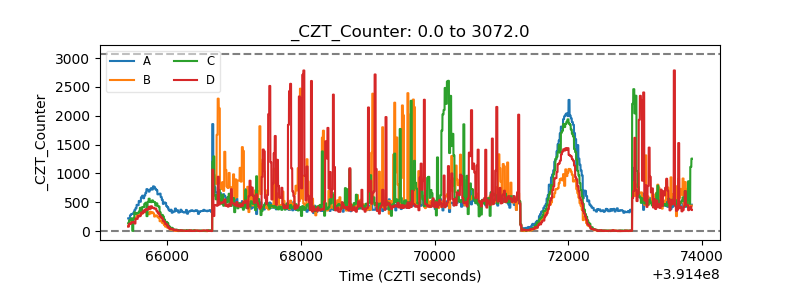 |
| +2.5 Volts monitor | 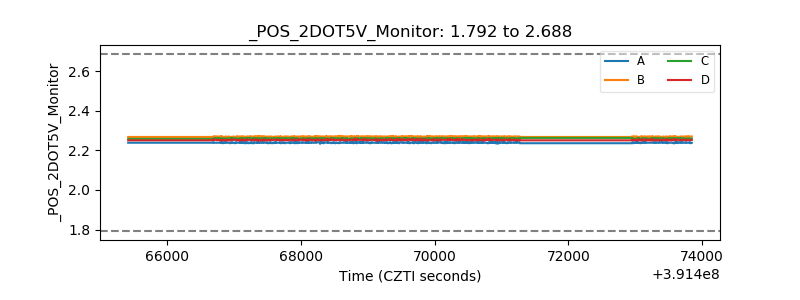 |
| +5 Volts monitor | 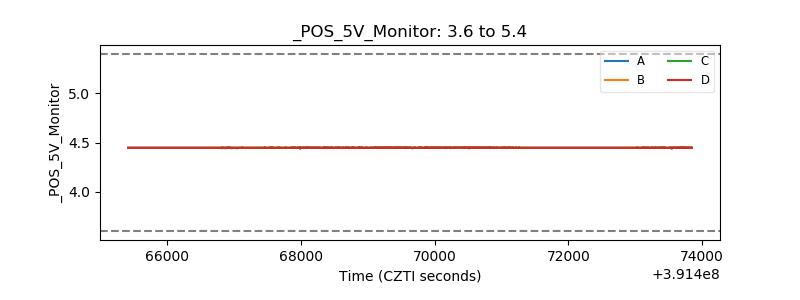 |
| _ROLL_ROT | 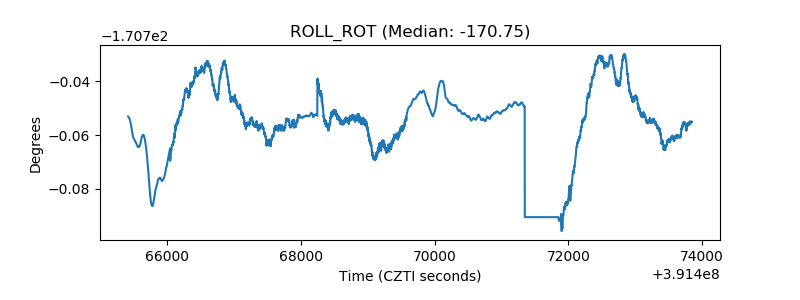 |
| _Roll_DEC |  |
| _Roll_RA |  |
| Veto Counter | 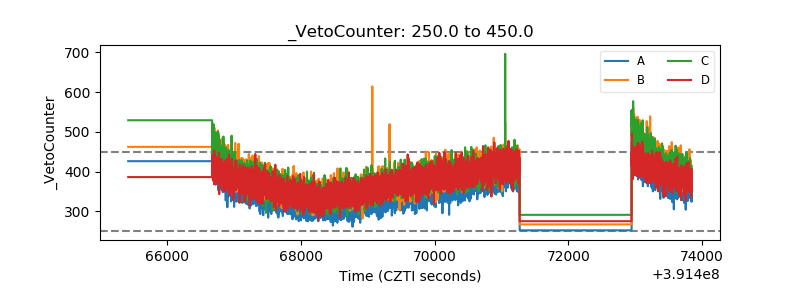 |