| Param | Original file | Final file |
|---|---|---|
| Filename | modeM0/AS1T04_069T01_9000005158_36034cztM0_level2.evt | modeM0/AS1T04_069T01_9000005158_36034cztM0_level2_quad_clean.evt |
| Size (bytes) | 481,559,040 | 85,826,880 |
| Size | 459.3 MB | 81.9 MB |
| Events in quadrant A | 2,777,473 | 565,176 |
| Events in quadrant B | 3,396,105 | 561,174 |
| Events in quadrant C | 3,760,209 | 550,200 |
| Events in quadrant D | 4,255,798 | 516,198 |
| Mode M0 | |||
|---|---|---|---|
| Quadrant | BADHDUFLAG | Total packets | Discarded packets |
| A | 0 | 11965 | 3 |
| B | 0 | 13832 | 2 |
| C | 0 | 14750 | 2 |
| D | 0 | 16437 | 2 |
| Mode M9 | |||
|---|---|---|---|
| Quadrant | BADHDUFLAG | Total packets | Discarded packets |
| A | 0 | 27 | 0 |
| B | 0 | 27 | 0 |
| C | 0 | 27 | 0 |
| D | 0 | 28 | 0 |
| Mode SS | |||
|---|---|---|---|
| Quadrant | BADHDUFLAG | Total packets | Discarded packets |
| A | 0 | 118 | 0 |
| B | 0 | 118 | 0 |
| C | 0 | 118 | 0 |
| D | 0 | 118 | 0 |
| Quadrant | Total seconds | Saturated seconds | Saturation percentage |
|---|---|---|---|
| A | 5814 | 7 | 0.120399% |
| B | 5814 | 135 | 2.321981% |
| C | 5814 | 259 | 4.454764% |
| D | 5814 | 269 | 4.626763% |
Noise dominated data is calculated using 1-second bins in cleaned event files. If a bin has >2000 counts, and if more than 50% of those come from <1% of pixels, then it is considered to be noise-dominated and hence unusable.
| Quadrant | # 1 sec bins | Bins with >0 counts | Bins with >2000 counts | High rate bins dominated by noise | Noise dominated (total time) | Noise dominated (detector-on time) | Marked lightcurve |
|---|---|---|---|---|---|---|---|
| A | 7158 | 5815 | 0 | 0 | 0.00% | 0.00% | 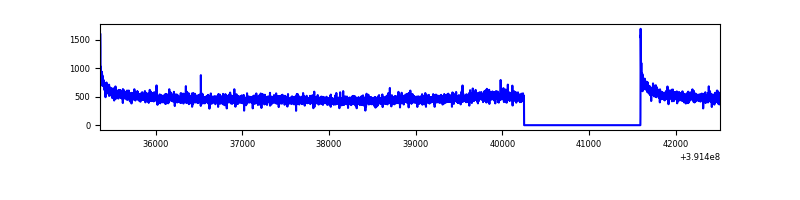 |
| B | 7158 | 5815 | 92 | 92 | 1.29% | 1.58% | 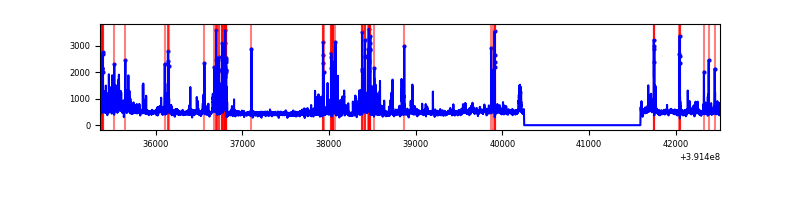 |
| C | 7158 | 5815 | 211 | 211 | 2.95% | 3.63% | 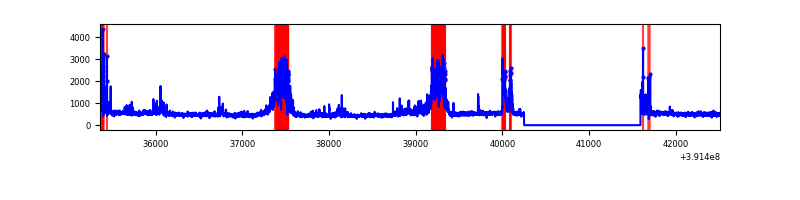 |
| D | 7158 | 5815 | 246 | 246 | 3.44% | 4.23% | 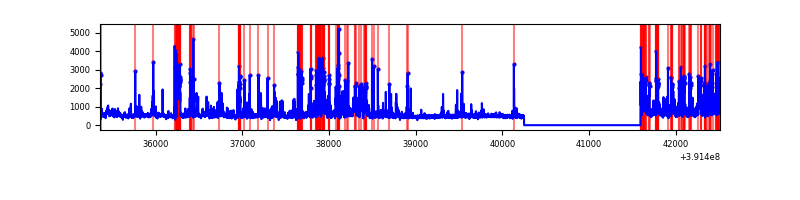 |
Top three noisy pixels from each quadrant. If the there are fewer than three noisy pixels in the level2.evt file, extra rows are filled as -1
| Pixel properties | Quadrant properties | ||||||
|---|---|---|---|---|---|---|---|
| Quadrant | DetID | PixID | Counts | Sigma | Mean | Median | Sigma |
| A | 10 | 83 | 178539 | 1303.53 | 671 | 658 | 136.5 |
| A | 13 | 254 | 9622 | 65.69 | 671 | 658 | 136.5 |
| A | 3 | 137 | 6946 | 46.08 | 671 | 658 | 136.5 |
| B | 5 | 236 | 522986 | 4096.56 | 659 | 640 | 127.5 |
| B | 5 | 255 | 93134 | 725.4 | 659 | 640 | 127.5 |
| B | 0 | 190 | 92276 | 718.67 | 659 | 640 | 127.5 |
| C | 9 | 187 | 874685 | 5868.48 | 635 | 639 | 148.9 |
| C | 15 | 214 | 242511 | 1623.97 | 635 | 639 | 148.9 |
| C | 0 | 10 | 104276 | 695.83 | 635 | 639 | 148.9 |
| D | 12 | 235 | 813899 | 5190.25 | 635 | 616 | 156.7 |
| D | 10 | 118 | 427687 | 2725.5 | 635 | 616 | 156.7 |
| D | 12 | 227 | 165759 | 1053.92 | 635 | 616 | 156.7 |
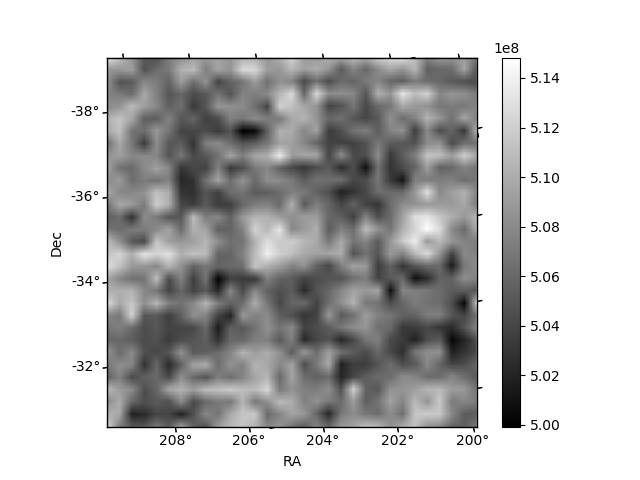
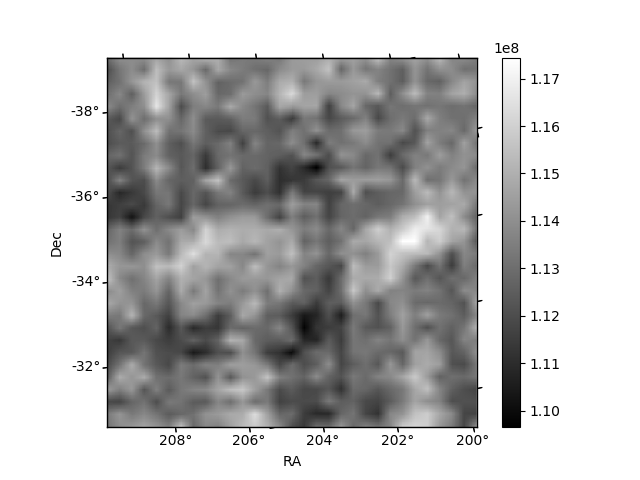
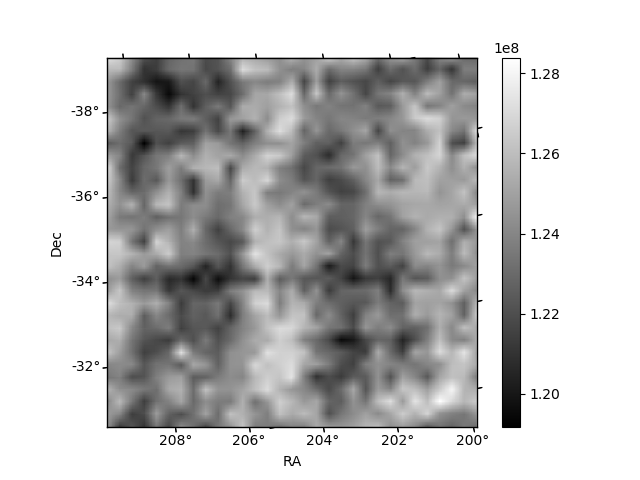
Histogram calculated using DETX and DETY for each event in the final _common_clean file
| Quadrant A | 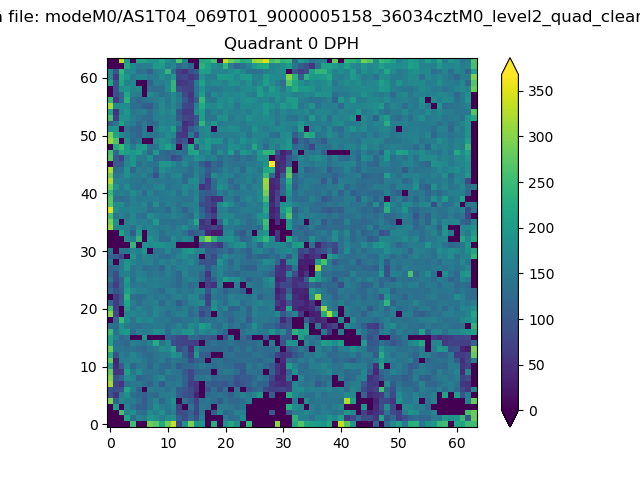 |
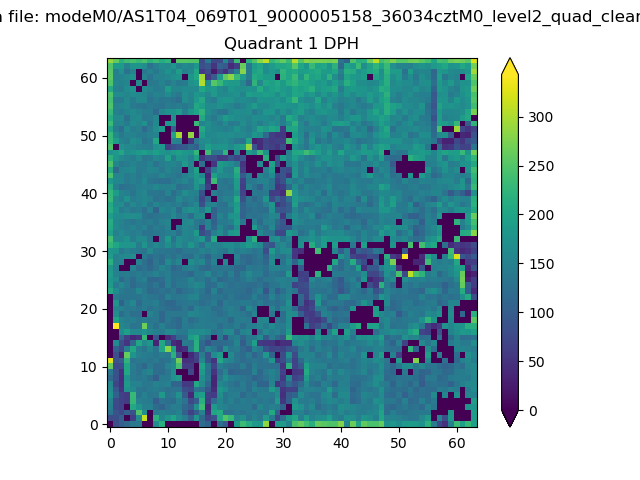 |
Quadrant B |
|---|---|---|---|
| Quadrant D | 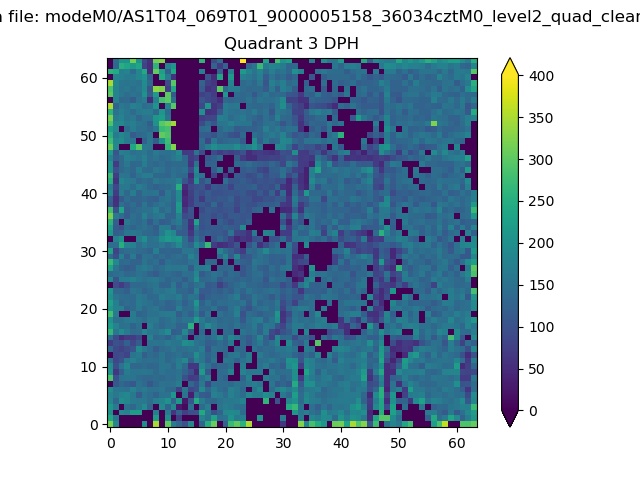 |
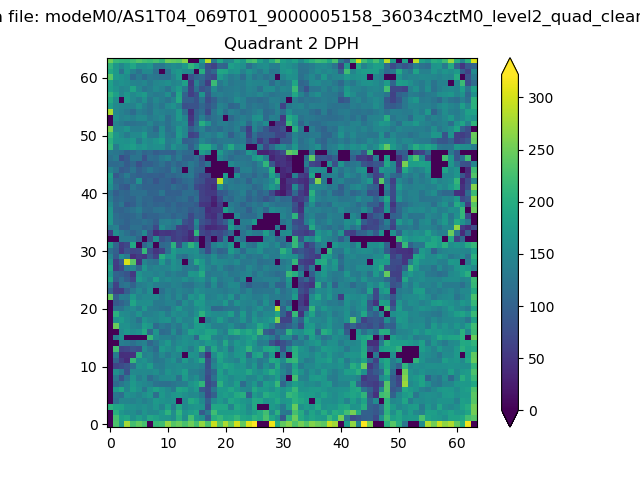 |
Quadrant C |
| Plot type | Count rate plots | Images |
|---|---|---|
| Comparison with Poisson distribution Blue bars denote a histogram of data divided into 1 sec bins. Red curve is a Poisson curve with rate = median count rate of data. |
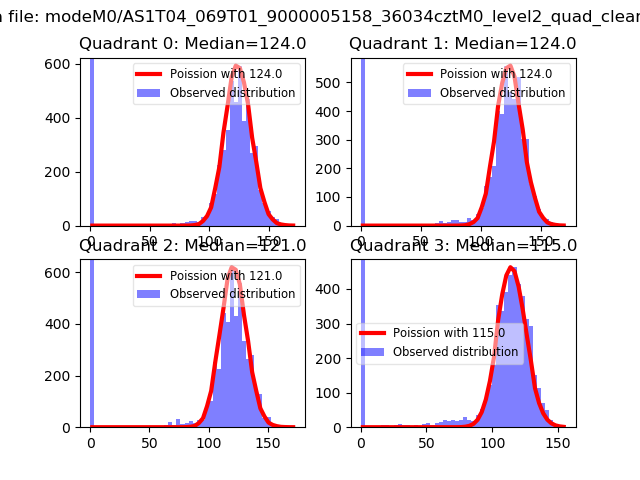 |
 |
| Quadrant-wise count rates Data is divided into 100 sec bins |
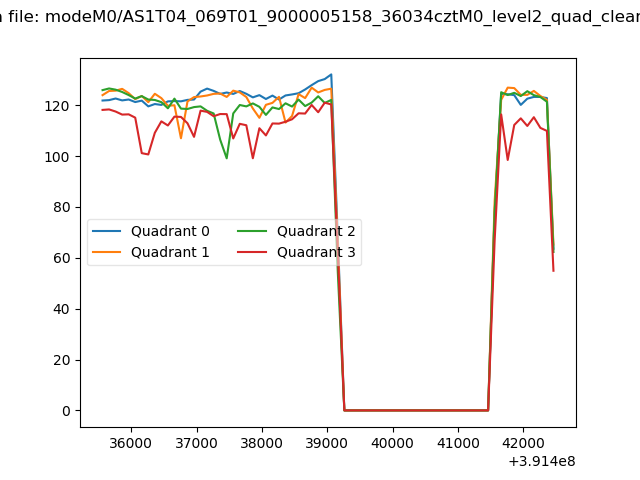 |
|
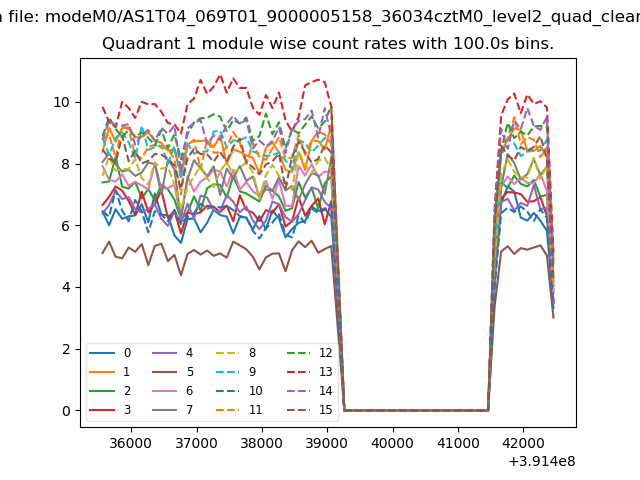
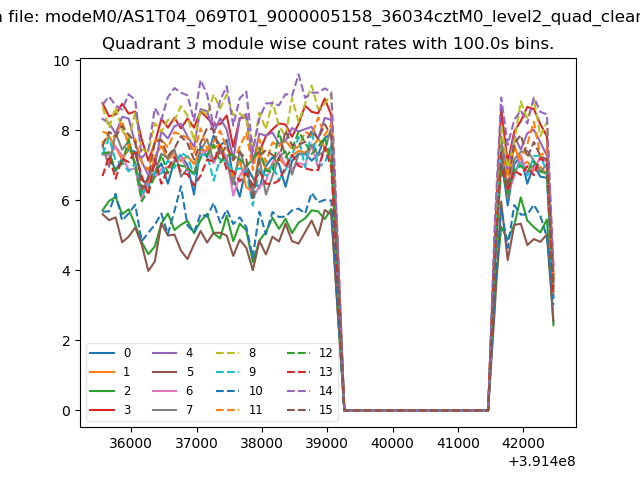
| Module-wise count rates for Quadrant A Data is divided into 100 sec bins |
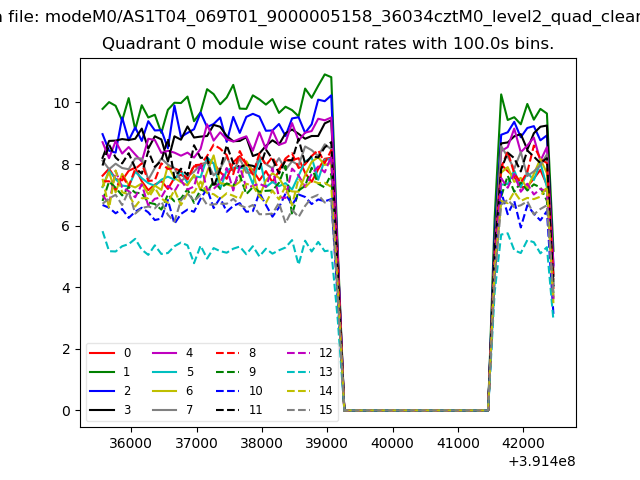 |
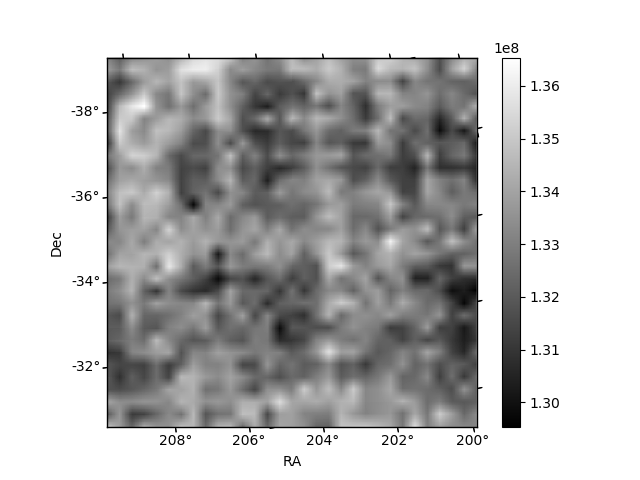 |
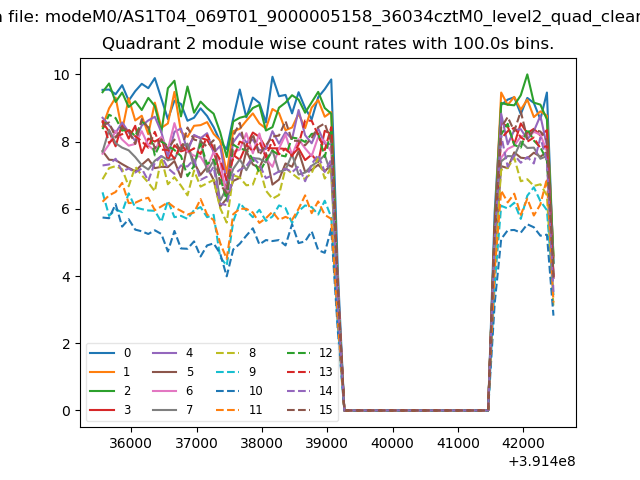
| Module-wise count rates for Quadrant B Data is divided into 100 sec bins |
 |
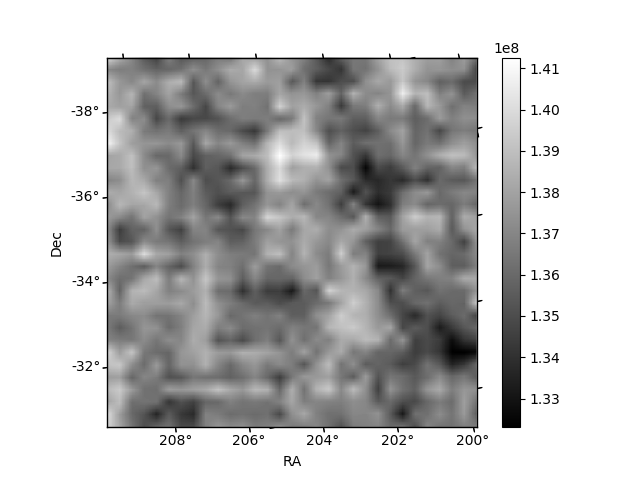 |
| Module-wise count rates for Quadrant C Data is divided into 100 sec bins |
 |
 |
| Module-wise count rates for Quadrant D Data is divided into 100 sec bins |
 |
 |
| Parameter | Plot |
|---|---|
| CZT HV Monitor |  |
| D_VDD | 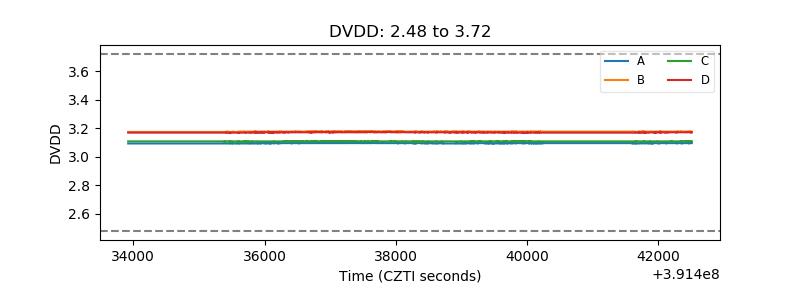 |
| Temperature 1 | 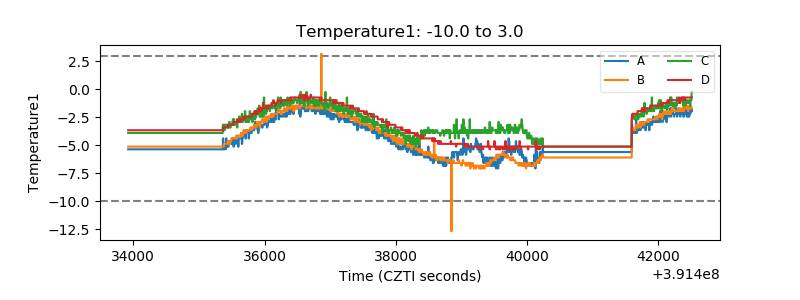 |
| Veto HV Monitor | 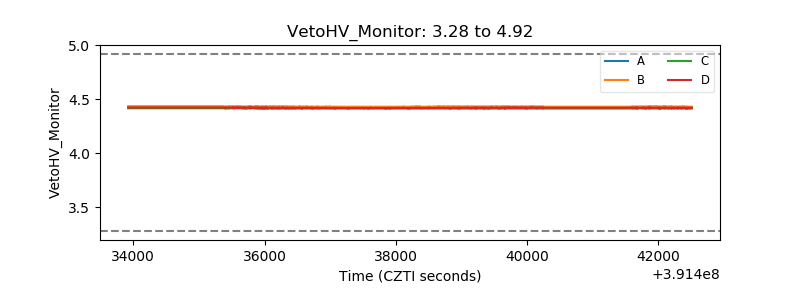 |
| Veto LLD | 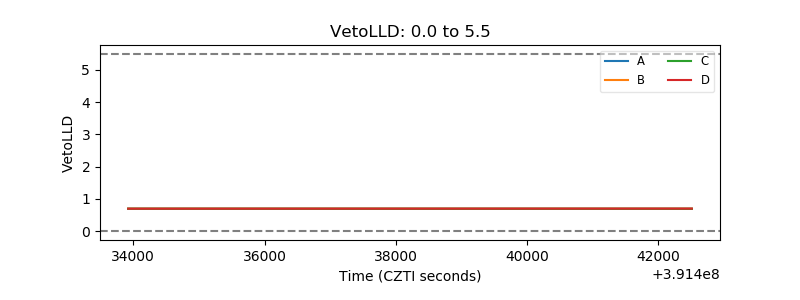 |
| Alpha Counter | 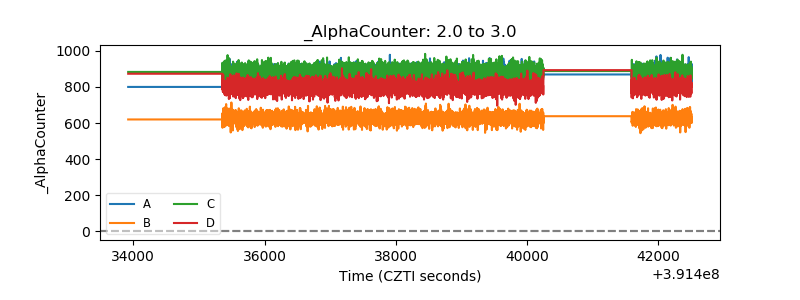 |
| _CPM_Rate | 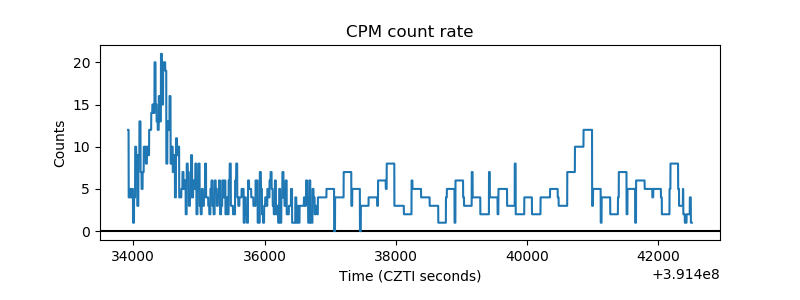 |
| CZT Counter | 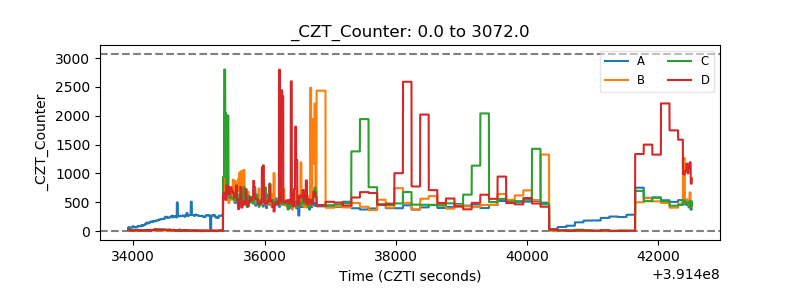 |
| +2.5 Volts monitor | 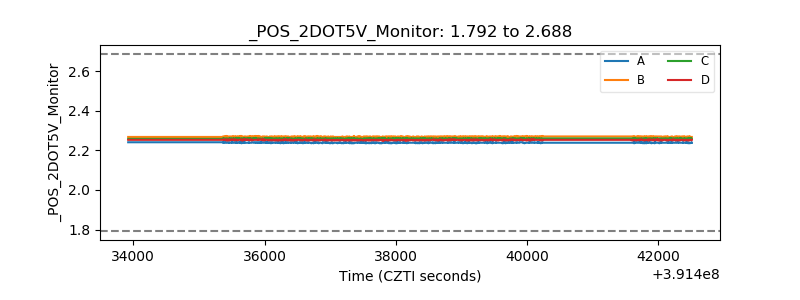 |
| +5 Volts monitor | 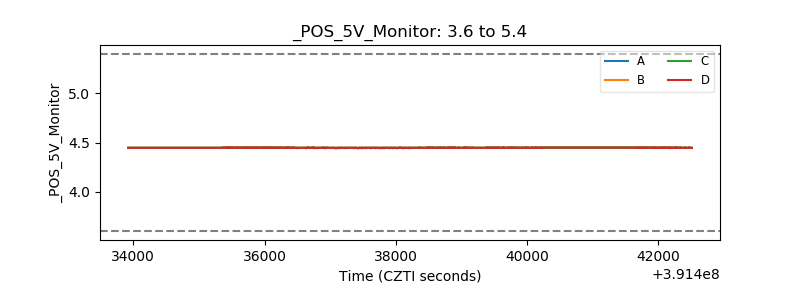 |
| _ROLL_ROT | 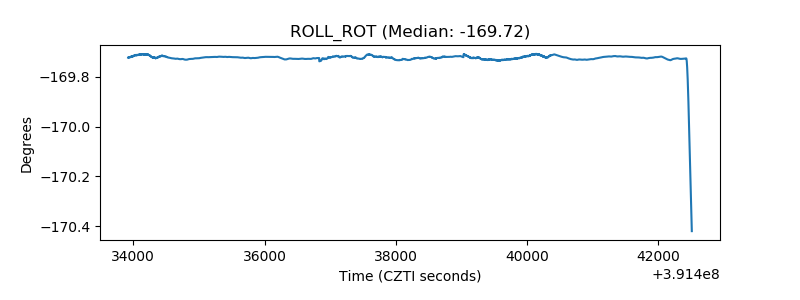 |
| _Roll_DEC | 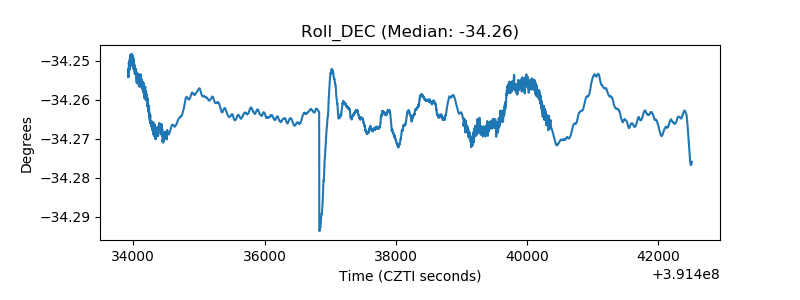 |
| _Roll_RA | 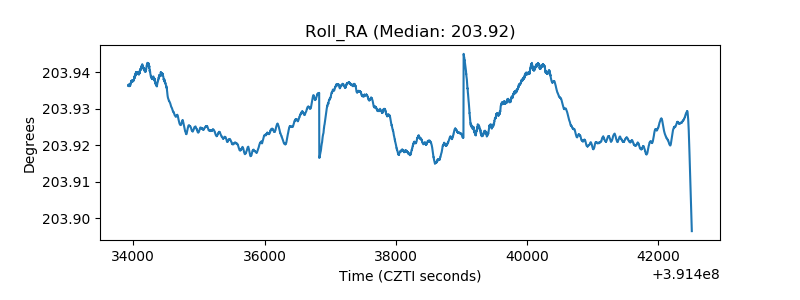 |
| Veto Counter | 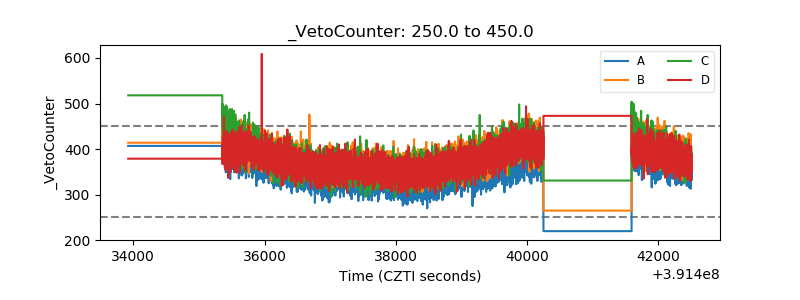 |