| Param | Original file | Final file |
|---|---|---|
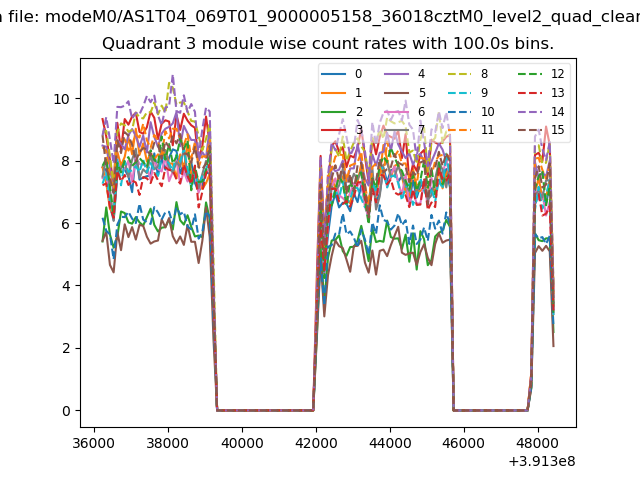
| Filename | modeM0/AS1T04_069T01_9000005158_36018cztM0_level2.evt | modeM0/AS1T04_069T01_9000005158_36018cztM0_level2_quad_clean.evt |
| Size (bytes) | 898,632,000 | 143,383,680 |
| Size | 857.0 MB | 136.7 MB |
| Events in quadrant A | 4,800,962 | 953,609 |
| Events in quadrant B | 7,222,395 | 926,775 |
| Events in quadrant C | 5,949,617 | 932,705 |
| Events in quadrant D | 8,589,354 | 858,391 |
| Mode M0 | |||
|---|---|---|---|
| Quadrant | BADHDUFLAG | Total packets | Discarded packets |
| A | 0 | 20023 | 4 |
| B | 0 | 27870 | 3 |
| C | 0 | 23358 | 3 |
| D | 0 | 31836 | 6 |
| Mode M9 | |||
|---|---|---|---|
| Quadrant | BADHDUFLAG | Total packets | Discarded packets |
| A | 0 | 43 | 0 |
| B | 0 | 43 | 0 |
| C | 0 | 43 | 0 |
| D | 0 | 44 | 0 |
| Mode SS | |||
|---|---|---|---|
| Quadrant | BADHDUFLAG | Total packets | Discarded packets |
| A | 0 | 198 | 0 |
| B | 0 | 198 | 0 |
| C | 0 | 198 | 0 |
| D | 0 | 198 | 0 |
| Quadrant | Total seconds | Saturated seconds | Saturation percentage |
|---|---|---|---|
| A | 9673 | 20 | 0.206761% |
| B | 9673 | 540 | 5.582549% |
| C | 9673 | 352 | 3.638995% |
| D | 9672 | 769 | 7.950786% |
Noise dominated data is calculated using 1-second bins in cleaned event files. If a bin has >2000 counts, and if more than 50% of those come from <1% of pixels, then it is considered to be noise-dominated and hence unusable.
| Quadrant | # 1 sec bins | Bins with >0 counts | Bins with >2000 counts | High rate bins dominated by noise | Noise dominated (total time) | Noise dominated (detector-on time) | Marked lightcurve |
|---|---|---|---|---|---|---|---|
| A | 13439 | 9675 | 7 | 7 | 0.05% | 0.07% | 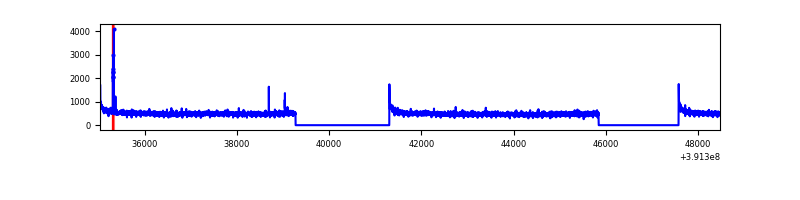 |
| B | 13439 | 9675 | 385 | 385 | 2.86% | 3.98% | 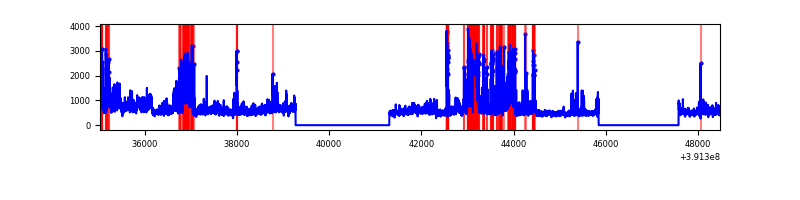 |
| C | 13439 | 9675 | 311 | 311 | 2.31% | 3.21% | 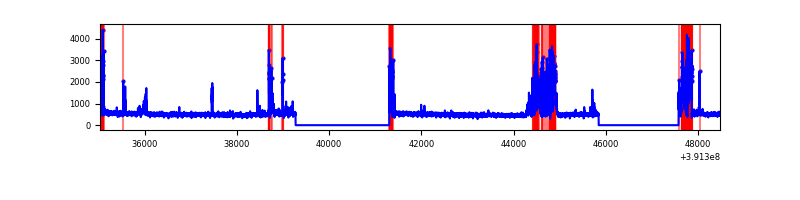 |
| D | 13439 | 9675 | 732 | 732 | 5.45% | 7.57% | 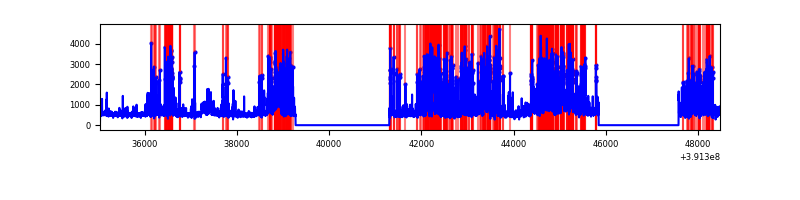 |
Top three noisy pixels from each quadrant. If the there are fewer than three noisy pixels in the level2.evt file, extra rows are filled as -1
| Pixel properties | Quadrant properties | ||||||
|---|---|---|---|---|---|---|---|
| Quadrant | DetID | PixID | Counts | Sigma | Mean | Median | Sigma |
| A | 10 | 83 | 280754 | 1197.0 | 1157 | 1136 | 233.6 |
| A | 10 | 248 | 24093 | 98.28 | 1157 | 1136 | 233.6 |
| A | 13 | 254 | 15748 | 62.55 | 1157 | 1136 | 233.6 |
| B | 5 | 172 | 1142859 | 5376.82 | 1117 | 1085 | 212.4 |
| B | 0 | 213 | 900081 | 4233.54 | 1117 | 1085 | 212.4 |
| B | 0 | 190 | 511406 | 2403.19 | 1117 | 1085 | 212.4 |
| C | 9 | 187 | 1025511 | 4046.37 | 1095 | 1102 | 253.2 |
| C | 15 | 214 | 398635 | 1570.24 | 1095 | 1102 | 253.2 |
| C | 0 | 10 | 254487 | 1000.86 | 1095 | 1102 | 253.2 |
| D | 12 | 235 | 2491730 | 9443.92 | 1091 | 1062 | 263.7 |
| D | 12 | 6 | 1166220 | 4417.96 | 1091 | 1062 | 263.7 |
| D | 13 | 249 | 206810 | 780.14 | 1091 | 1062 | 263.7 |
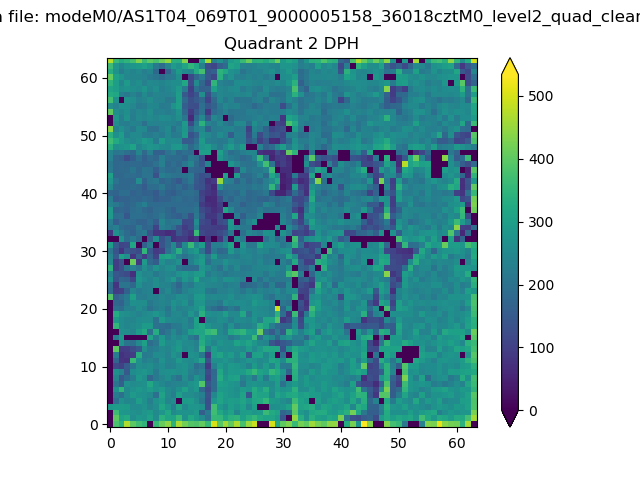
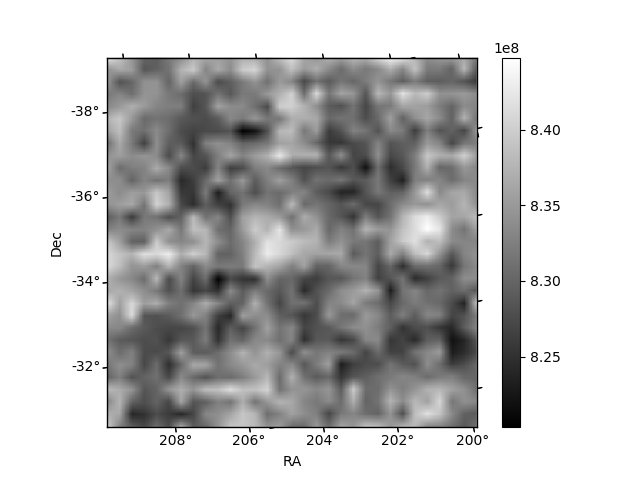
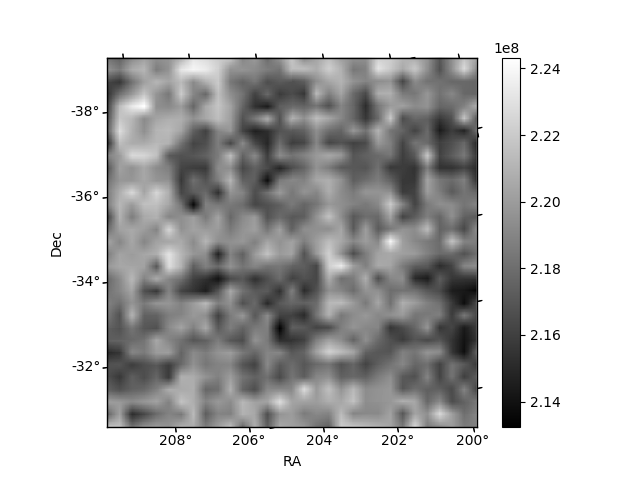
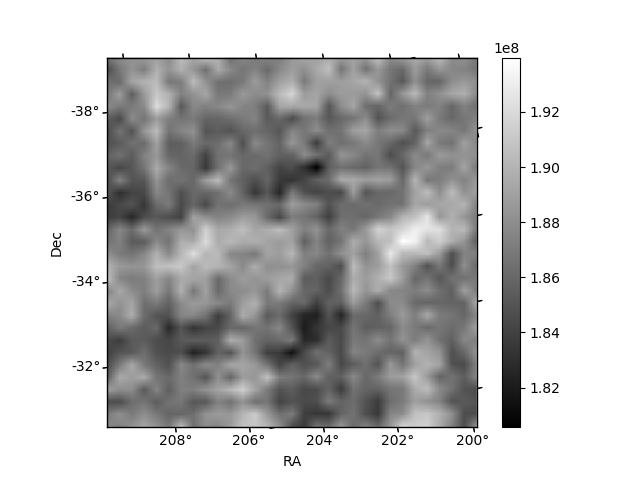
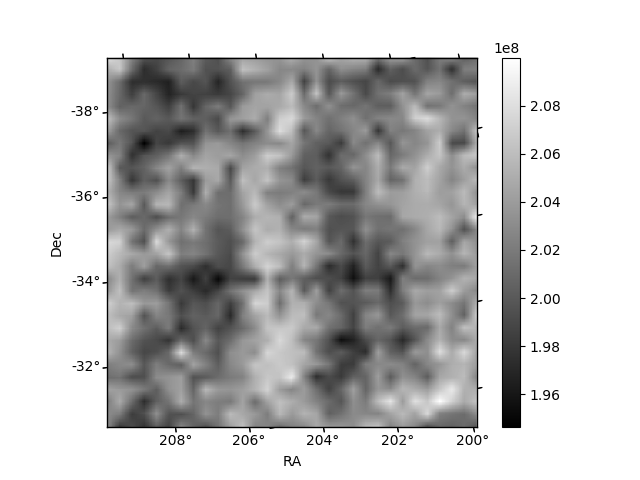
Histogram calculated using DETX and DETY for each event in the final _common_clean file
| Quadrant A | 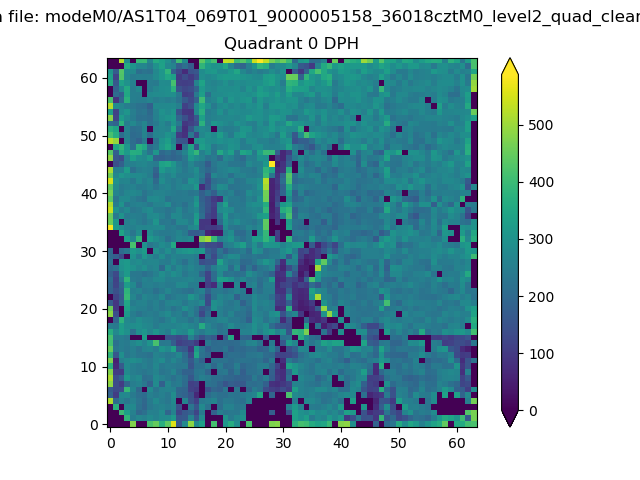 |
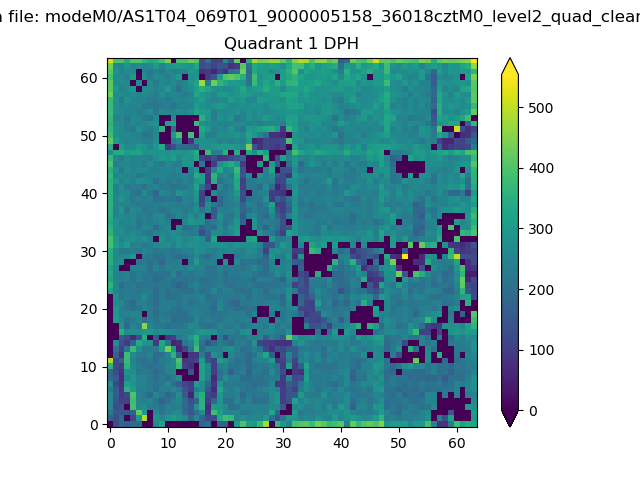 |
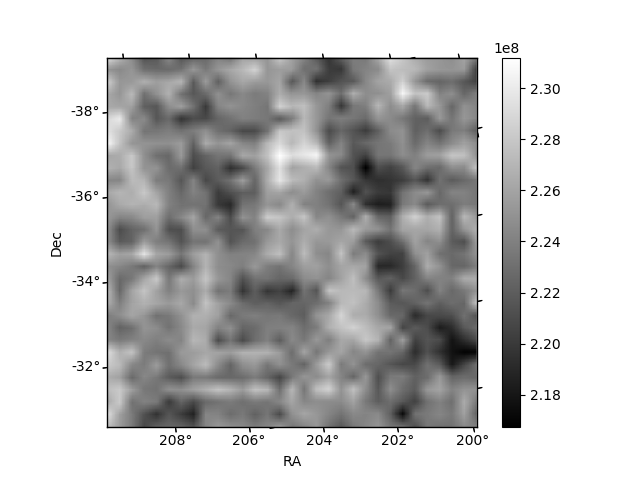
Quadrant B |
|---|---|---|---|
| Quadrant D | 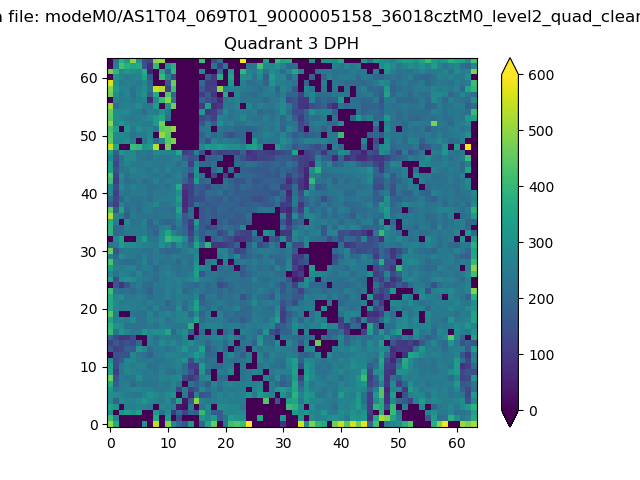 |
 |
Quadrant C |
| Plot type | Count rate plots | Images |
|---|---|---|
| Comparison with Poisson distribution Blue bars denote a histogram of data divided into 1 sec bins. Red curve is a Poisson curve with rate = median count rate of data. |
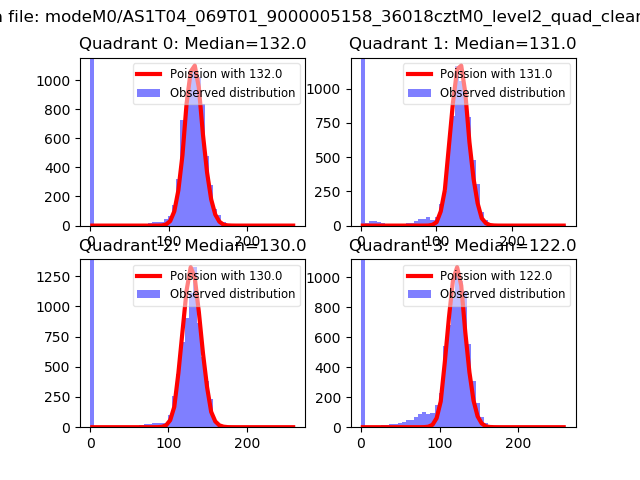 |
 |
| Quadrant-wise count rates Data is divided into 100 sec bins |
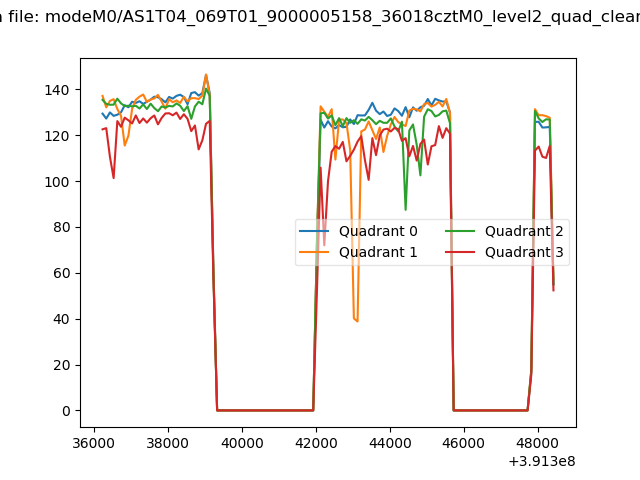 |
|
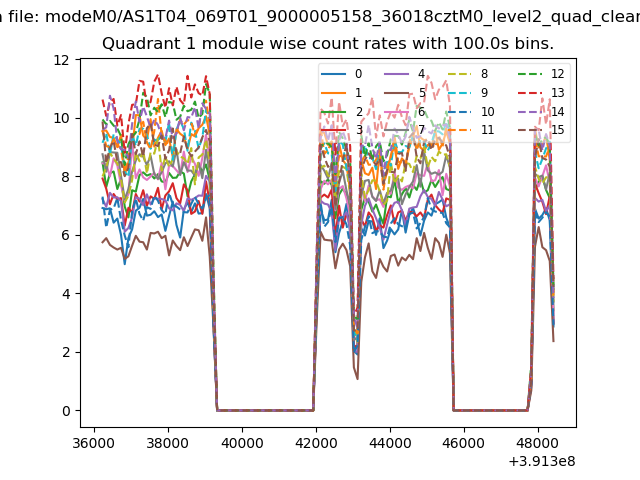
| Module-wise count rates for Quadrant A Data is divided into 100 sec bins |
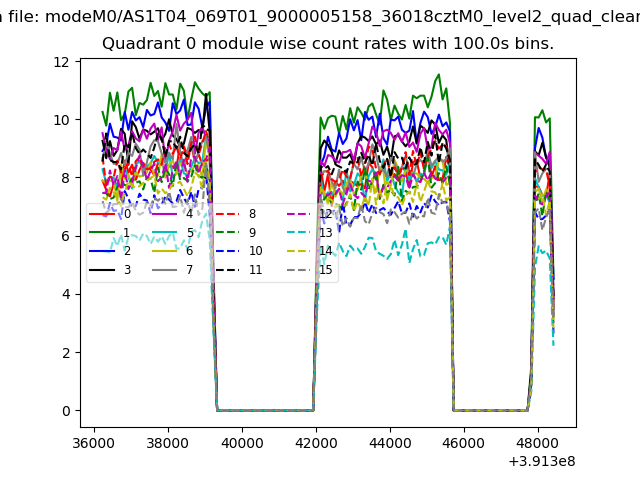 |
 |
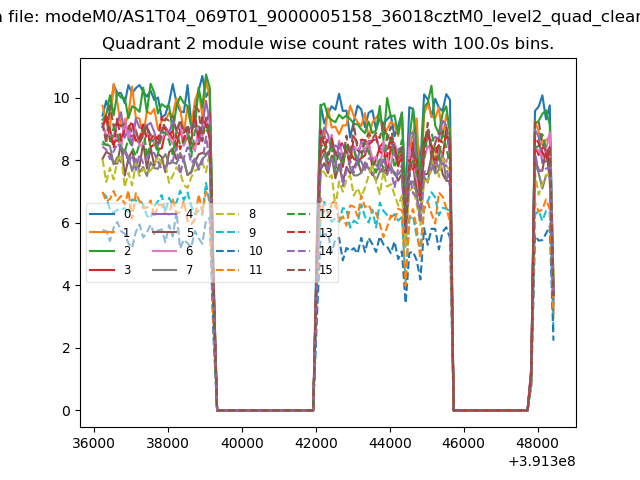
| Module-wise count rates for Quadrant B Data is divided into 100 sec bins |
 |
 |
| Module-wise count rates for Quadrant C Data is divided into 100 sec bins |
 |
 |
| Module-wise count rates for Quadrant D Data is divided into 100 sec bins |
 |
 |
| Parameter | Plot |
|---|---|
| CZT HV Monitor | 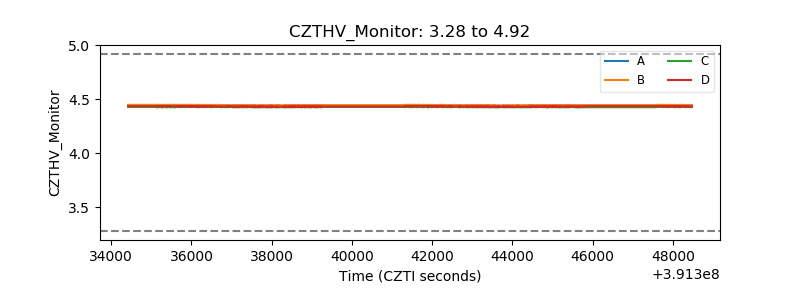 |
| D_VDD | 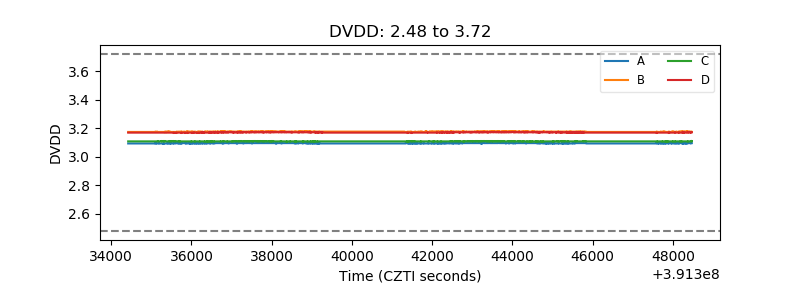 |
| Temperature 1 | 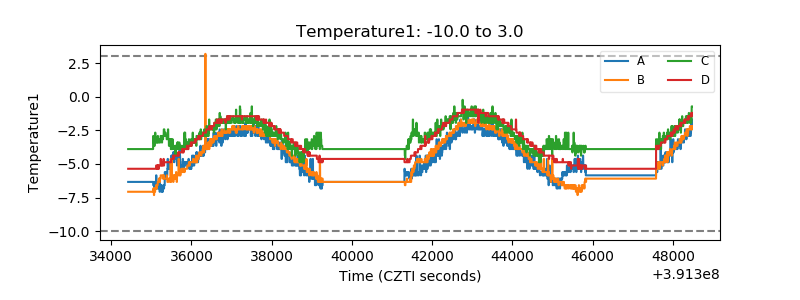 |
| Veto HV Monitor | 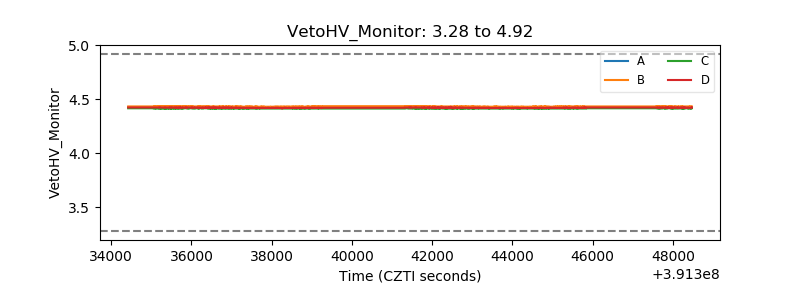 |
| Veto LLD | 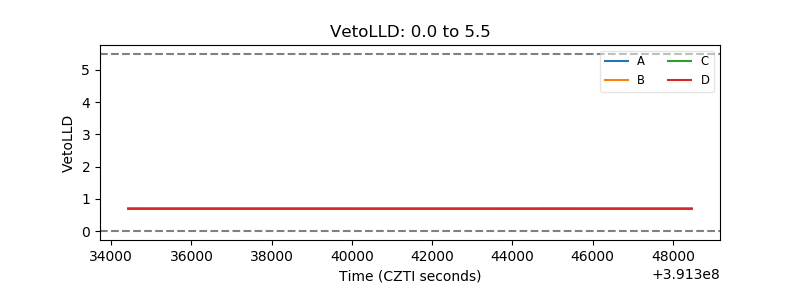 |
| Alpha Counter | 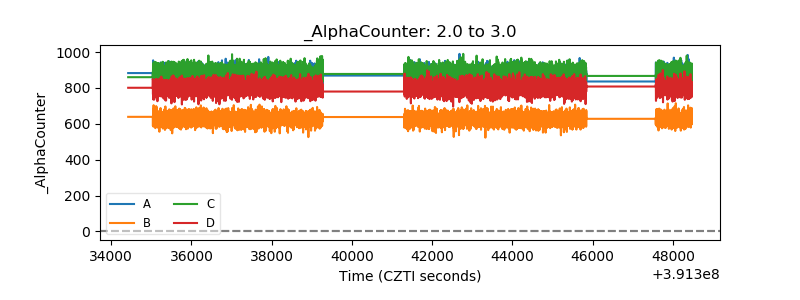 |
| _CPM_Rate | 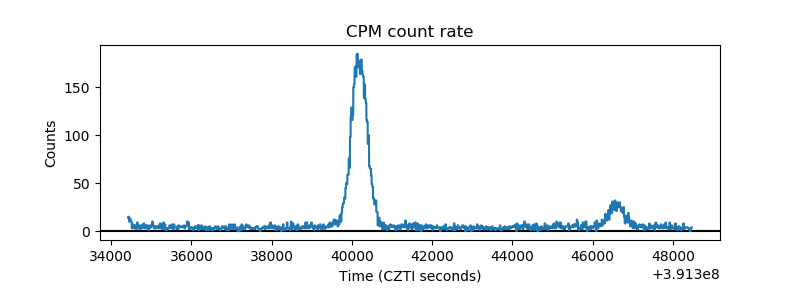 |
| CZT Counter | 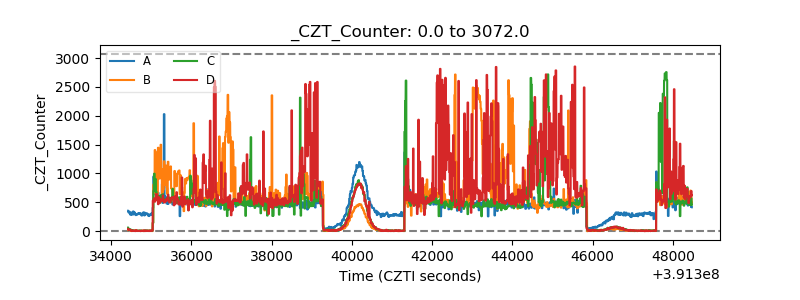 |
| +2.5 Volts monitor | 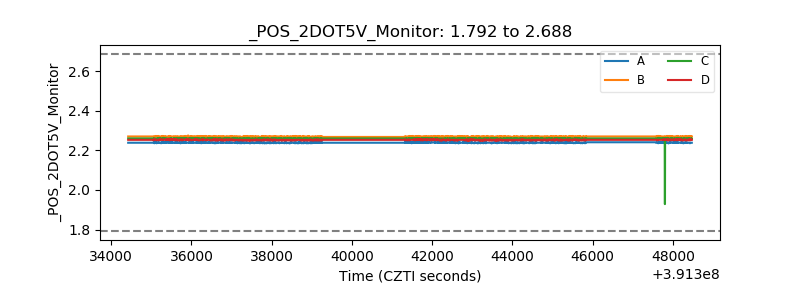 |
| +5 Volts monitor | 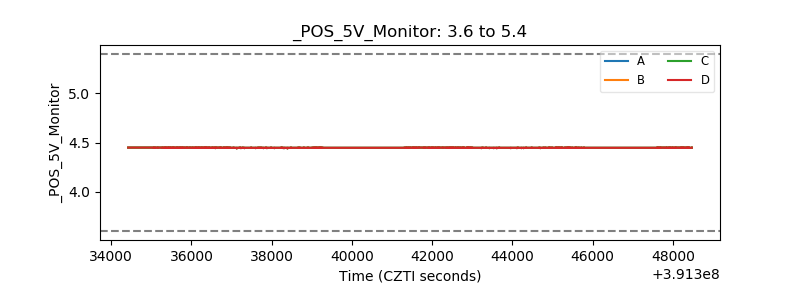 |
| _ROLL_ROT | 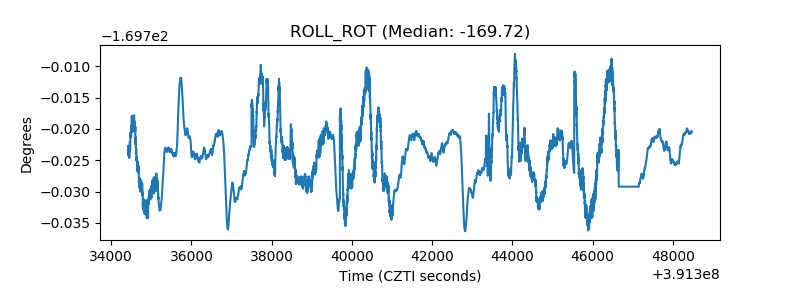 |
| _Roll_DEC | 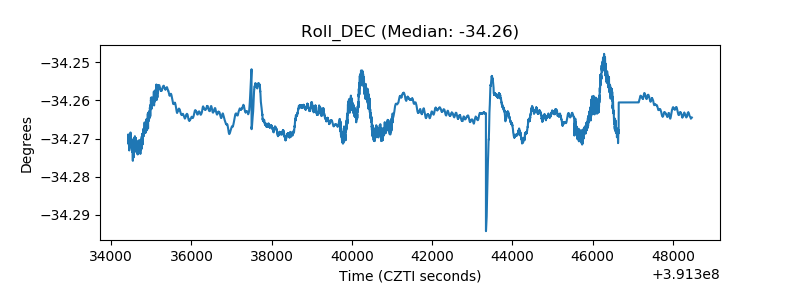 |
| _Roll_RA | 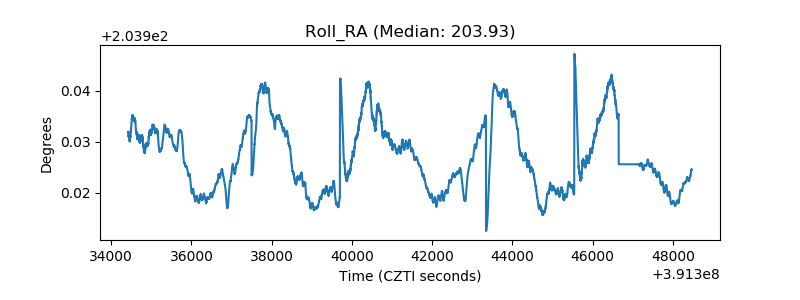 |
| Veto Counter | 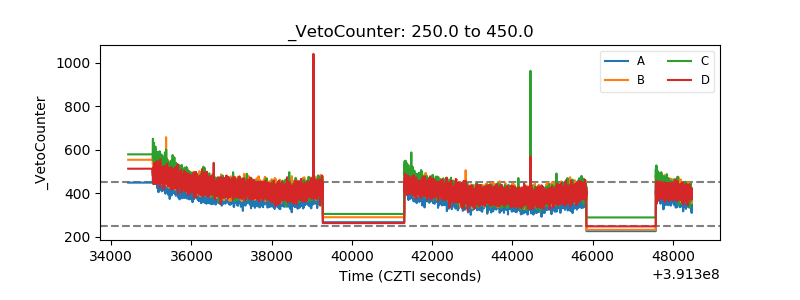 |