| Param | Original file | Final file |
|---|---|---|
| Filename | modeM0/AS1T04_069T01_9000005158_36013cztM0_level2.evt | modeM0/AS1T04_069T01_9000005158_36013cztM0_level2_quad_clean.evt |
| Size (bytes) | 501,805,440 | 55,321,920 |
| Size | 478.6 MB | 52.8 MB |
| Events in quadrant A | 2,680,745 | 345,448 |
| Events in quadrant B | 2,964,332 | 345,239 |
| Events in quadrant C | 3,892,820 | 309,184 |
| Events in quadrant D | 5,299,080 | 302,263 |
| Mode M0 | |||
|---|---|---|---|
| Quadrant | BADHDUFLAG | Total packets | Discarded packets |
| A | 0 | 11112 | 3 |
| B | 0 | 12113 | 2 |
| C | 0 | 14606 | 2 |
| D | 0 | 19522 | 2 |
| Mode M9 | |||
|---|---|---|---|
| Quadrant | BADHDUFLAG | Total packets | Discarded packets |
| A | 0 | 28 | 0 |
| B | 0 | 28 | 0 |
| C | 0 | 28 | 0 |
| D | 0 | 29 | 0 |
| Mode SS | |||
|---|---|---|---|
| Quadrant | BADHDUFLAG | Total packets | Discarded packets |
| A | 0 | 106 | 0 |
| B | 0 | 106 | 0 |
| C | 0 | 106 | 0 |
| D | 0 | 106 | 0 |
| Quadrant | Total seconds | Saturated seconds | Saturation percentage |
|---|---|---|---|
| A | 5327 | 6 | 0.112634% |
| B | 5327 | 125 | 2.346537% |
| C | 5327 | 469 | 8.804205% |
| D | 5327 | 242 | 4.542895% |
Noise dominated data is calculated using 1-second bins in cleaned event files. If a bin has >2000 counts, and if more than 50% of those come from <1% of pixels, then it is considered to be noise-dominated and hence unusable.
| Quadrant | # 1 sec bins | Bins with >0 counts | Bins with >2000 counts | High rate bins dominated by noise | Noise dominated (total time) | Noise dominated (detector-on time) | Marked lightcurve |
|---|---|---|---|---|---|---|---|
| A | 7240 | 5328 | 0 | 0 | 0.00% | 0.00% | 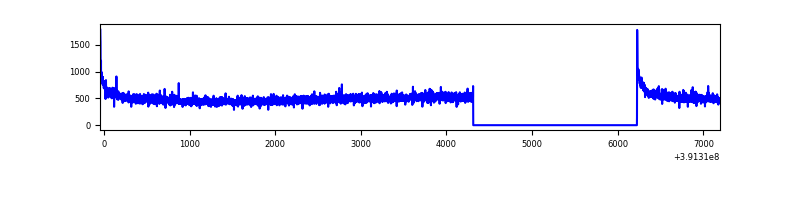 |
| B | 7240 | 5327 | 81 | 81 | 1.12% | 1.52% | 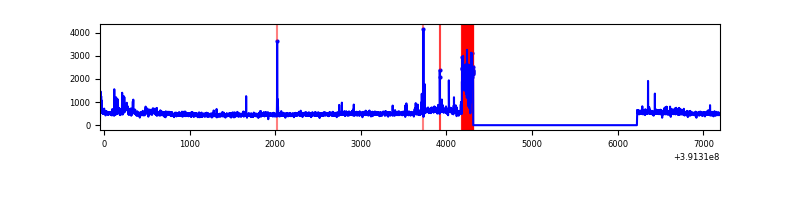 |
| C | 7240 | 5327 | 351 | 351 | 4.85% | 6.59% | 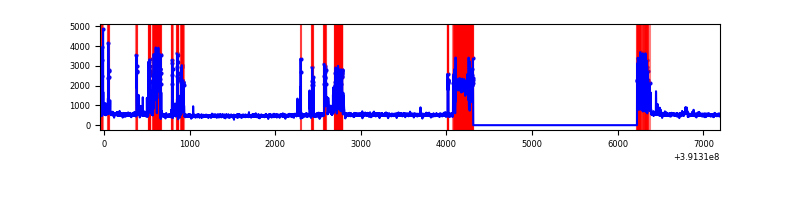 |
| D | 7240 | 5328 | 227 | 227 | 3.14% | 4.26% | 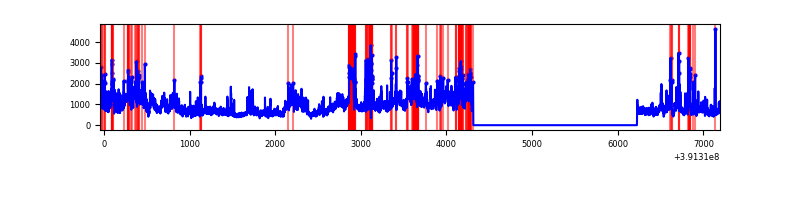 |
Top three noisy pixels from each quadrant. If the there are fewer than three noisy pixels in the level2.evt file, extra rows are filled as -1
| Pixel properties | Quadrant properties | ||||||
|---|---|---|---|---|---|---|---|
| Quadrant | DetID | PixID | Counts | Sigma | Mean | Median | Sigma |
| A | 10 | 83 | 161520 | 1228.99 | 648 | 636 | 130.9 |
| A | 13 | 254 | 8820 | 62.52 | 648 | 636 | 130.9 |
| A | 13 | 6 | 7026 | 48.81 | 648 | 636 | 130.9 |
| B | 5 | 172 | 250570 | 2046.93 | 645 | 628 | 122.1 |
| B | 4 | 81 | 34383 | 276.44 | 645 | 628 | 122.1 |
| B | 4 | 232 | 30063 | 241.06 | 645 | 628 | 122.1 |
| C | 9 | 187 | 1174249 | 8443.11 | 603 | 608 | 139.0 |
| C | 15 | 214 | 213699 | 1532.97 | 603 | 608 | 139.0 |
| C | 0 | 10 | 149435 | 1070.65 | 603 | 608 | 139.0 |
| D | 12 | 227 | 1477232 | 9799.87 | 616 | 599 | 150.7 |
| D | 12 | 235 | 787566 | 5222.81 | 616 | 599 | 150.7 |
| D | 12 | 6 | 263280 | 1743.32 | 616 | 599 | 150.7 |
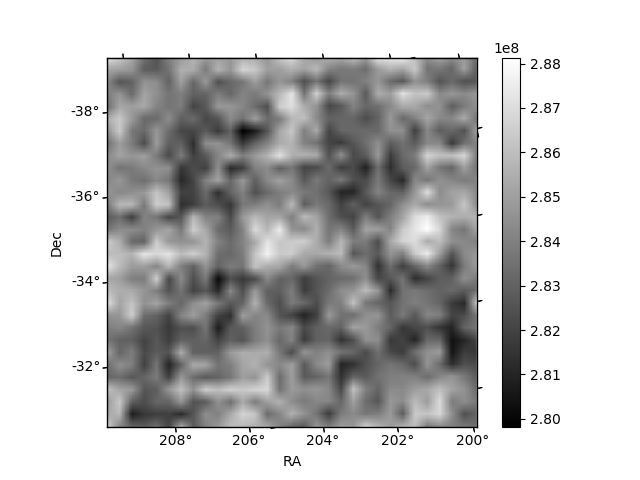
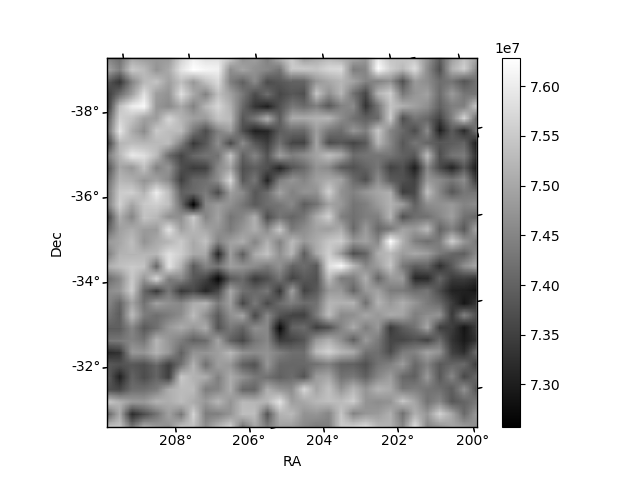
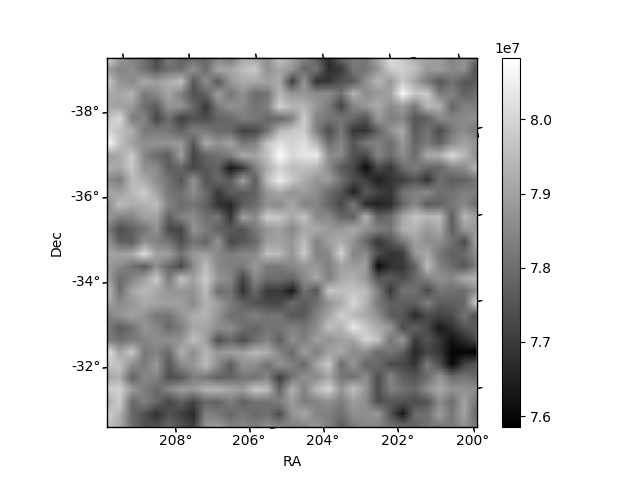
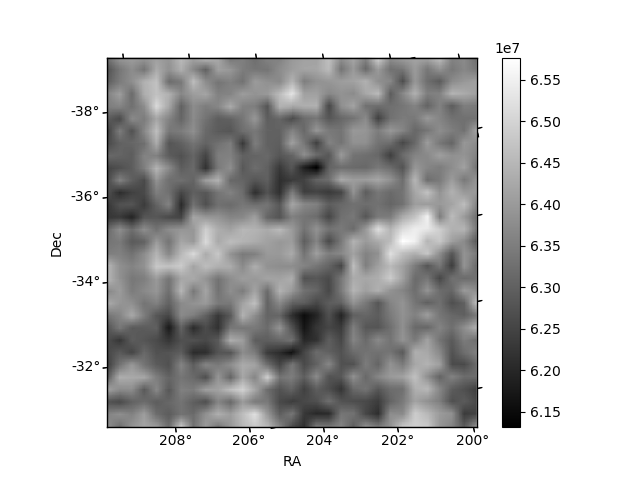
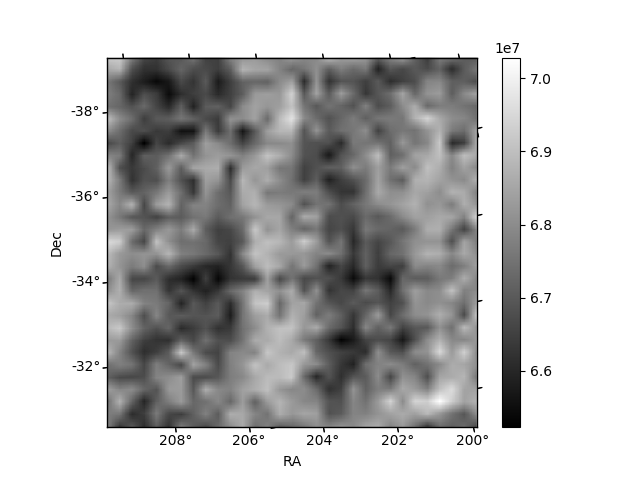
Histogram calculated using DETX and DETY for each event in the final _common_clean file
| Quadrant A | 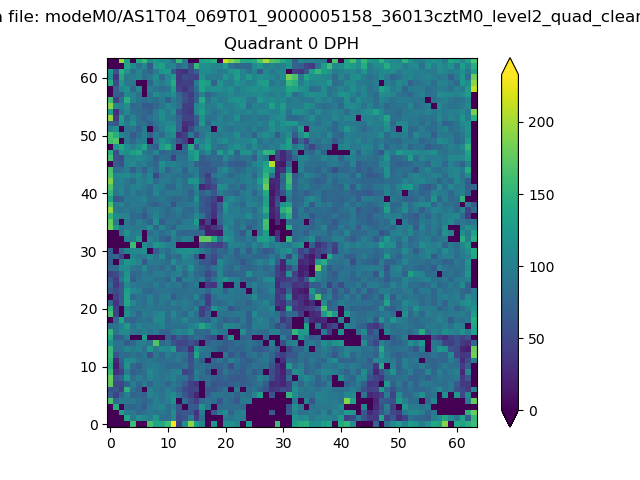 |
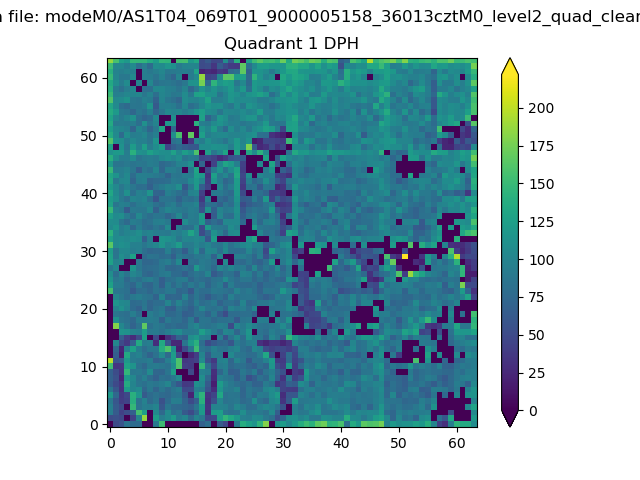 |
Quadrant B |
|---|---|---|---|
| Quadrant D | 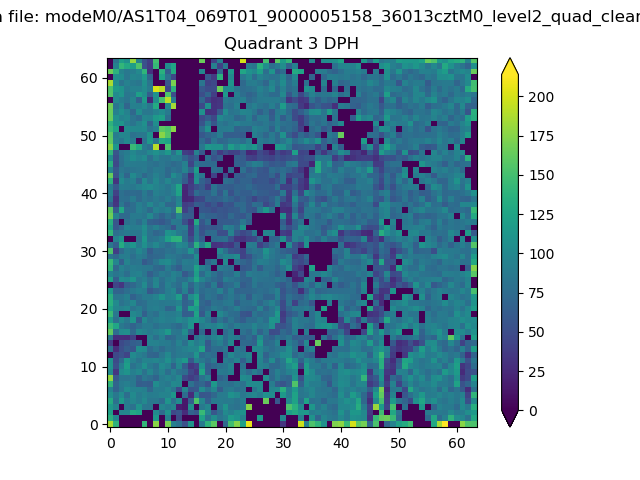 |
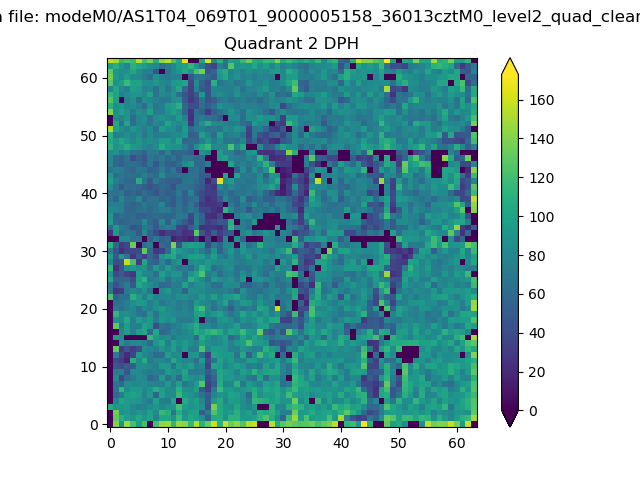 |
Quadrant C |
| Plot type | Count rate plots | Images |
|---|---|---|
| Comparison with Poisson distribution Blue bars denote a histogram of data divided into 1 sec bins. Red curve is a Poisson curve with rate = median count rate of data. |
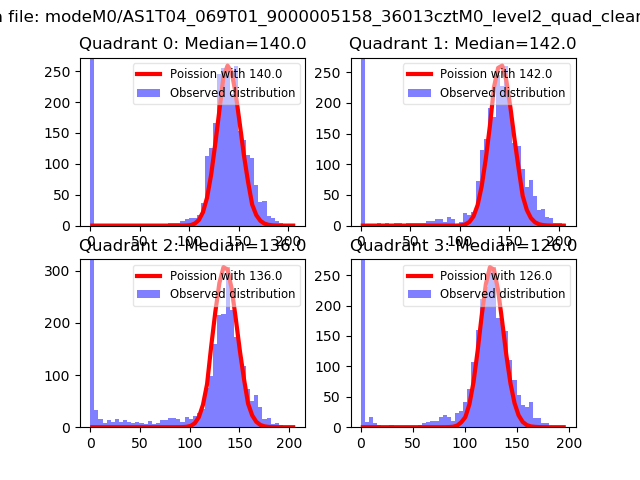 |
 |
| Quadrant-wise count rates Data is divided into 100 sec bins |
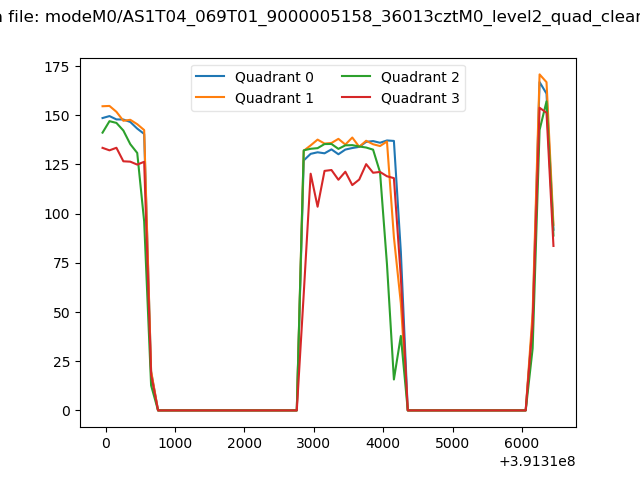 |
|
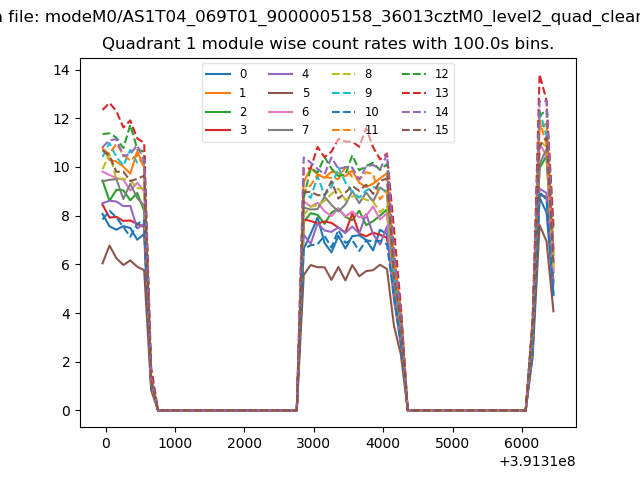
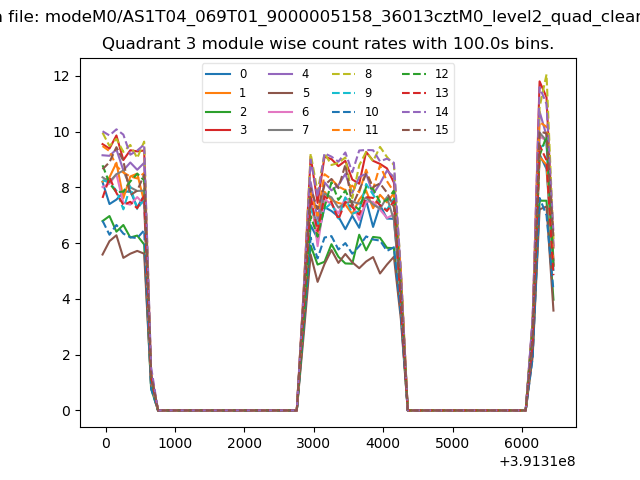
| Module-wise count rates for Quadrant A Data is divided into 100 sec bins |
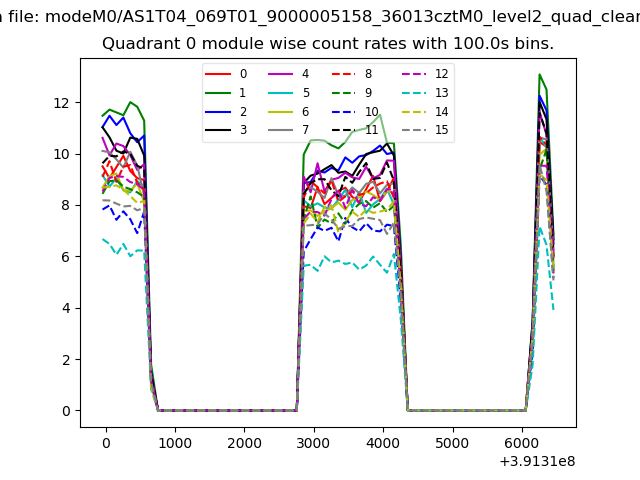 |
 |
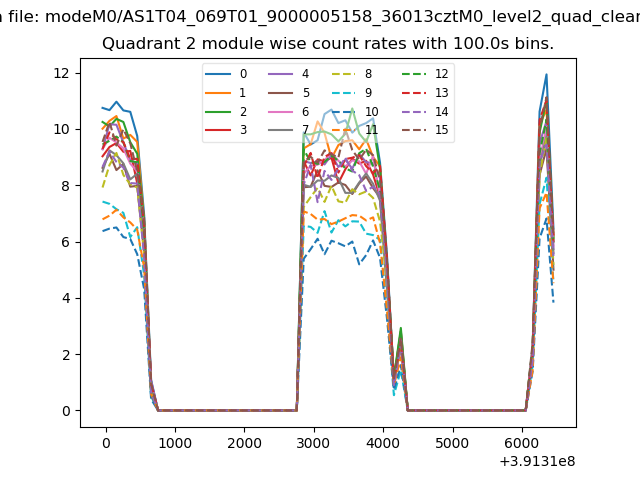
| Module-wise count rates for Quadrant B Data is divided into 100 sec bins |
 |
 |
| Module-wise count rates for Quadrant C Data is divided into 100 sec bins |
 |
 |
| Module-wise count rates for Quadrant D Data is divided into 100 sec bins |
 |
 |
| Parameter | Plot |
|---|---|
| CZT HV Monitor | 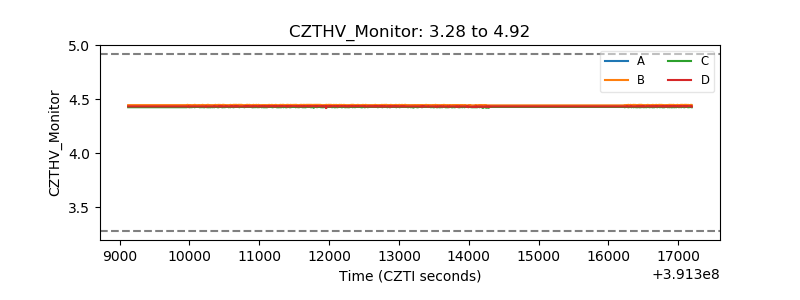 |
| D_VDD | 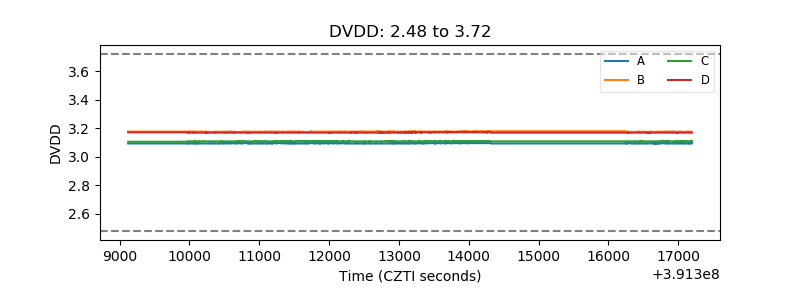 |
| Temperature 1 | 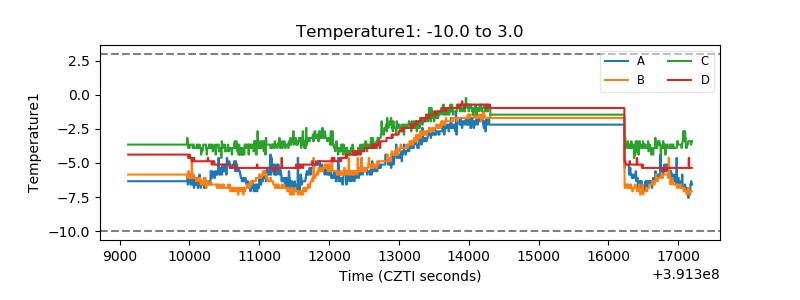 |
| Veto HV Monitor | 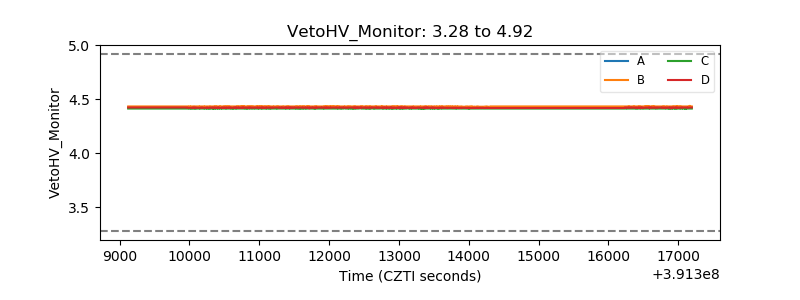 |
| Veto LLD | 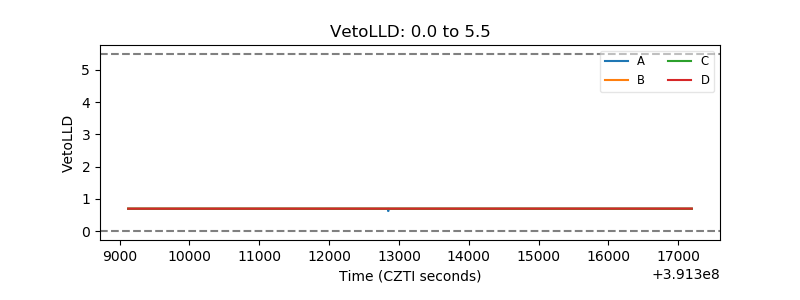 |
| Alpha Counter | 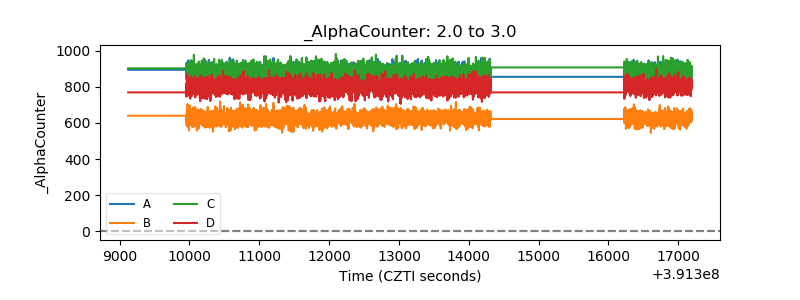 |
| _CPM_Rate | 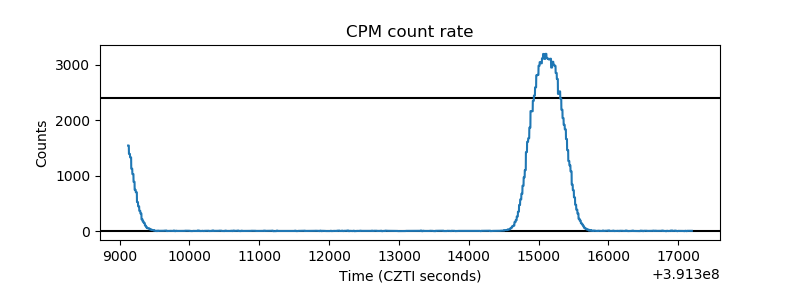 |
| CZT Counter | 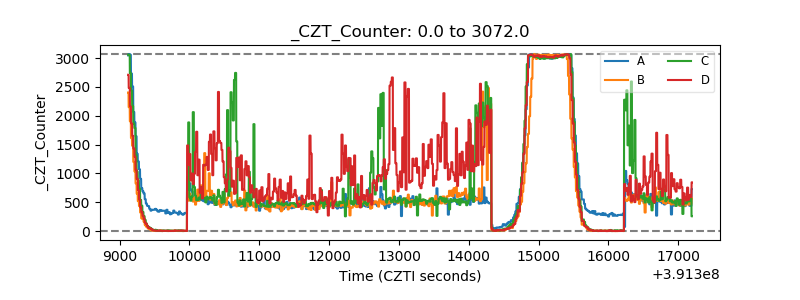 |
| +2.5 Volts monitor | 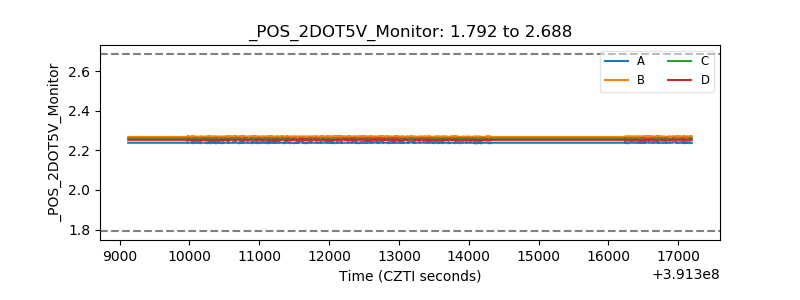 |
| +5 Volts monitor | 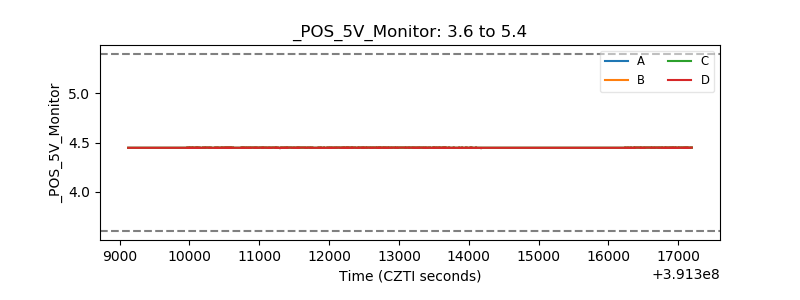 |
| _ROLL_ROT | 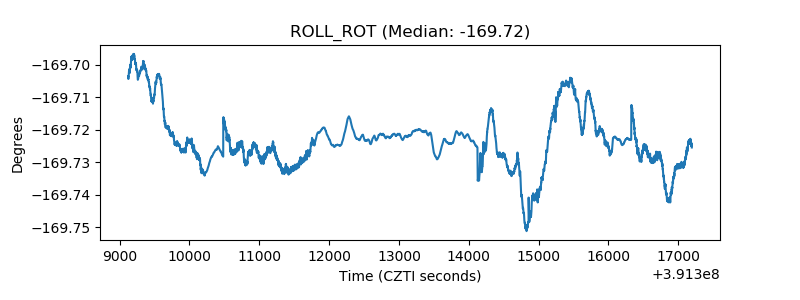 |
| _Roll_DEC | 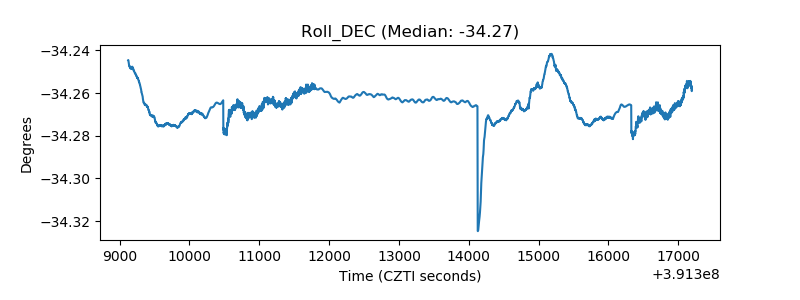 |
| _Roll_RA | 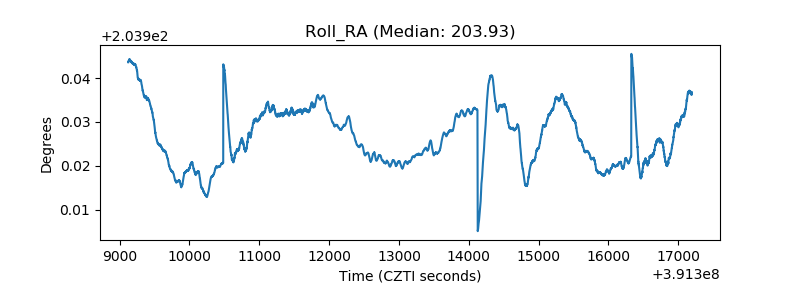 |
| Veto Counter | 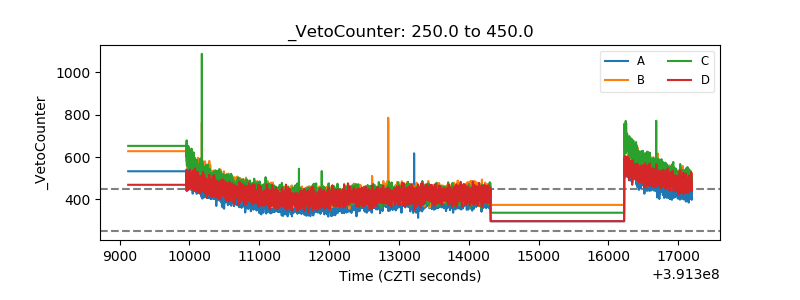 |