| Param | Original file | Final file |
|---|---|---|
| Filename | modeM0/AS1T04_069T01_9000005158_36006cztM0_level2.evt | modeM0/AS1T04_069T01_9000005158_36006cztM0_level2_quad_clean.evt |
| Size (bytes) | 521,544,960 | 79,951,680 |
| Size | 497.4 MB | 76.2 MB |
| Events in quadrant A | 2,865,086 | 526,919 |
| Events in quadrant B | 4,765,964 | 488,300 |
| Events in quadrant C | 3,537,695 | 503,658 |
| Events in quadrant D | 4,222,773 | 486,074 |
| Mode M0 | |||
|---|---|---|---|
| Quadrant | BADHDUFLAG | Total packets | Discarded packets |
| A | 0 | 12282 | 3 |
| B | 0 | 18072 | 2 |
| C | 0 | 14119 | 2 |
| D | 0 | 16358 | 2 |
| Mode M9 | |||
|---|---|---|---|
| Quadrant | BADHDUFLAG | Total packets | Discarded packets |
| A | 0 | 16 | 0 |
| B | 0 | 16 | 0 |
| C | 0 | 16 | 0 |
| D | 0 | 17 | 0 |
| Mode SS | |||
|---|---|---|---|
| Quadrant | BADHDUFLAG | Total packets | Discarded packets |
| A | 0 | 122 | 0 |
| B | 0 | 122 | 0 |
| C | 0 | 122 | 0 |
| D | 0 | 122 | 0 |
| Quadrant | Total seconds | Saturated seconds | Saturation percentage |
|---|---|---|---|
| A | 5946 | 9 | 0.151362% |
| B | 5946 | 569 | 9.569458% |
| C | 5946 | 152 | 2.556340% |
| D | 5946 | 237 | 3.985873% |
Noise dominated data is calculated using 1-second bins in cleaned event files. If a bin has >2000 counts, and if more than 50% of those come from <1% of pixels, then it is considered to be noise-dominated and hence unusable.
| Quadrant | # 1 sec bins | Bins with >0 counts | Bins with >2000 counts | High rate bins dominated by noise | Noise dominated (total time) | Noise dominated (detector-on time) | Marked lightcurve |
|---|---|---|---|---|---|---|---|
| A | 7258 | 5947 | 0 | 0 | 0.00% | 0.00% | 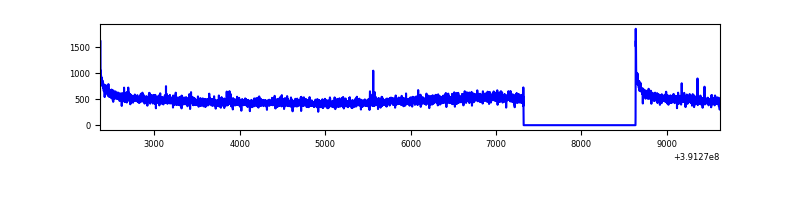 |
| B | 7258 | 5947 | 425 | 425 | 5.86% | 7.15% | 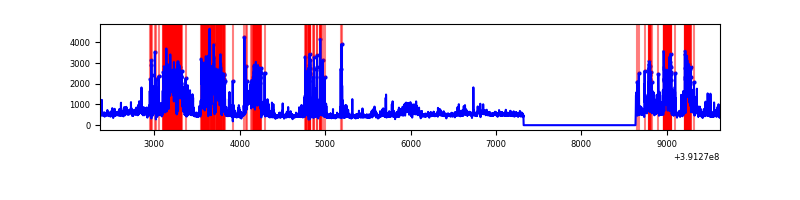 |
| C | 7258 | 5947 | 121 | 121 | 1.67% | 2.03% | 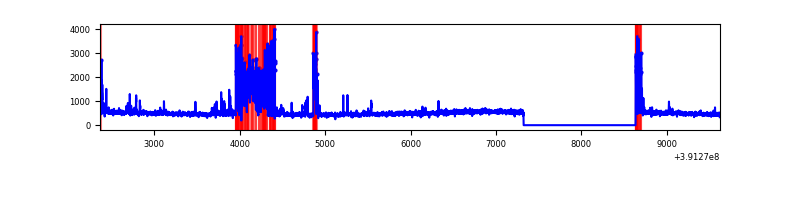 |
| D | 7258 | 5947 | 260 | 260 | 3.58% | 4.37% | 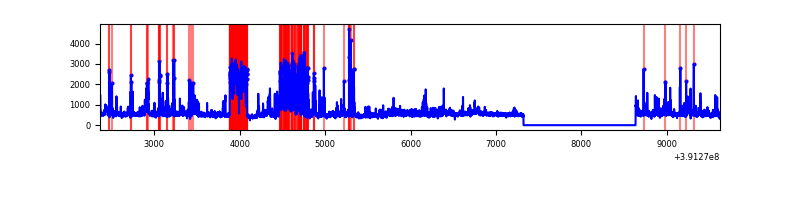 |
Top three noisy pixels from each quadrant. If the there are fewer than three noisy pixels in the level2.evt file, extra rows are filled as -1
| Pixel properties | Quadrant properties | ||||||
|---|---|---|---|---|---|---|---|
| Quadrant | DetID | PixID | Counts | Sigma | Mean | Median | Sigma |
| A | 10 | 83 | 180393 | 1272.79 | 691 | 677 | 141.2 |
| A | 13 | 254 | 9195 | 60.33 | 691 | 677 | 141.2 |
| A | 3 | 137 | 7191 | 46.13 | 691 | 677 | 141.2 |
| B | 5 | 172 | 1688192 | 13187.27 | 658 | 640 | 128.0 |
| B | 0 | 190 | 264197 | 2059.55 | 658 | 640 | 128.0 |
| B | 0 | 213 | 77210 | 598.35 | 658 | 640 | 128.0 |
| C | 9 | 187 | 591117 | 3802.45 | 658 | 661 | 155.3 |
| C | 15 | 214 | 248471 | 1595.86 | 658 | 661 | 155.3 |
| C | 0 | 10 | 99486 | 636.42 | 658 | 661 | 155.3 |
| D | 12 | 227 | 475847 | 2934.24 | 662 | 643 | 162.0 |
| D | 12 | 6 | 369298 | 2276.33 | 662 | 643 | 162.0 |
| D | 12 | 235 | 331398 | 2042.31 | 662 | 643 | 162.0 |
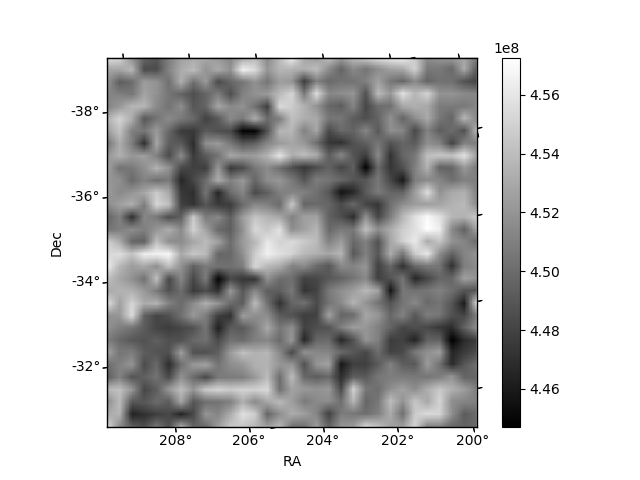
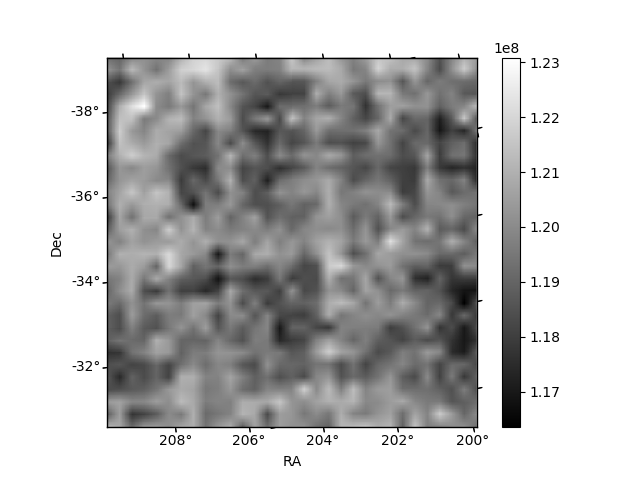
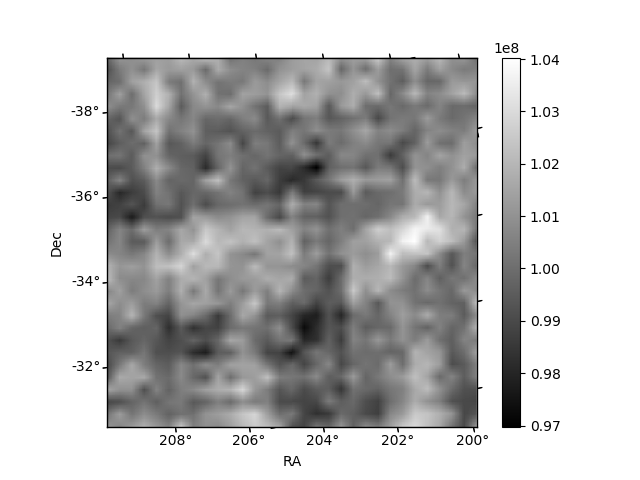
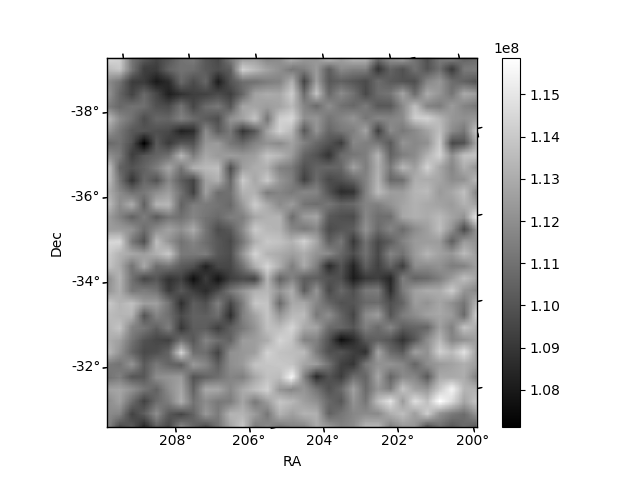
Histogram calculated using DETX and DETY for each event in the final _common_clean file
| Quadrant A | 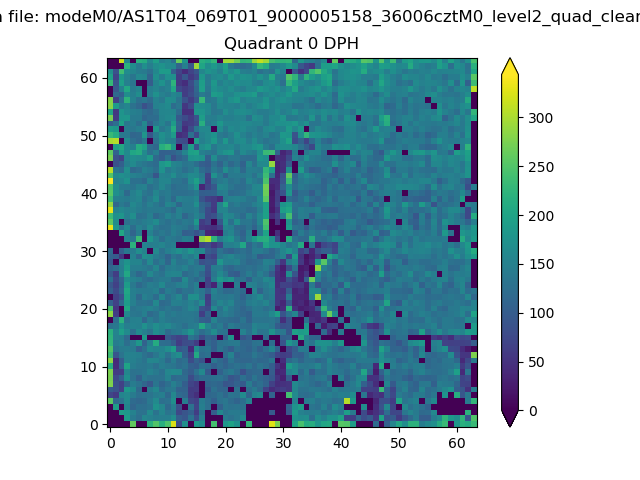 |
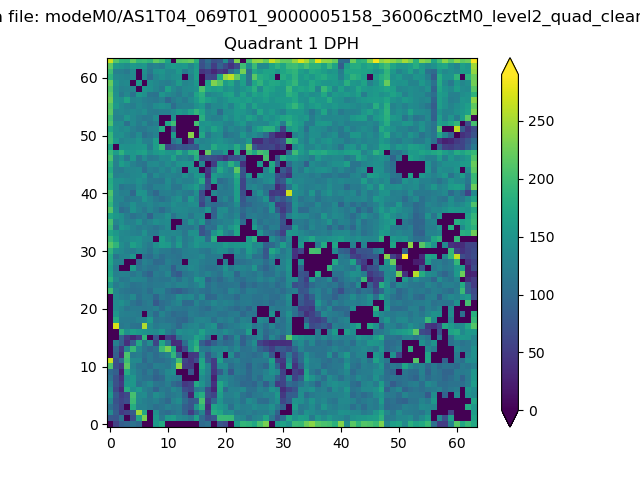 |
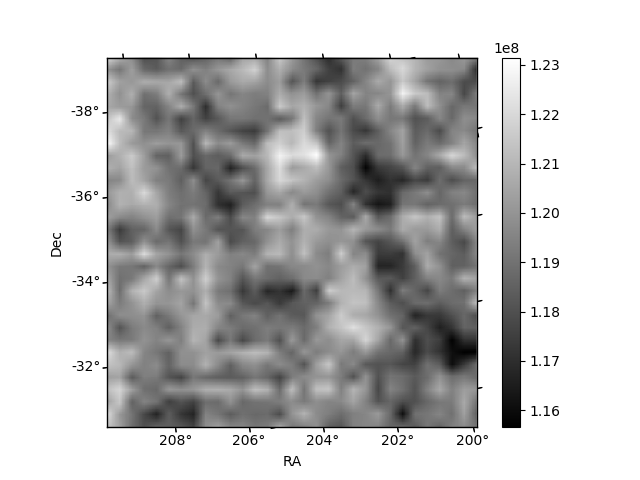
Quadrant B |
|---|---|---|---|
| Quadrant D | 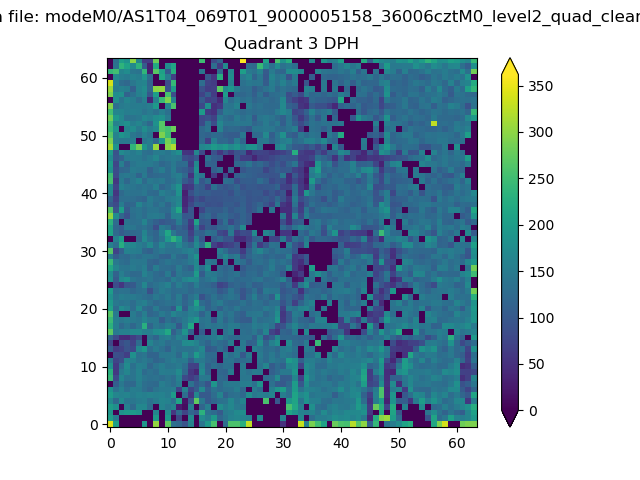 |
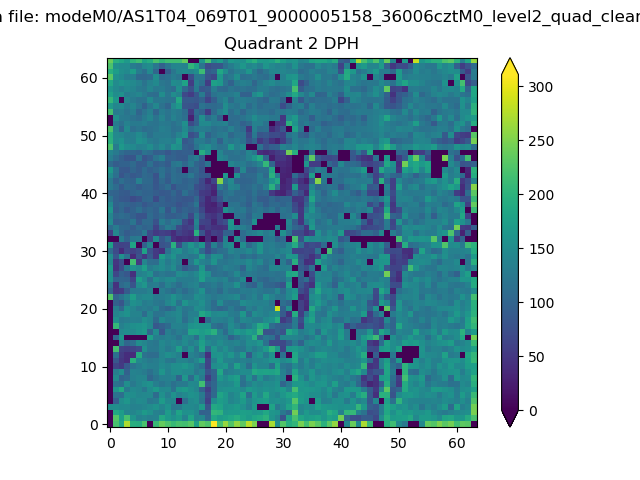 |
Quadrant C |
| Plot type | Count rate plots | Images |
|---|---|---|
| Comparison with Poisson distribution Blue bars denote a histogram of data divided into 1 sec bins. Red curve is a Poisson curve with rate = median count rate of data. |
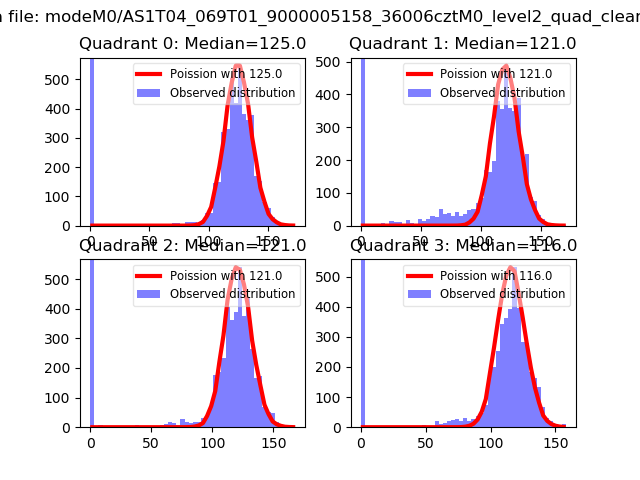 |
 |
| Quadrant-wise count rates Data is divided into 100 sec bins |
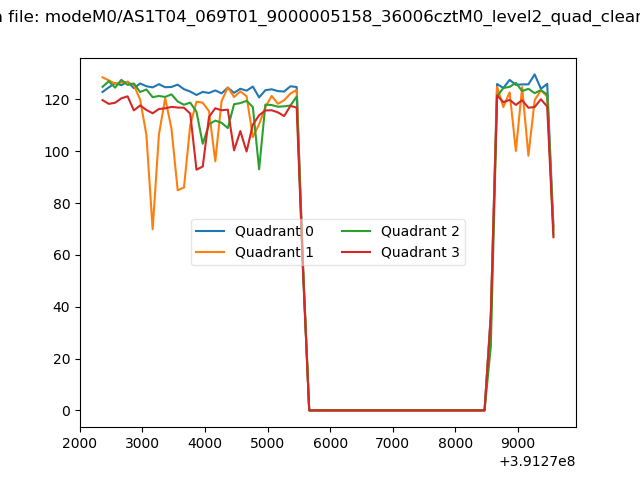 |
|
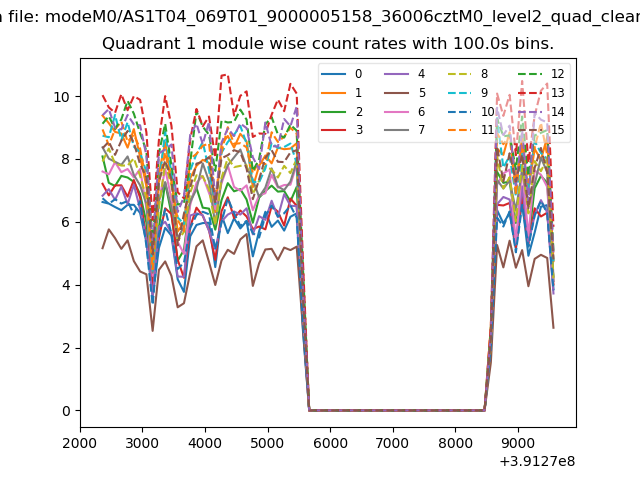
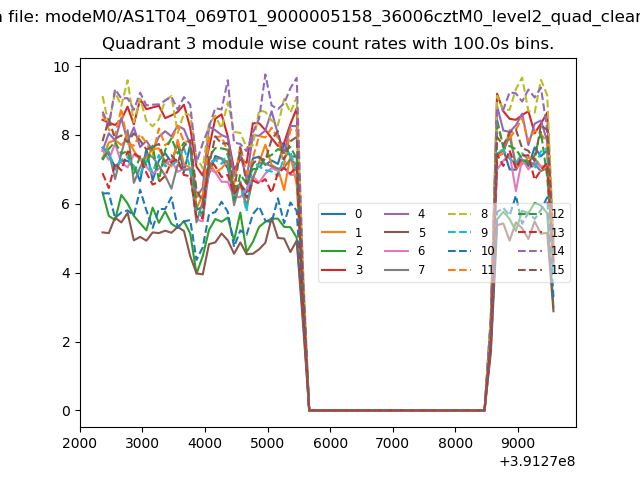
| Module-wise count rates for Quadrant A Data is divided into 100 sec bins |
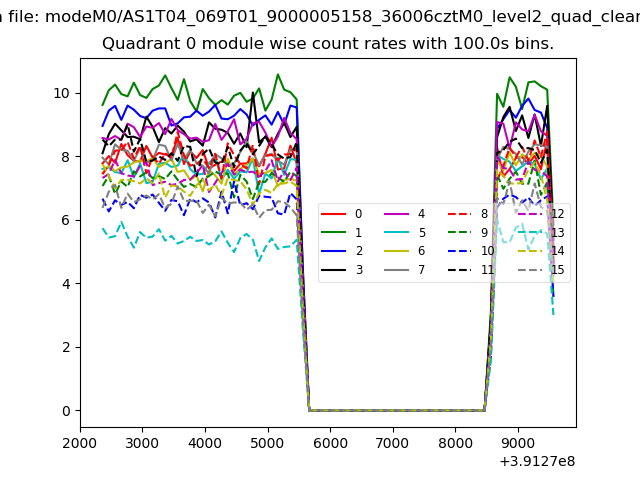 |
 |
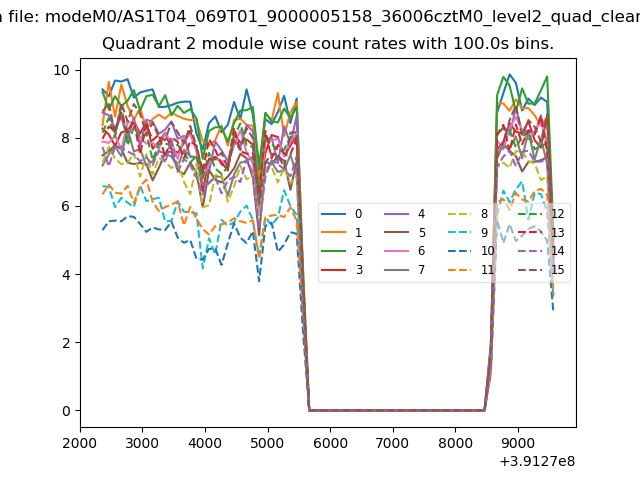
| Module-wise count rates for Quadrant B Data is divided into 100 sec bins |
 |
 |
| Module-wise count rates for Quadrant C Data is divided into 100 sec bins |
 |
 |
| Module-wise count rates for Quadrant D Data is divided into 100 sec bins |
 |
 |
| Parameter | Plot |
|---|---|
| CZT HV Monitor | 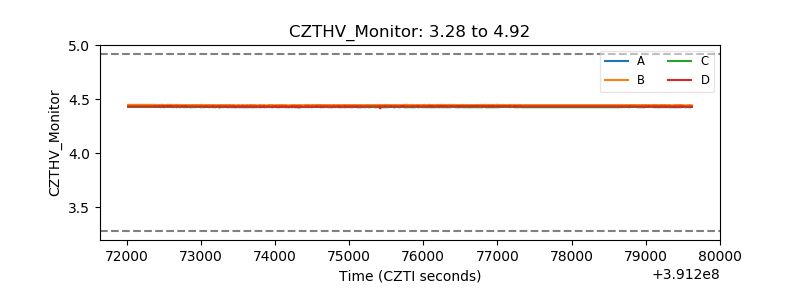 |
| D_VDD | 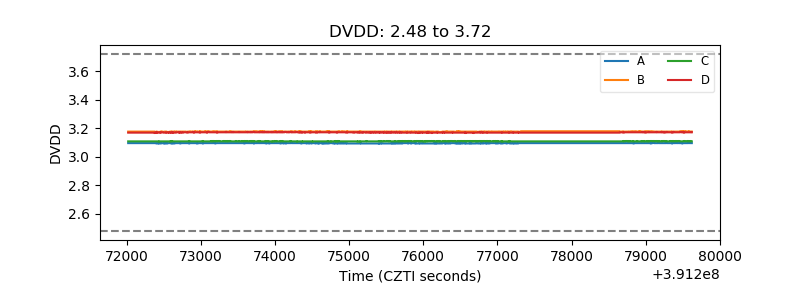 |
| Temperature 1 | 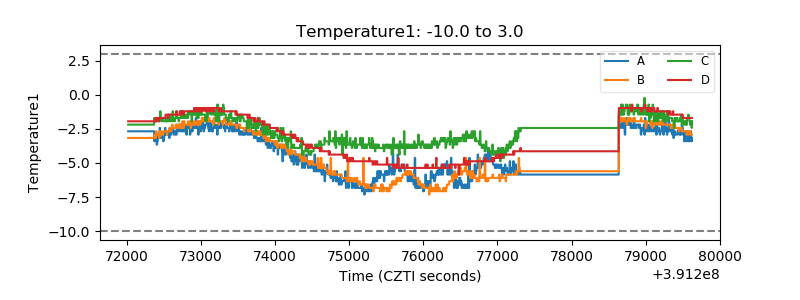 |
| Veto HV Monitor | 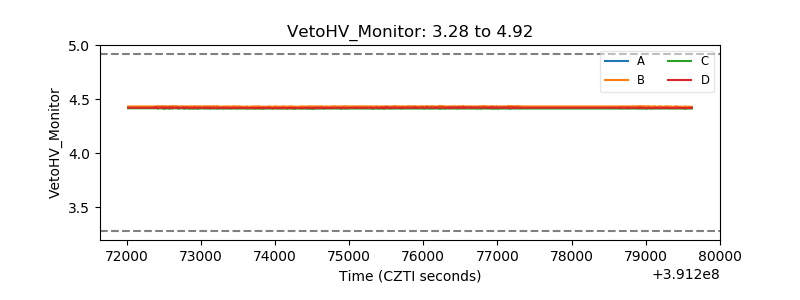 |
| Veto LLD | 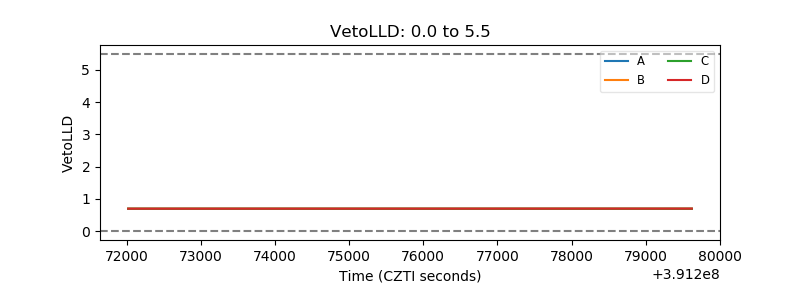 |
| Alpha Counter | 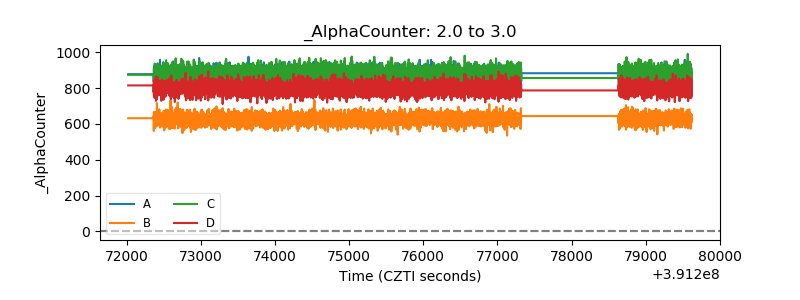 |
| _CPM_Rate | 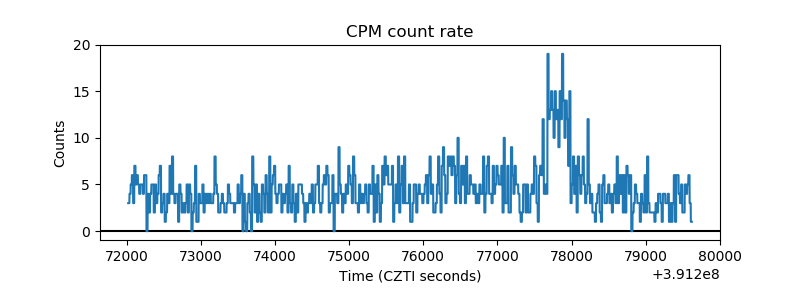 |
| CZT Counter | 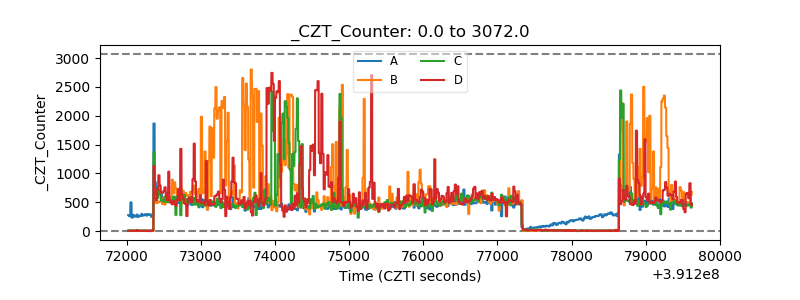 |
| +2.5 Volts monitor | 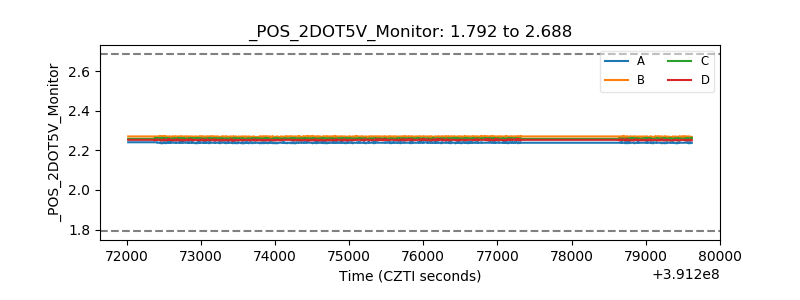 |
| +5 Volts monitor | 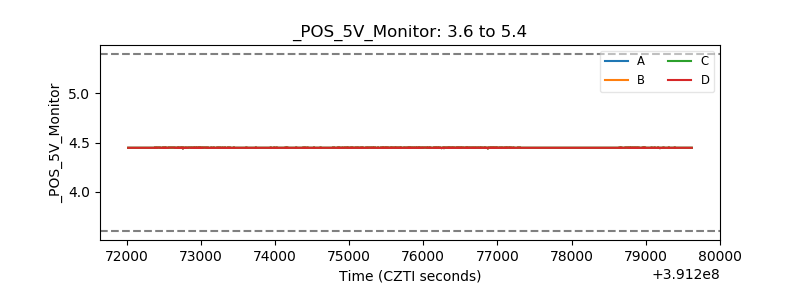 |
| _ROLL_ROT | 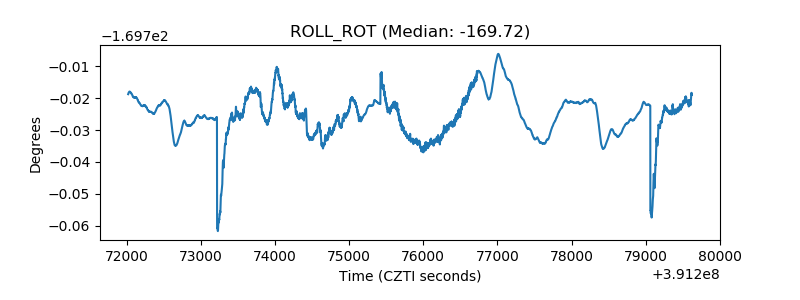 |
| _Roll_DEC | 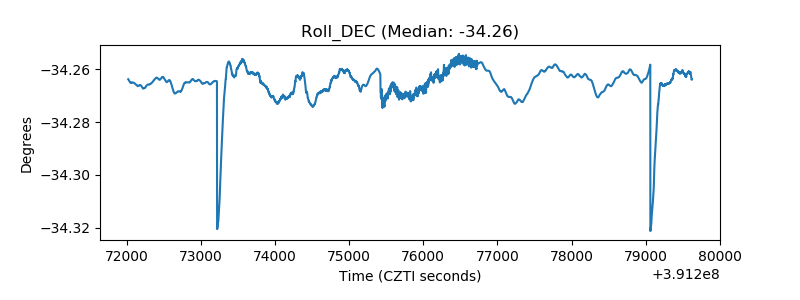 |
| _Roll_RA | 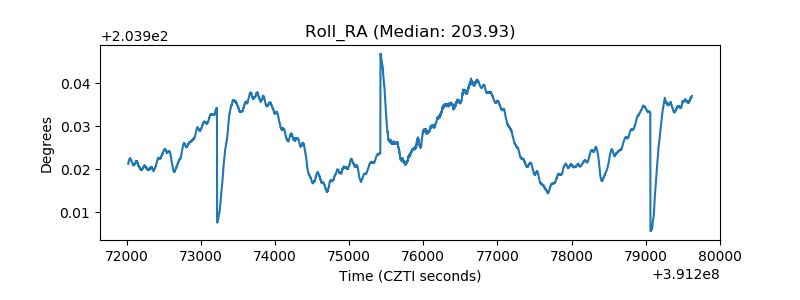 |
| Veto Counter | 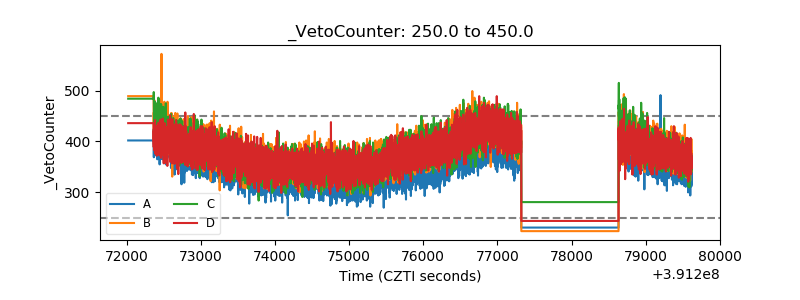 |