| Param | Original file | Final file |
|---|---|---|
| Filename | modeM0/AS1T04_069T01_9000005158_36005cztM0_level2.evt | modeM0/AS1T04_069T01_9000005158_36005cztM0_level2_quad_clean.evt |
| Size (bytes) | 506,597,760 | 85,106,880 |
| Size | 483.1 MB | 81.2 MB |
| Events in quadrant A | 2,868,269 | 561,433 |
| Events in quadrant B | 3,945,444 | 541,877 |
| Events in quadrant C | 3,472,011 | 541,463 |
| Events in quadrant D | 4,655,395 | 518,879 |
| Mode M0 | |||
|---|---|---|---|
| Quadrant | BADHDUFLAG | Total packets | Discarded packets |
| A | 0 | 12199 | 3 |
| B | 0 | 15503 | 2 |
| C | 0 | 13906 | 4 |
| D | 0 | 17674 | 2 |
| Mode M9 | |||
|---|---|---|---|
| Quadrant | BADHDUFLAG | Total packets | Discarded packets |
| A | 0 | 30 | 0 |
| B | 0 | 30 | 0 |
| C | 0 | 30 | 0 |
| D | 0 | 30 | 0 |
| Mode SS | |||
|---|---|---|---|
| Quadrant | BADHDUFLAG | Total packets | Discarded packets |
| A | 0 | 122 | 0 |
| B | 0 | 122 | 0 |
| C | 0 | 122 | 0 |
| D | 0 | 122 | 0 |
| Quadrant | Total seconds | Saturated seconds | Saturation percentage |
|---|---|---|---|
| A | 5918 | 12 | 0.202771% |
| B | 5918 | 306 | 5.170666% |
| C | 5917 | 133 | 2.247761% |
| D | 5918 | 223 | 3.768165% |
Noise dominated data is calculated using 1-second bins in cleaned event files. If a bin has >2000 counts, and if more than 50% of those come from <1% of pixels, then it is considered to be noise-dominated and hence unusable.
| Quadrant | # 1 sec bins | Bins with >0 counts | Bins with >2000 counts | High rate bins dominated by noise | Noise dominated (total time) | Noise dominated (detector-on time) | Marked lightcurve |
|---|---|---|---|---|---|---|---|
| A | 8872 | 5920 | 0 | 0 | 0.00% | 0.00% | 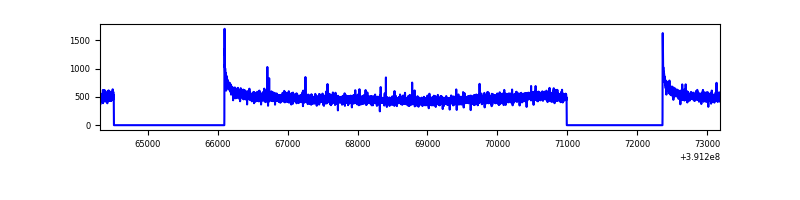 |
| B | 8872 | 5920 | 218 | 218 | 2.46% | 3.68% | 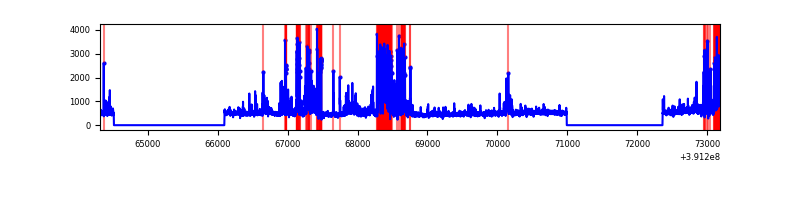 |
| C | 8872 | 5920 | 96 | 96 | 1.08% | 1.62% | 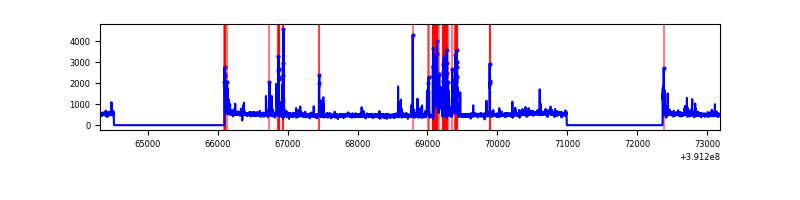 |
| D | 8872 | 5920 | 267 | 267 | 3.01% | 4.51% | 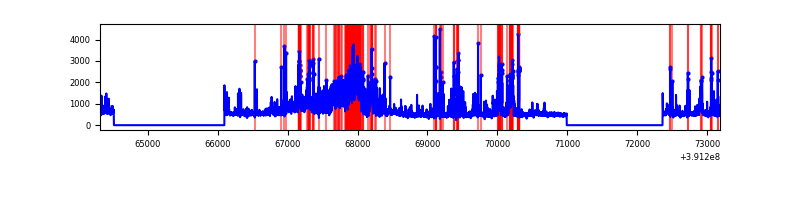 |
Top three noisy pixels from each quadrant. If the there are fewer than three noisy pixels in the level2.evt file, extra rows are filled as -1
| Pixel properties | Quadrant properties | ||||||
|---|---|---|---|---|---|---|---|
| Quadrant | DetID | PixID | Counts | Sigma | Mean | Median | Sigma |
| A | 10 | 83 | 181434 | 1269.5 | 693 | 679 | 142.4 |
| A | 13 | 254 | 10790 | 71.01 | 693 | 679 | 142.4 |
| A | 3 | 137 | 7314 | 46.6 | 693 | 679 | 142.4 |
| B | 5 | 172 | 976850 | 7472.96 | 672 | 654 | 130.6 |
| B | 0 | 190 | 105673 | 803.94 | 672 | 654 | 130.6 |
| B | 5 | 255 | 74044 | 561.81 | 672 | 654 | 130.6 |
| C | 9 | 187 | 484487 | 3125.32 | 659 | 663 | 154.8 |
| C | 15 | 214 | 246112 | 1585.51 | 659 | 663 | 154.8 |
| C | 0 | 207 | 63941 | 408.75 | 659 | 663 | 154.8 |
| D | 12 | 235 | 1070084 | 6633.11 | 660 | 641 | 161.2 |
| D | 12 | 17 | 227010 | 1404.03 | 660 | 641 | 161.2 |
| D | 13 | 249 | 197281 | 1219.64 | 660 | 641 | 161.2 |
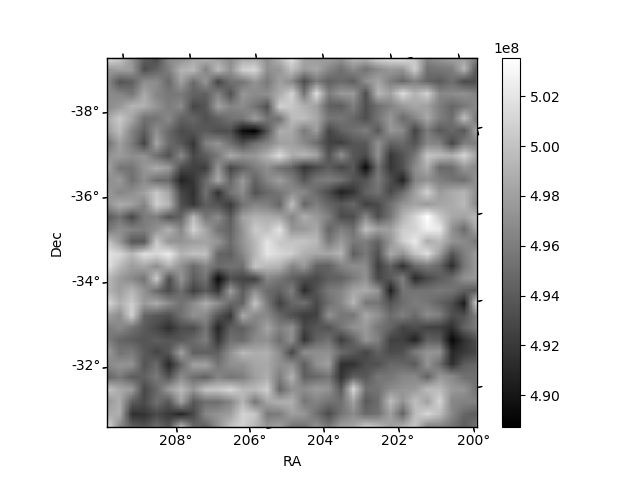
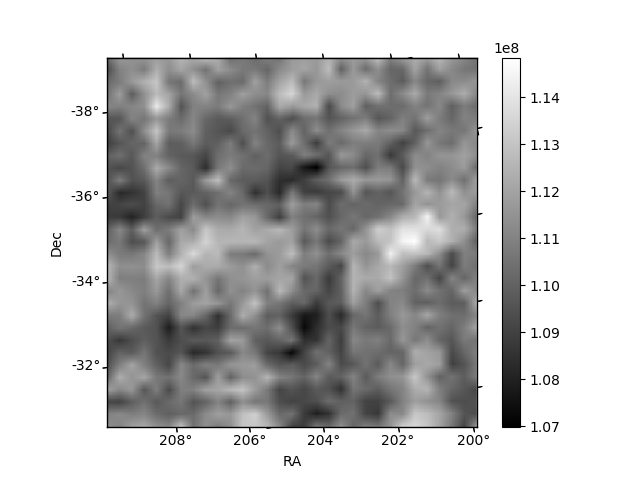
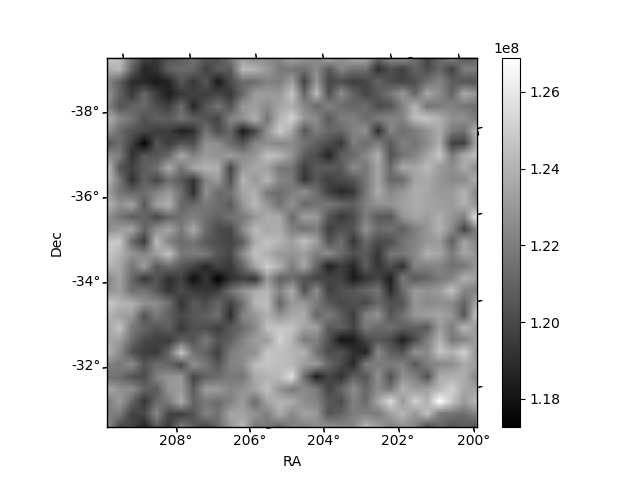
Histogram calculated using DETX and DETY for each event in the final _common_clean file
| Quadrant A | 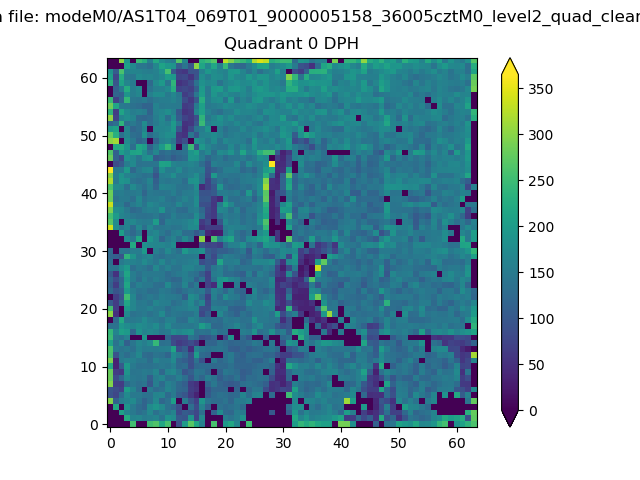 |
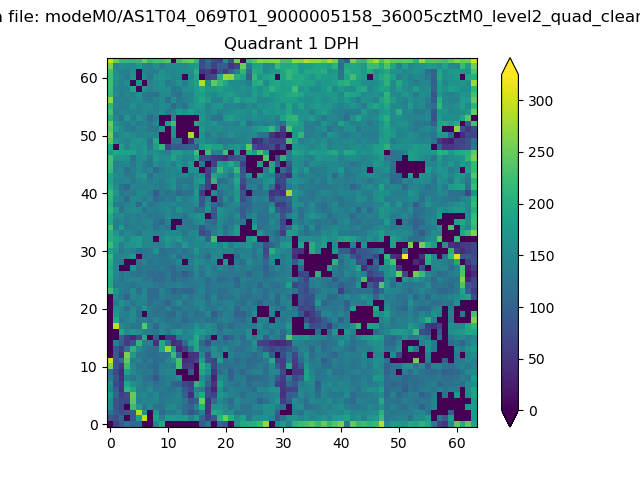 |
Quadrant B |
|---|---|---|---|
| Quadrant D | 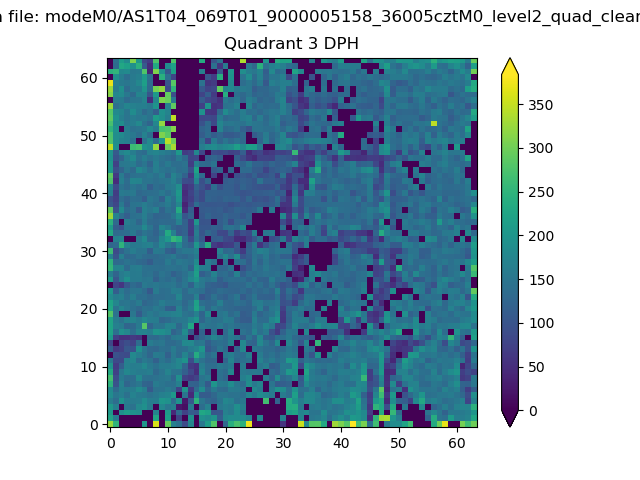 |
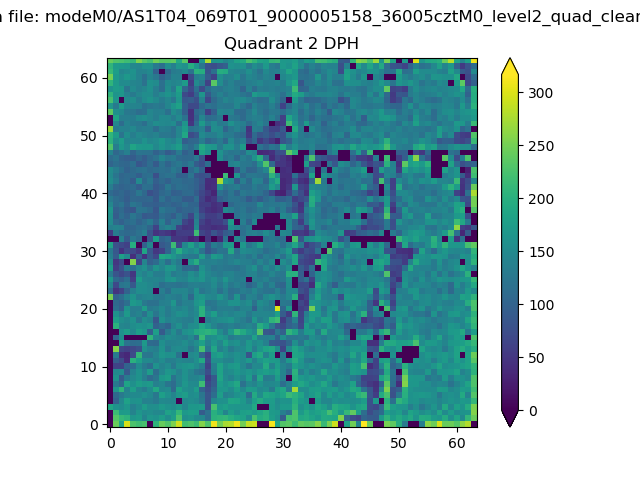 |
Quadrant C |
| Plot type | Count rate plots | Images |
|---|---|---|
| Comparison with Poisson distribution Blue bars denote a histogram of data divided into 1 sec bins. Red curve is a Poisson curve with rate = median count rate of data. |
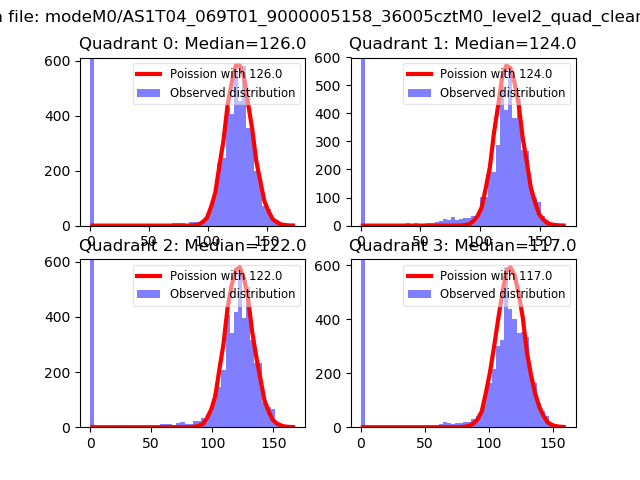 |
 |
| Quadrant-wise count rates Data is divided into 100 sec bins |
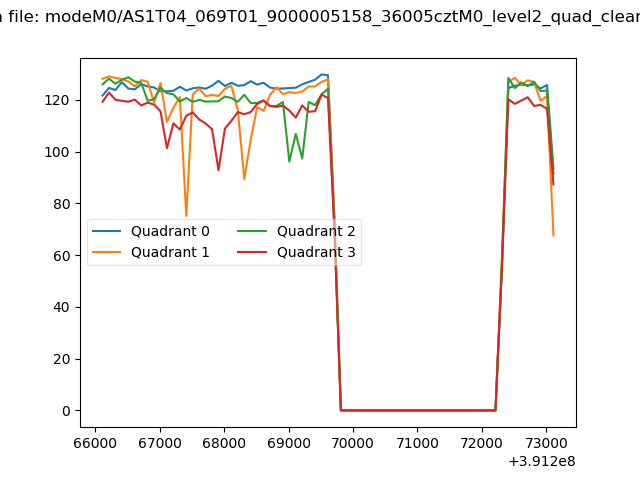 |
|
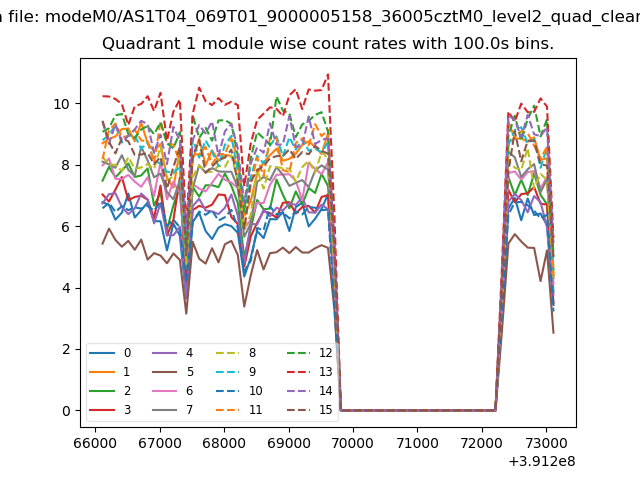
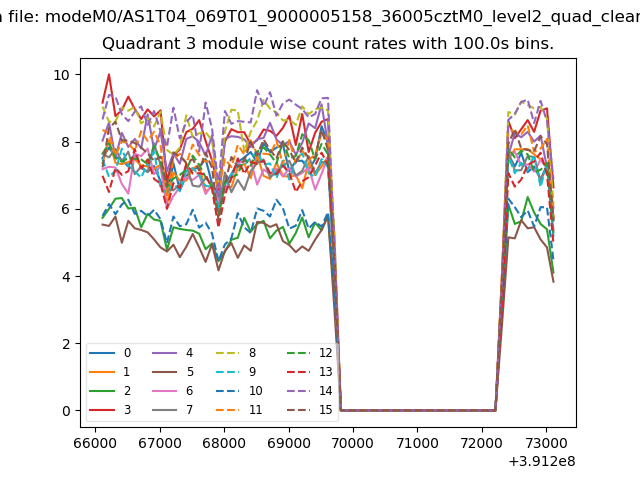
| Module-wise count rates for Quadrant A Data is divided into 100 sec bins |
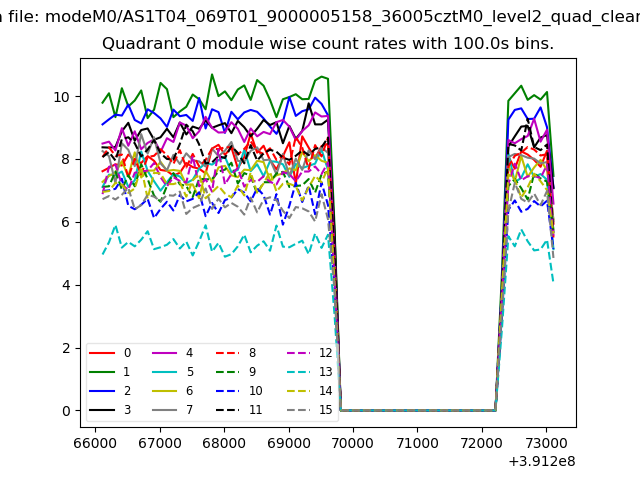 |
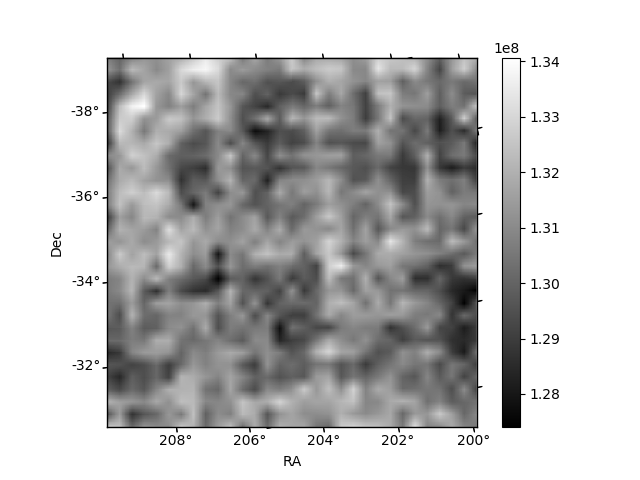 |
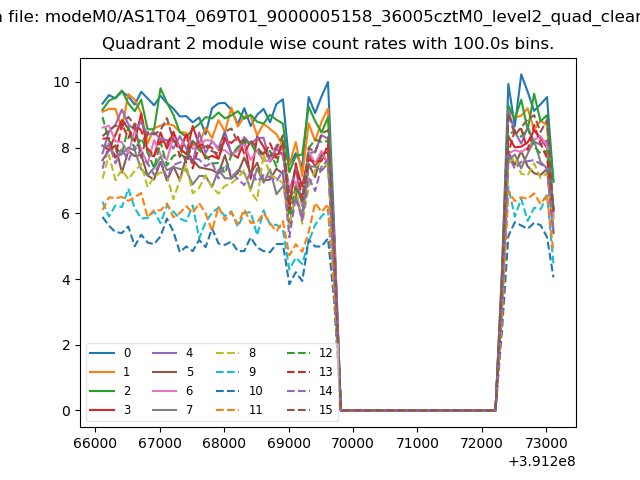
| Module-wise count rates for Quadrant B Data is divided into 100 sec bins |
 |
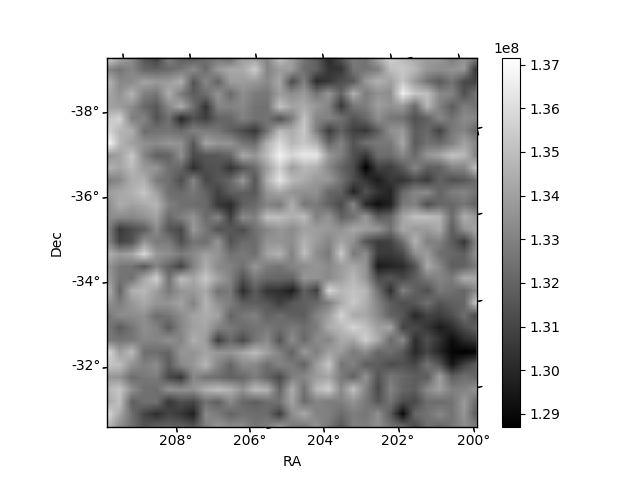 |
| Module-wise count rates for Quadrant C Data is divided into 100 sec bins |
 |
 |
| Module-wise count rates for Quadrant D Data is divided into 100 sec bins |
 |
 |
| Parameter | Plot |
|---|---|
| CZT HV Monitor | 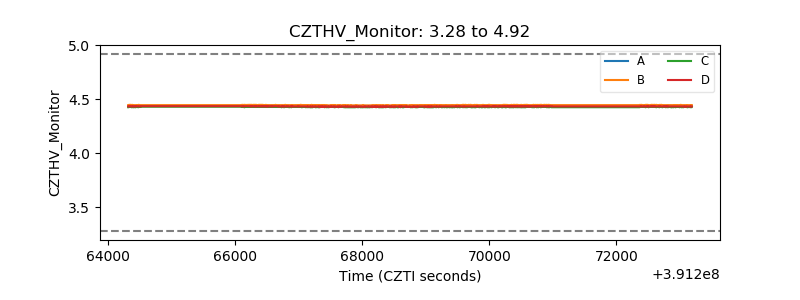 |
| D_VDD | 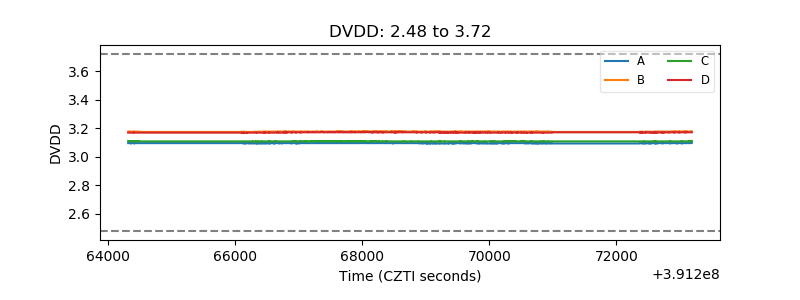 |
| Temperature 1 | 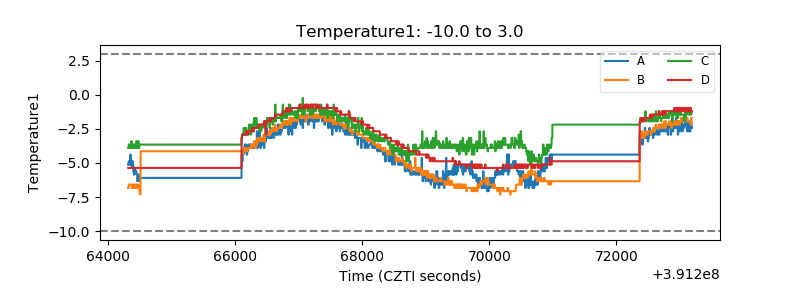 |
| Veto HV Monitor | 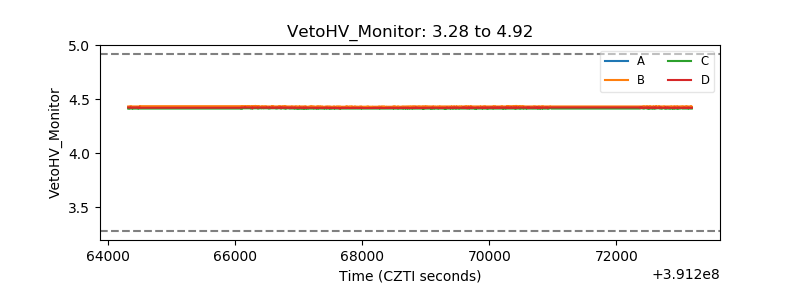 |
| Veto LLD | 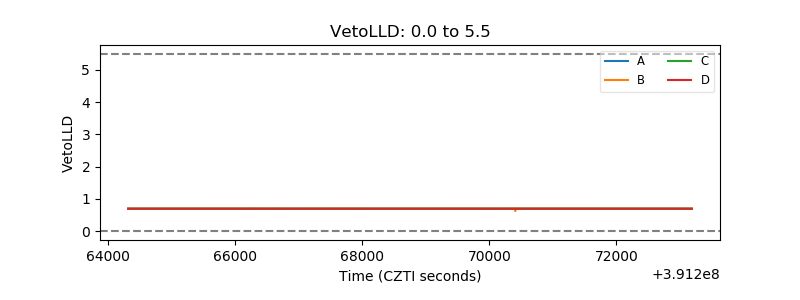 |
| Alpha Counter | 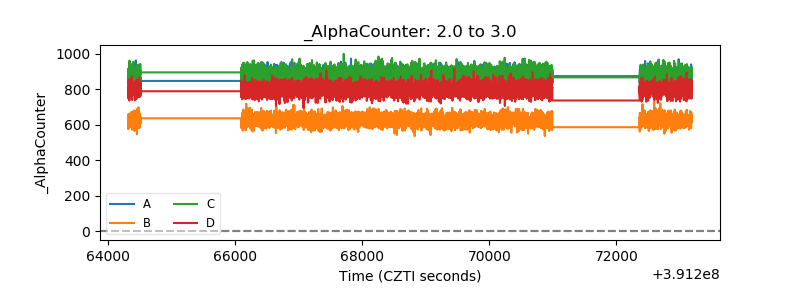 |
| _CPM_Rate | 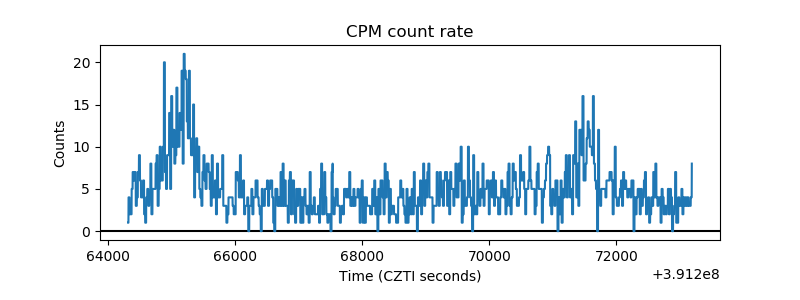 |
| CZT Counter | 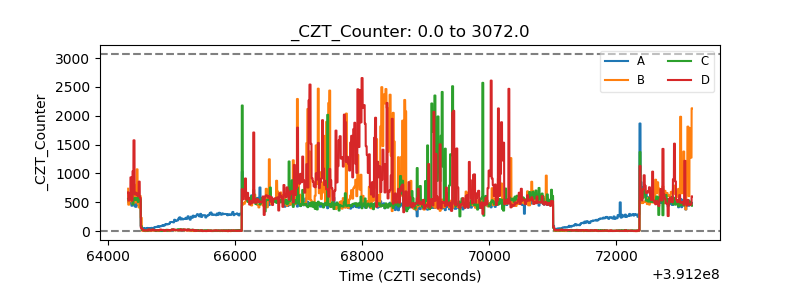 |
| +2.5 Volts monitor | 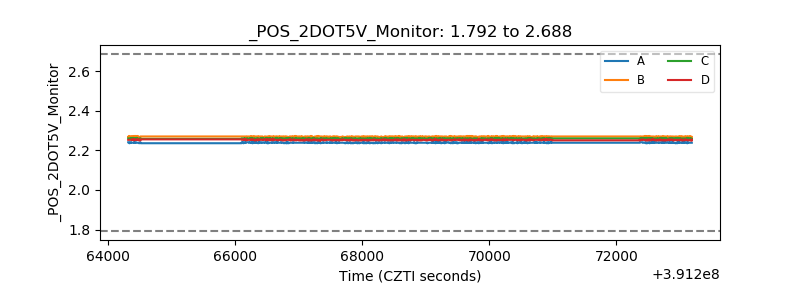 |
| +5 Volts monitor | 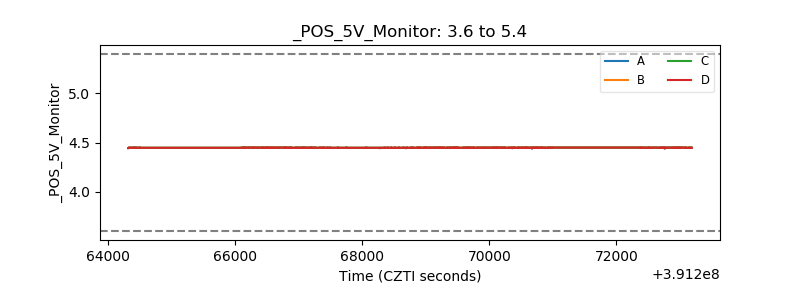 |
| _ROLL_ROT | 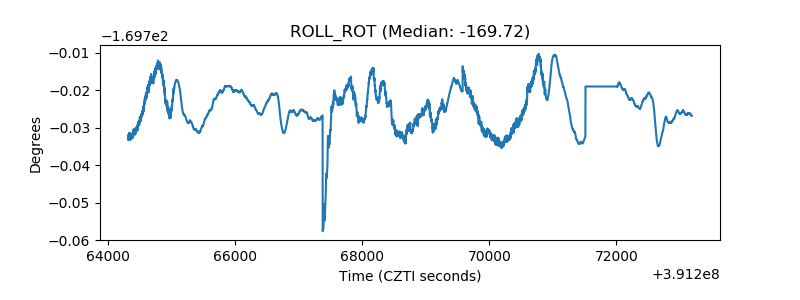 |
| _Roll_DEC | 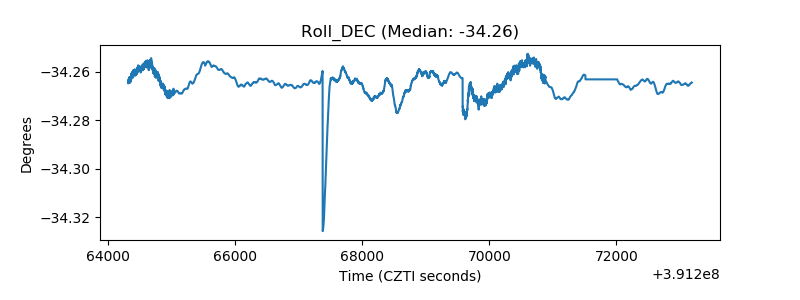 |
| _Roll_RA | 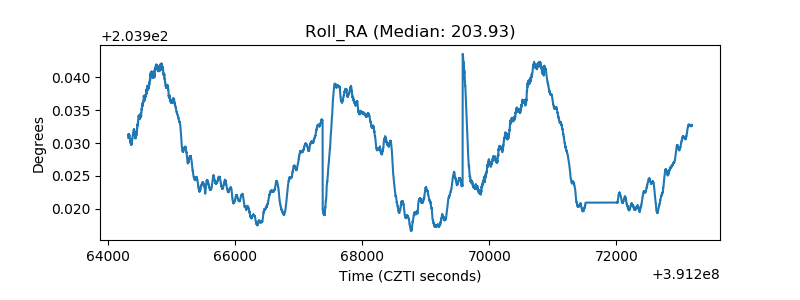 |
| Veto Counter | 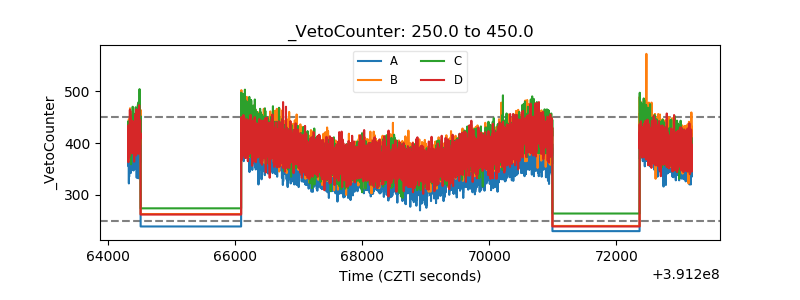 |