| Param | Original file | Final file |
|---|---|---|
| Filename | modeM0/AS1T04_069T01_9000005158_36003cztM0_level2.evt | modeM0/AS1T04_069T01_9000005158_36003cztM0_level2_quad_clean.evt |
| Size (bytes) | 407,295,360 | 75,790,080 |
| Size | 388.4 MB | 72.3 MB |
| Events in quadrant A | 2,537,090 | 499,122 |
| Events in quadrant B | 2,997,481 | 493,765 |
| Events in quadrant C | 3,110,175 | 478,487 |
| Events in quadrant D | 3,344,214 | 466,869 |
| Mode M0 | |||
|---|---|---|---|
| Quadrant | BADHDUFLAG | Total packets | Discarded packets |
| A | 0 | 10585 | 3 |
| B | 0 | 12040 | 2 |
| C | 0 | 12182 | 2 |
| D | 0 | 13130 | 2 |
| Mode M9 | |||
|---|---|---|---|
| Quadrant | BADHDUFLAG | Total packets | Discarded packets |
| A | 0 | 38 | 0 |
| B | 0 | 38 | 0 |
| C | 0 | 38 | 0 |
| D | 0 | 38 | 0 |
| Mode SS | |||
|---|---|---|---|
| Quadrant | BADHDUFLAG | Total packets | Discarded packets |
| A | 0 | 102 | 0 |
| B | 0 | 102 | 0 |
| C | 0 | 102 | 0 |
| D | 0 | 102 | 0 |
| Quadrant | Total seconds | Saturated seconds | Saturation percentage |
|---|---|---|---|
| A | 5096 | 11 | 0.215856% |
| B | 5096 | 92 | 1.805338% |
| C | 5096 | 184 | 3.610675% |
| D | 5096 | 82 | 1.609105% |
Noise dominated data is calculated using 1-second bins in cleaned event files. If a bin has >2000 counts, and if more than 50% of those come from <1% of pixels, then it is considered to be noise-dominated and hence unusable.
| Quadrant | # 1 sec bins | Bins with >0 counts | Bins with >2000 counts | High rate bins dominated by noise | Noise dominated (total time) | Noise dominated (detector-on time) | Marked lightcurve |
|---|---|---|---|---|---|---|---|
| A | 7040 | 5097 | 1 | 1 | 0.01% | 0.02% | 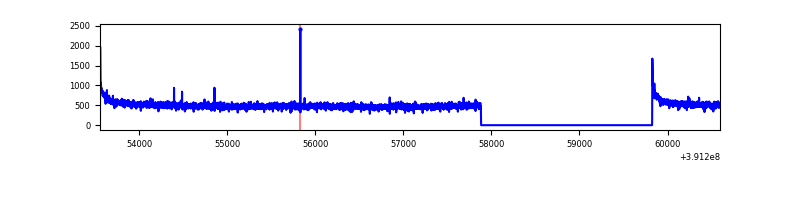 |
| B | 7040 | 5097 | 56 | 56 | 0.80% | 1.10% | 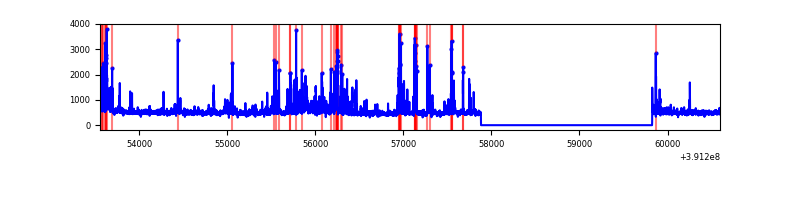 |
| C | 7040 | 5097 | 159 | 159 | 2.26% | 3.12% | 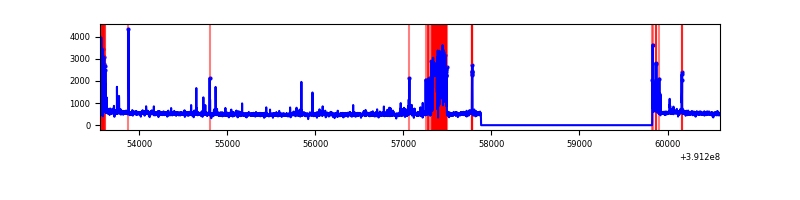 |
| D | 7040 | 5097 | 90 | 90 | 1.28% | 1.77% | 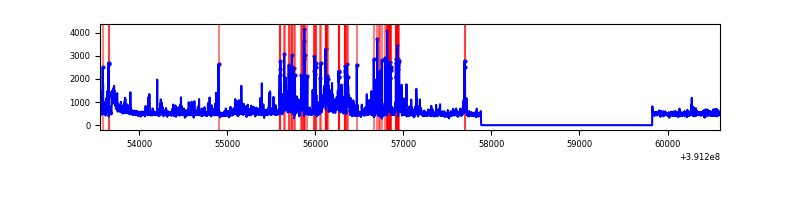 |
Top three noisy pixels from each quadrant. If the there are fewer than three noisy pixels in the level2.evt file, extra rows are filled as -1
| Pixel properties | Quadrant properties | ||||||
|---|---|---|---|---|---|---|---|
| Quadrant | DetID | PixID | Counts | Sigma | Mean | Median | Sigma |
| A | 10 | 83 | 166336 | 1354.37 | 610 | 599 | 122.4 |
| A | 13 | 254 | 8452 | 64.17 | 610 | 599 | 122.4 |
| A | 3 | 137 | 6169 | 45.52 | 610 | 599 | 122.4 |
| B | 5 | 172 | 207901 | 1797.62 | 598 | 582 | 115.3 |
| B | 5 | 255 | 178746 | 1544.82 | 598 | 582 | 115.3 |
| B | 15 | 32 | 110638 | 954.27 | 598 | 582 | 115.3 |
| C | 9 | 187 | 365200 | 2729.6 | 578 | 583 | 133.6 |
| C | 15 | 214 | 214929 | 1604.64 | 578 | 583 | 133.6 |
| C | 0 | 10 | 129535 | 965.36 | 578 | 583 | 133.6 |
| D | 10 | 118 | 287722 | 1979.95 | 587 | 569 | 145.0 |
| D | 12 | 235 | 262592 | 1806.67 | 587 | 569 | 145.0 |
| D | 12 | 227 | 115545 | 792.77 | 587 | 569 | 145.0 |
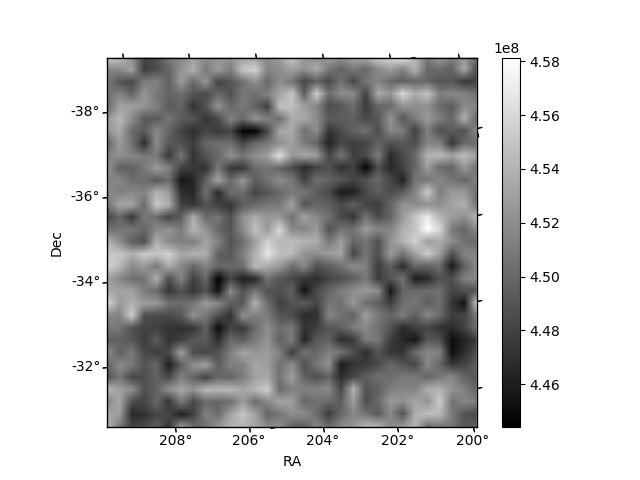
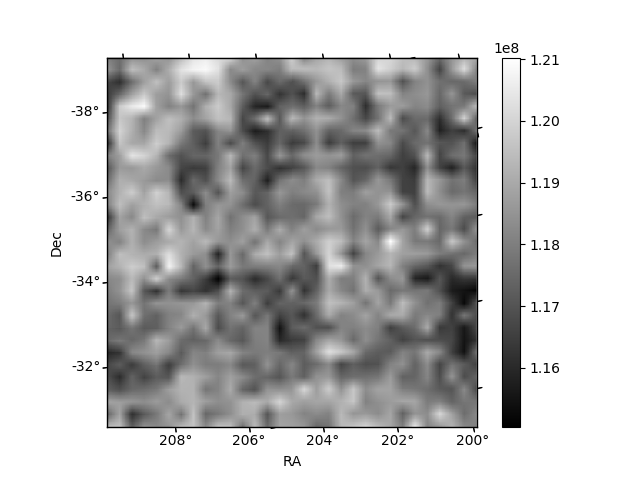
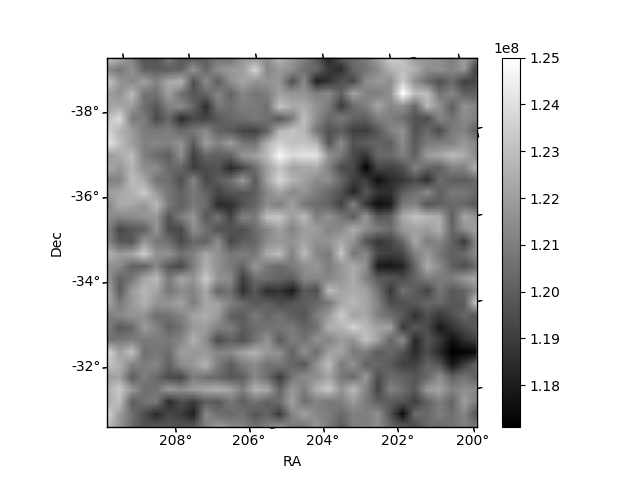
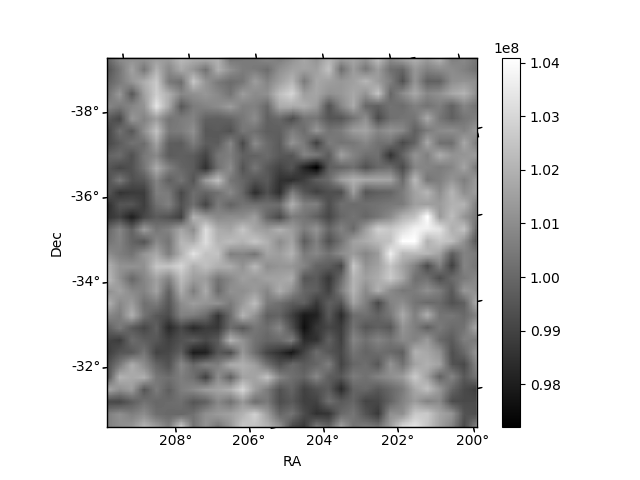
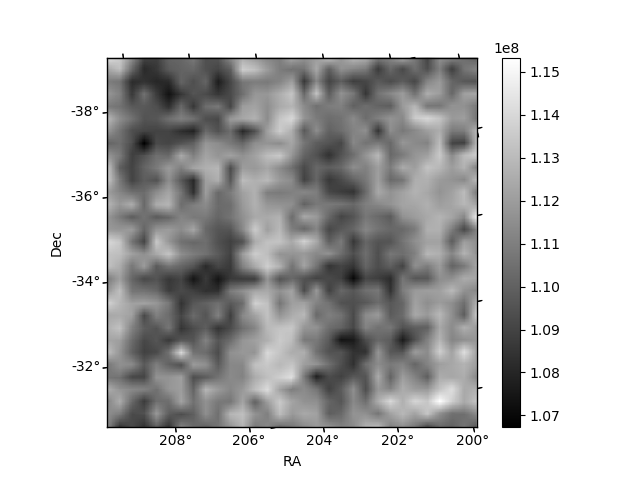
Histogram calculated using DETX and DETY for each event in the final _common_clean file
| Quadrant A | 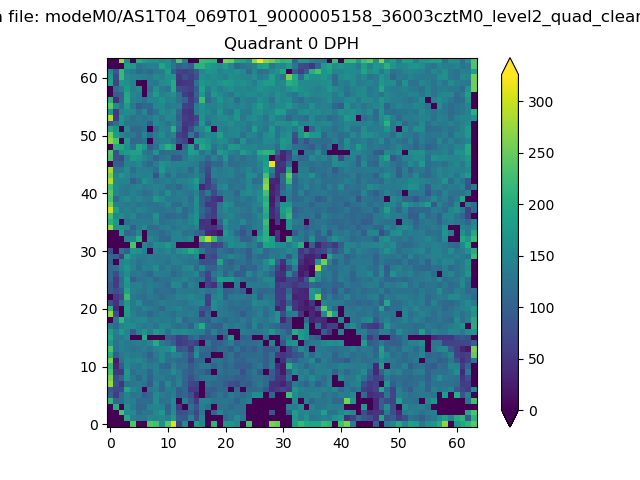 |
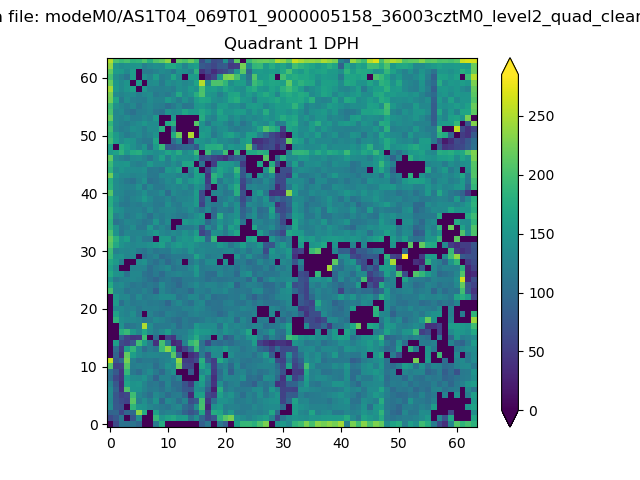 |
Quadrant B |
|---|---|---|---|
| Quadrant D | 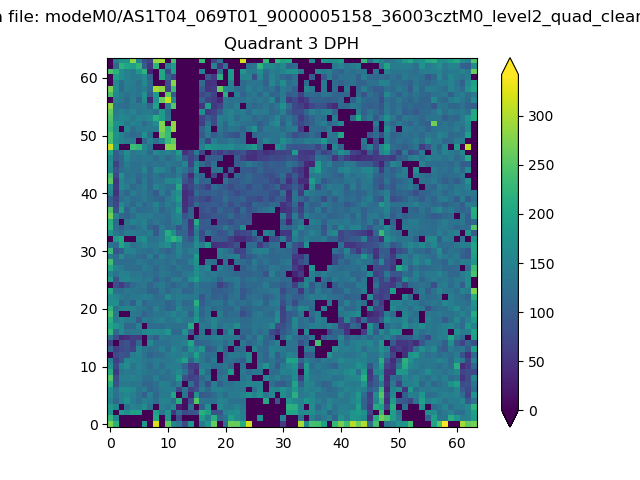 |
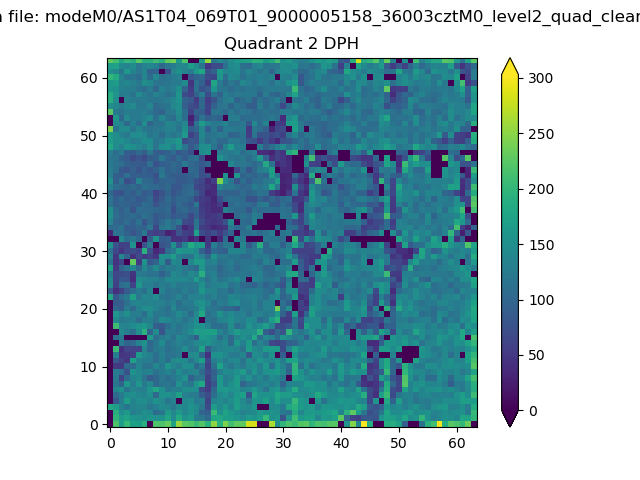 |
Quadrant C |
| Plot type | Count rate plots | Images |
|---|---|---|
| Comparison with Poisson distribution Blue bars denote a histogram of data divided into 1 sec bins. Red curve is a Poisson curve with rate = median count rate of data. |
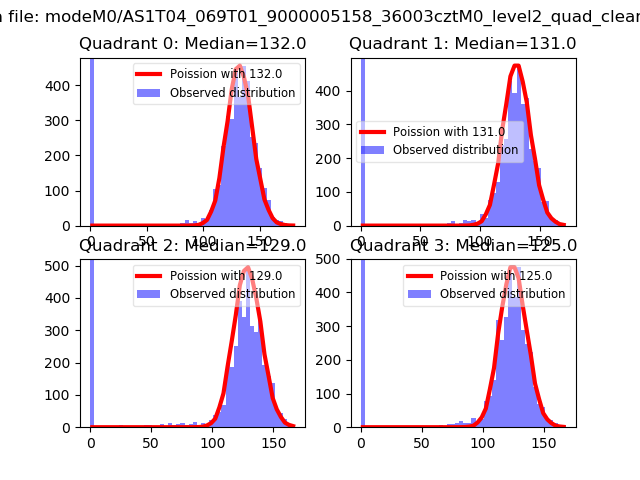 |
 |
| Quadrant-wise count rates Data is divided into 100 sec bins |
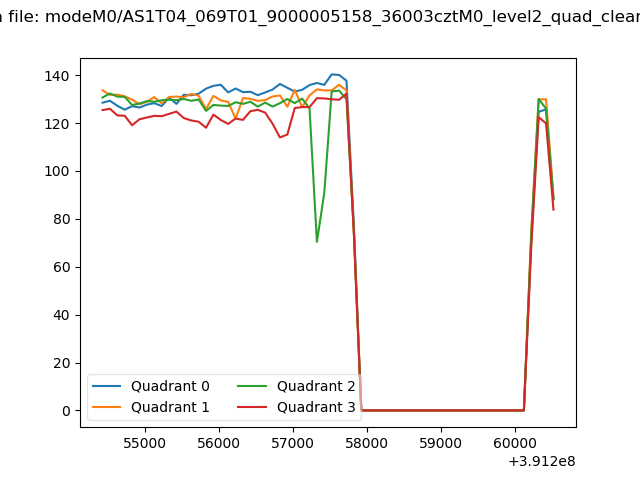 |
|
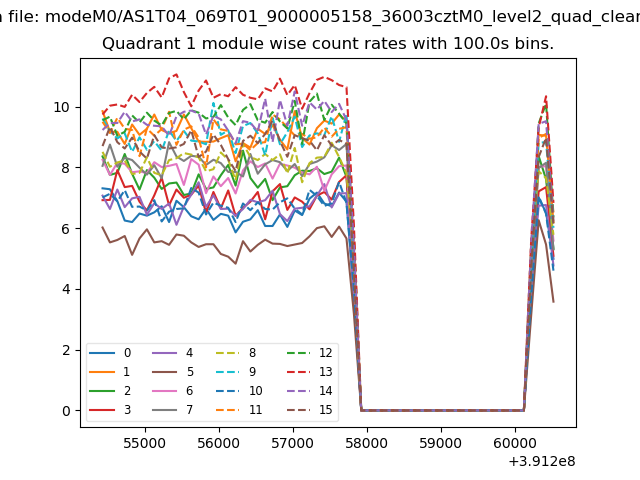
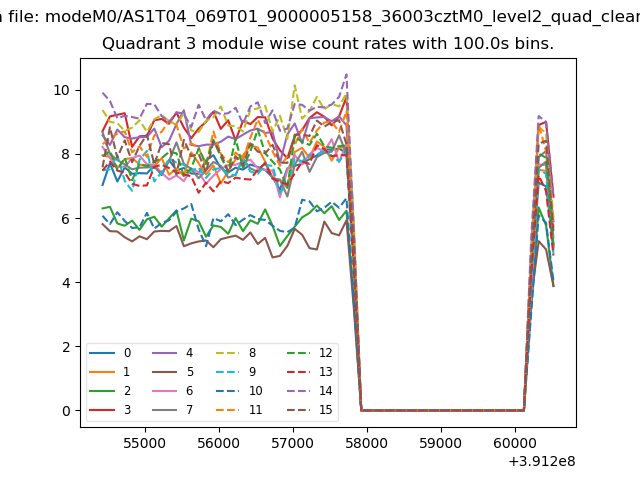
| Module-wise count rates for Quadrant A Data is divided into 100 sec bins |
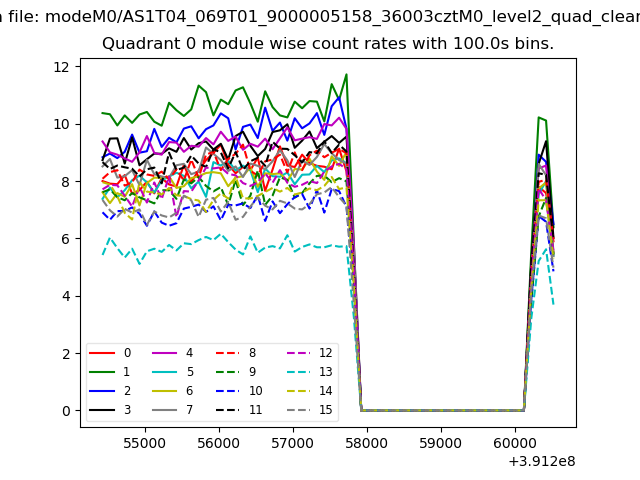 |
 |
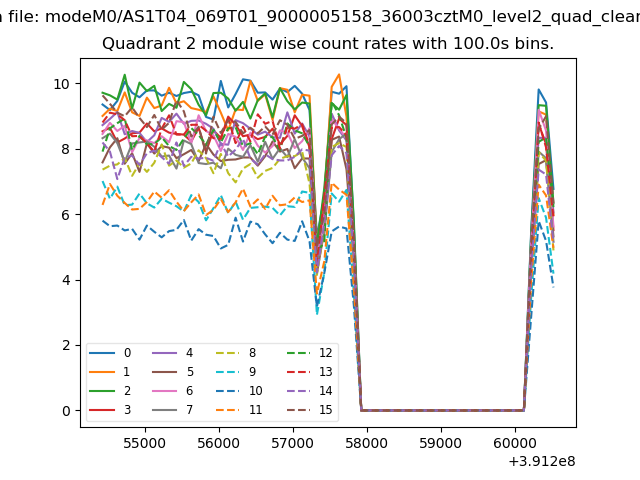
| Module-wise count rates for Quadrant B Data is divided into 100 sec bins |
 |
 |
| Module-wise count rates for Quadrant C Data is divided into 100 sec bins |
 |
 |
| Module-wise count rates for Quadrant D Data is divided into 100 sec bins |
 |
 |
| Parameter | Plot |
|---|---|
| CZT HV Monitor | 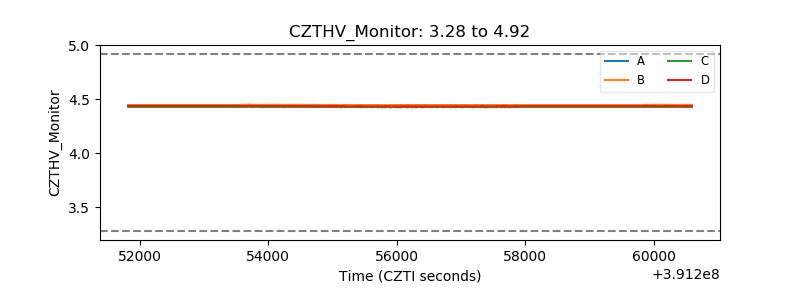 |
| D_VDD | 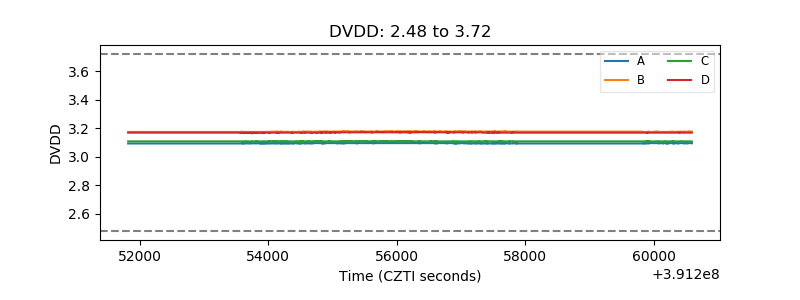 |
| Temperature 1 | 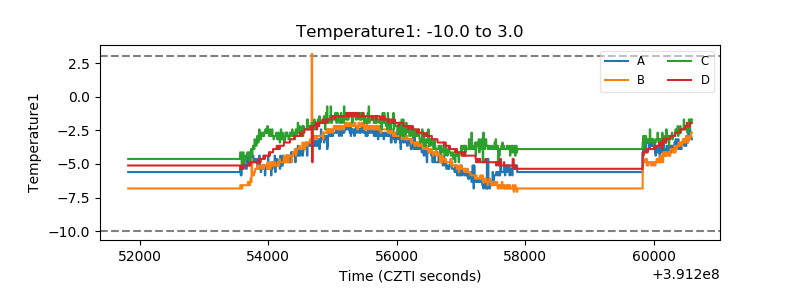 |
| Veto HV Monitor |  |
| Veto LLD | 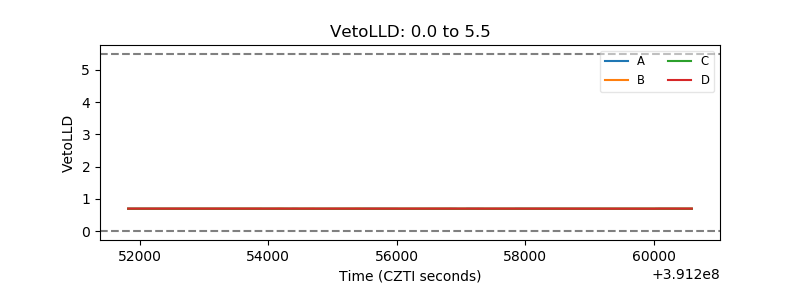 |
| Alpha Counter | 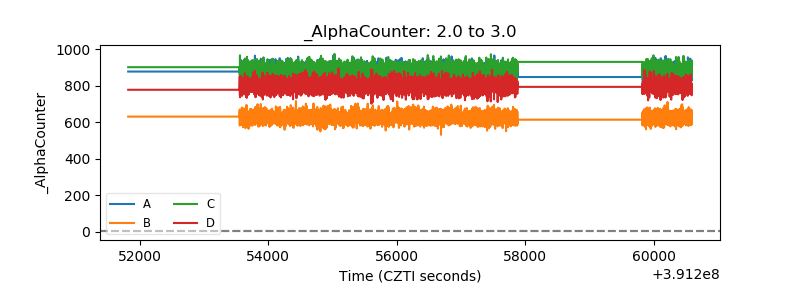 |
| _CPM_Rate | 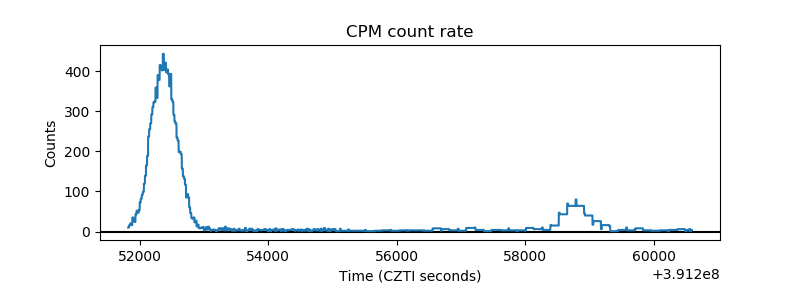 |
| CZT Counter | 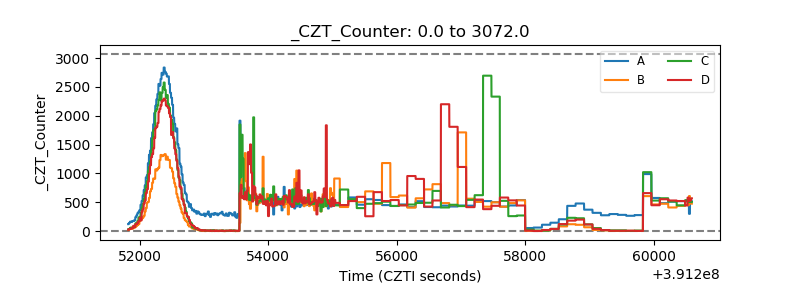 |
| +2.5 Volts monitor | 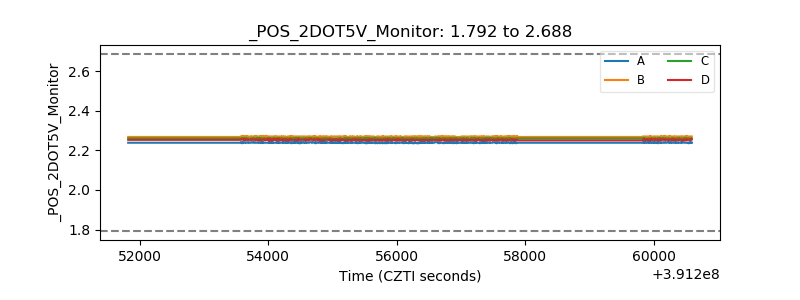 |
| +5 Volts monitor | 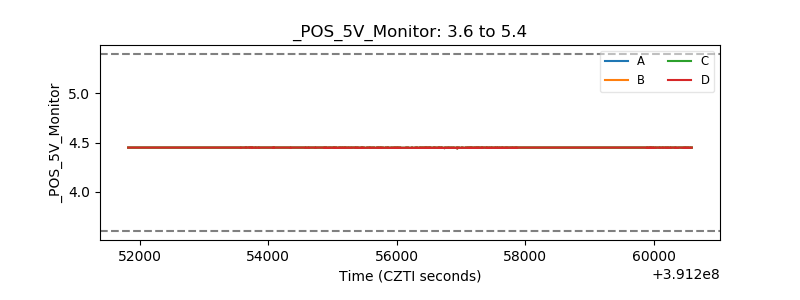 |
| _ROLL_ROT | 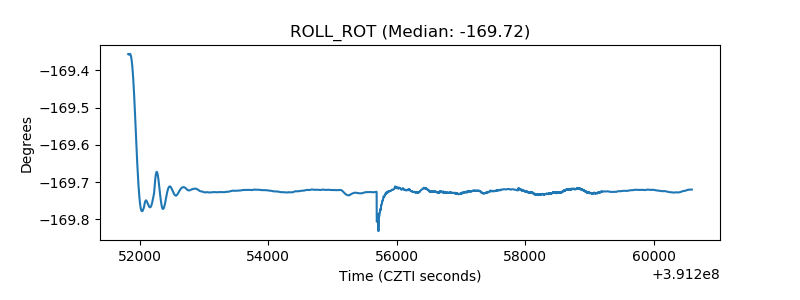 |
| _Roll_DEC | 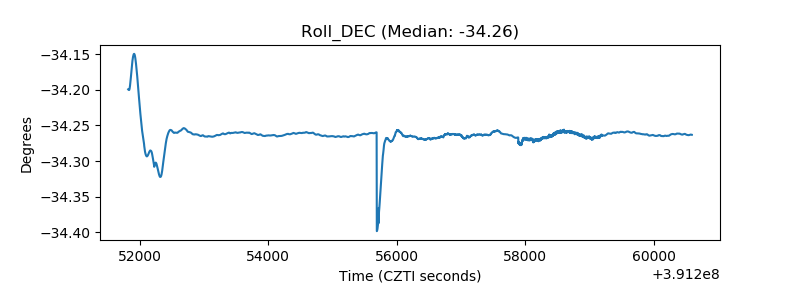 |
| _Roll_RA | 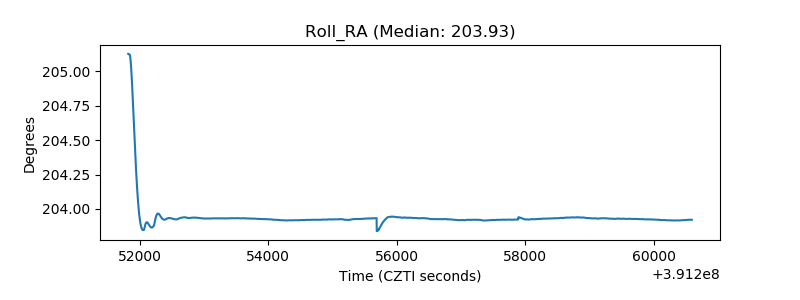 |
| Veto Counter | 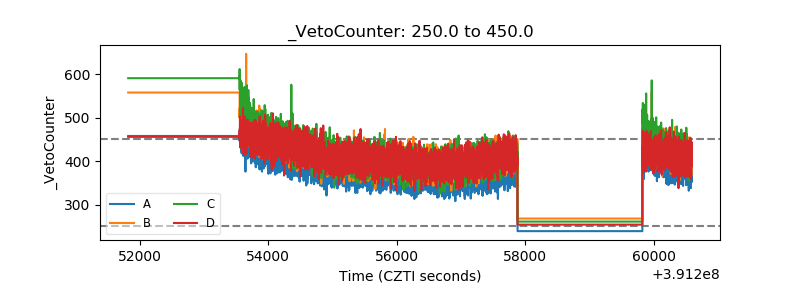 |