| Param | Original file | Final file |
|---|---|---|
| Filename | modeM0/AS1T05_009T08_9000005150_35970cztM0_level2.evt | modeM0/AS1T05_009T08_9000005150_35970cztM0_level2_quad_clean.evt |
| Size (bytes) | 617,987,520 | 67,340,160 |
| Size | 589.4 MB | 64.2 MB |
| Events in quadrant A | 1,963,740 | 543,664 |
| Events in quadrant B | 10,691,027 | 182,929 |
| Events in quadrant C | 2,561,959 | 526,714 |
| Events in quadrant D | 3,223,316 | 496,870 |
| Mode SS | |||
|---|---|---|---|
| Quadrant | BADHDUFLAG | Total packets | Discarded packets |
| A | 0 | 82 | 0 |
| B | 0 | 82 | 0 |
| C | 0 | 82 | 0 |
| D | 0 | 82 | 0 |
| Mode M0 | |||
|---|---|---|---|
| Quadrant | BADHDUFLAG | Total packets | Discarded packets |
| A | 0 | 8330 | 1 |
| B | 0 | 34546 | 1 |
| C | 0 | 10068 | 1 |
| D | 0 | 12253 | 1 |
| Mode M9 | |||
|---|---|---|---|
| Quadrant | BADHDUFLAG | Total packets | Discarded packets |
| A | 0 | 9 | 0 |
| B | 0 | 9 | 0 |
| C | 0 | 9 | 0 |
| D | 0 | 10 | 0 |
| Quadrant | Total seconds | Saturated seconds | Saturation percentage |
|---|---|---|---|
| A | 4065 | 6 | 0.147601% |
| B | 4065 | 4065 | 100.000000% |
| C | 4065 | 158 | 3.886839% |
| D | 4065 | 254 | 6.248462% |
Noise dominated data is calculated using 1-second bins in cleaned event files. If a bin has >2000 counts, and if more than 50% of those come from <1% of pixels, then it is considered to be noise-dominated and hence unusable.
| Quadrant | # 1 sec bins | Bins with >0 counts | Bins with >2000 counts | High rate bins dominated by noise | Noise dominated (total time) | Noise dominated (detector-on time) | Marked lightcurve |
|---|---|---|---|---|---|---|---|
| A | 4065 | 4065 | 1 | 1 | 0.02% | 0.02% | 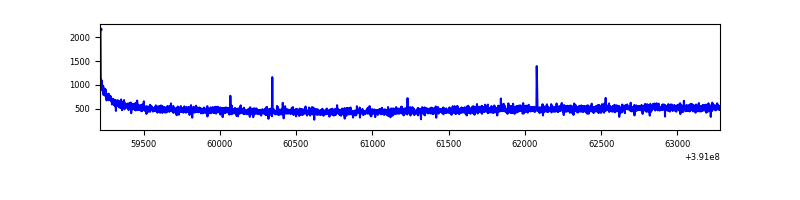 |
| B | 4064 | 4064 | 4001 | 4001 | 98.45% | 98.45% | 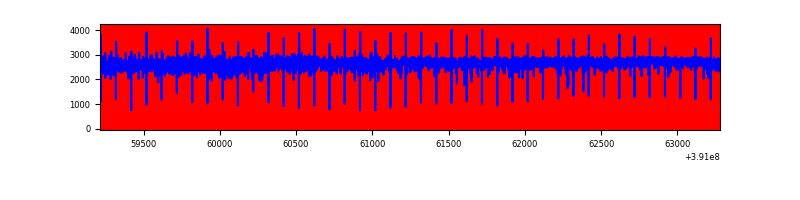 |
| C | 4065 | 4065 | 121 | 121 | 2.98% | 2.98% | 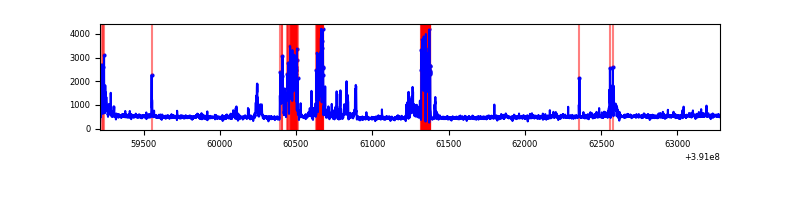 |
| D | 4065 | 4065 | 246 | 246 | 6.05% | 6.05% | 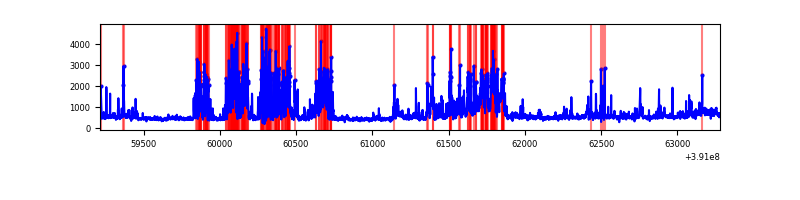 |
Top three noisy pixels from each quadrant. If the there are fewer than three noisy pixels in the level2.evt file, extra rows are filled as -1
| Pixel properties | Quadrant properties | ||||||
|---|---|---|---|---|---|---|---|
| Quadrant | DetID | PixID | Counts | Sigma | Mean | Median | Sigma |
| A | 10 | 83 | 106757 | 1110.0 | 474 | 465 | 95.8 |
| A | 8 | 144 | 10583 | 105.66 | 474 | 465 | 95.8 |
| A | 15 | 169 | 9976 | 99.32 | 474 | 465 | 95.8 |
| B | 5 | 31 | 3899496 | 110630.61 | 177 | 173 | 35.2 |
| B | 5 | 15 | 3731820 | 105873.34 | 177 | 173 | 35.2 |
| B | 5 | 14 | 2104604 | 59706.38 | 177 | 173 | 35.2 |
| C | 9 | 187 | 583550 | 5628.96 | 446 | 450 | 103.6 |
| C | 15 | 214 | 164943 | 1587.93 | 446 | 450 | 103.6 |
| C | 0 | 10 | 40933 | 390.8 | 446 | 450 | 103.6 |
| D | 2 | 250 | 771472 | 7175.93 | 446 | 434 | 107.4 |
| D | 12 | 227 | 338244 | 3143.94 | 446 | 434 | 107.4 |
| D | 8 | 195 | 95987 | 889.3 | 446 | 434 | 107.4 |
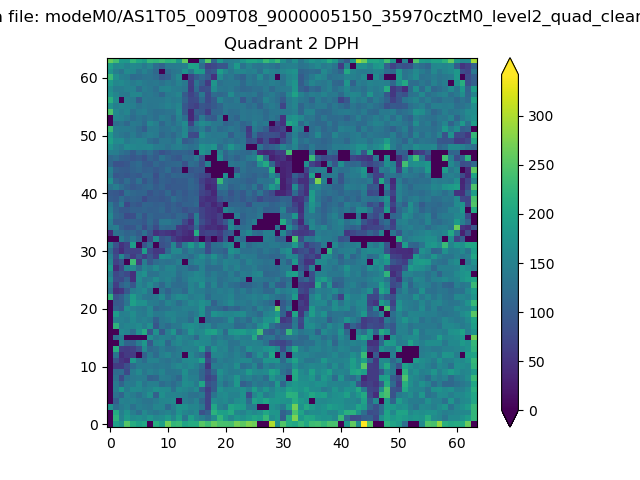
Histogram calculated using DETX and DETY for each event in the final _common_clean file
| Quadrant A | 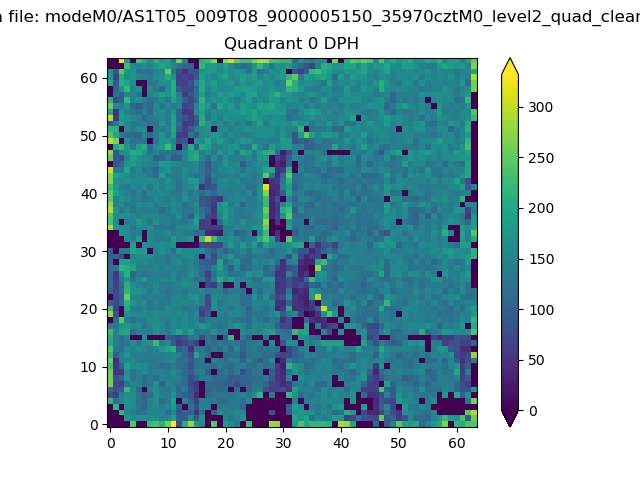 |
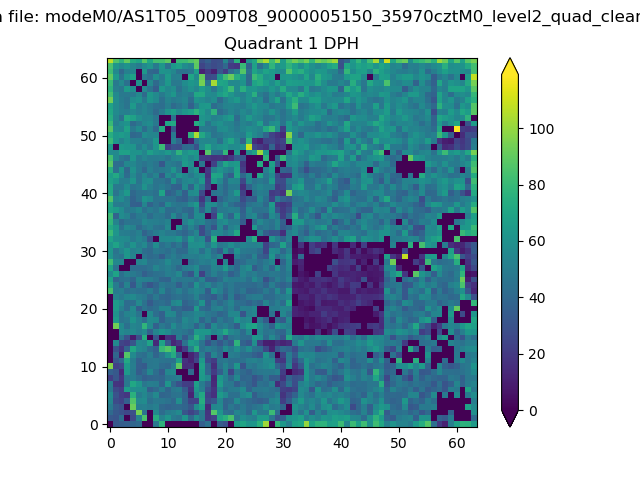 |
Quadrant B |
|---|---|---|---|
| Quadrant D | 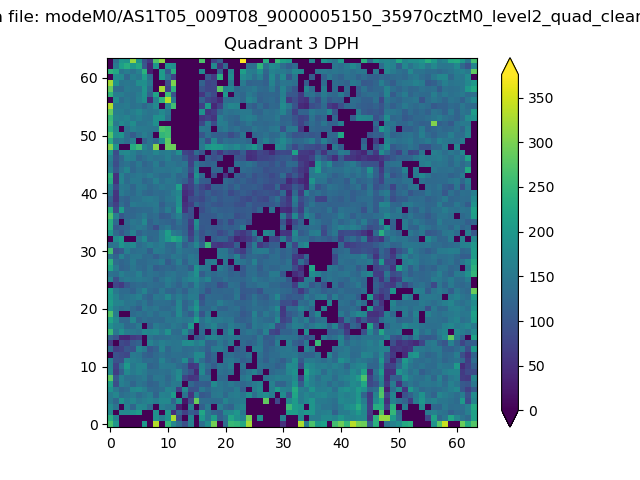 |
 |
Quadrant C |
| Plot type | Count rate plots | Images |
|---|---|---|
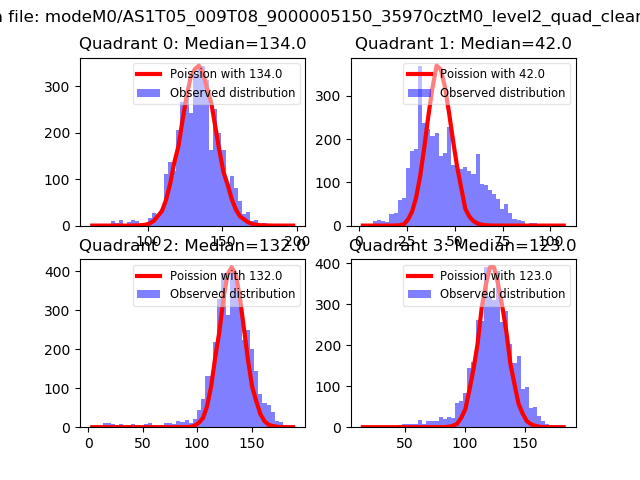
| Comparison with Poisson distribution Blue bars denote a histogram of data divided into 1 sec bins. Red curve is a Poisson curve with rate = median count rate of data. |
 |
 |
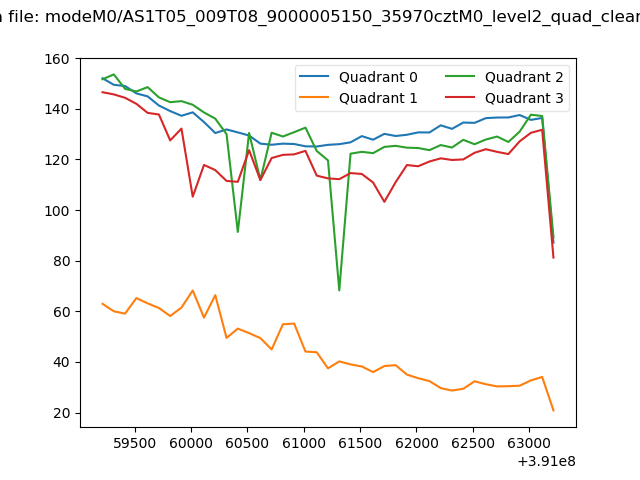
| Quadrant-wise count rates Data is divided into 100 sec bins |
 |
|
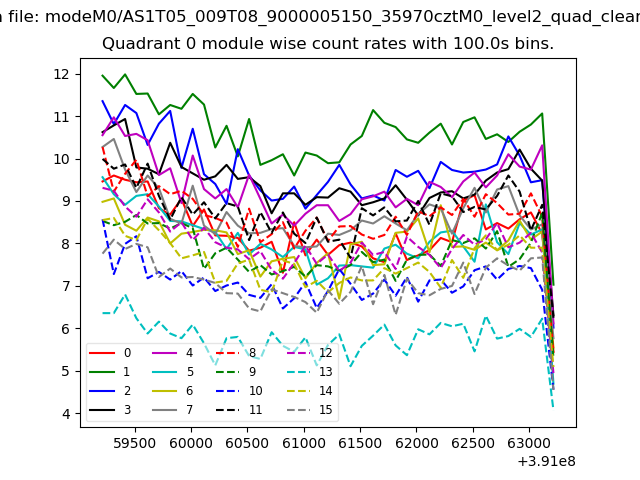
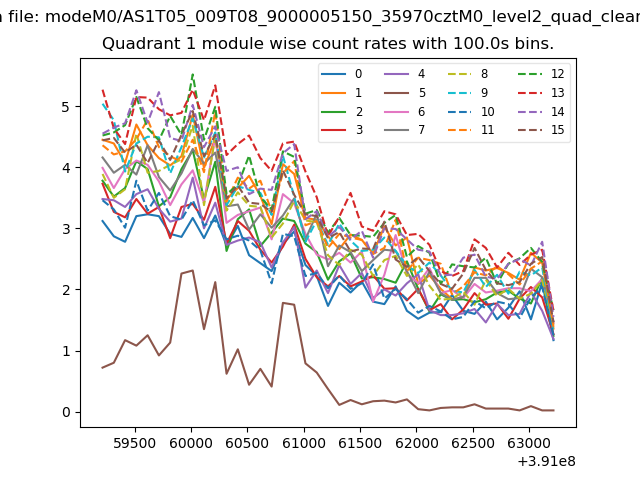
| Module-wise count rates for Quadrant A Data is divided into 100 sec bins |
 |
 |
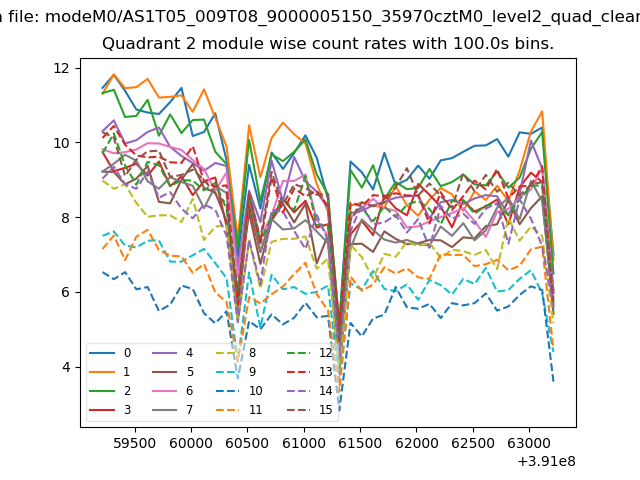
| Module-wise count rates for Quadrant B Data is divided into 100 sec bins |
 |
 |
| Module-wise count rates for Quadrant C Data is divided into 100 sec bins |
 |
 |
| Module-wise count rates for Quadrant D Data is divided into 100 sec bins |
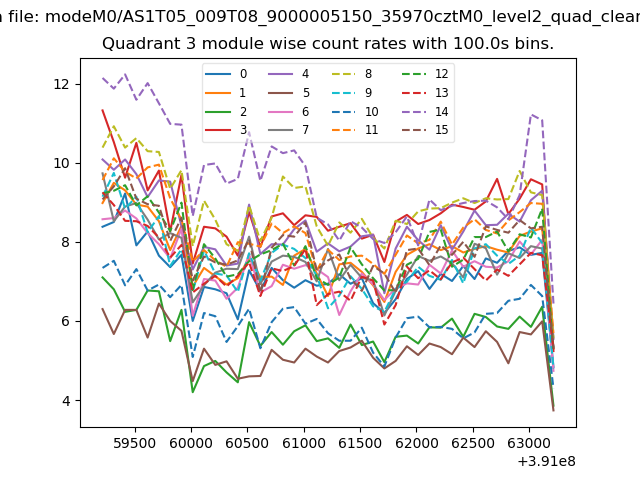 |
 |
| Parameter | Plot |
|---|---|
| CZT HV Monitor | 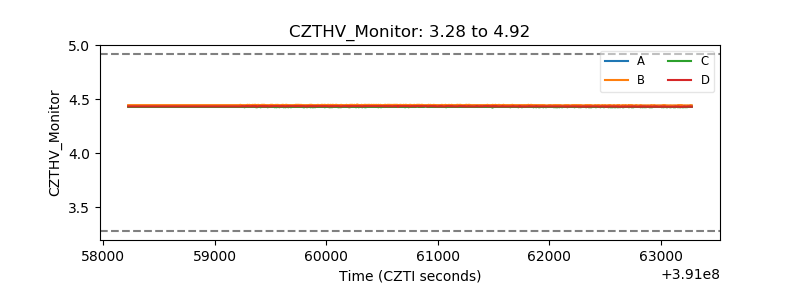 |
| D_VDD | 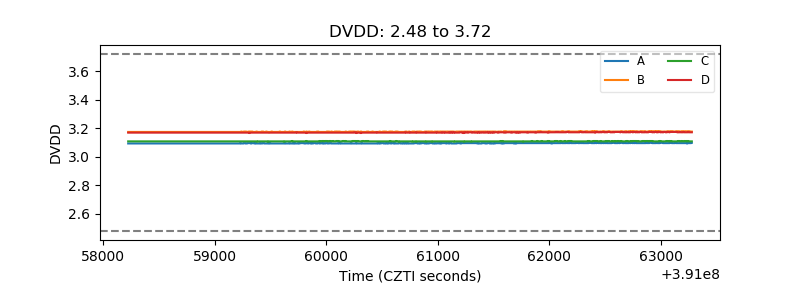 |
| Temperature 1 | 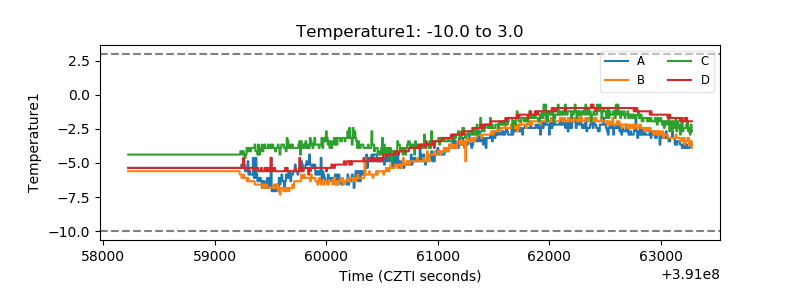 |
| Veto HV Monitor | 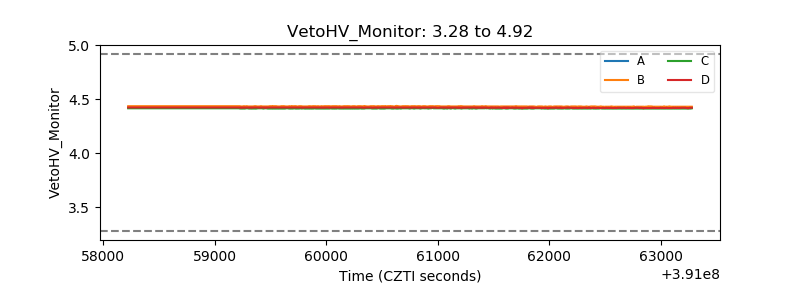 |
| Veto LLD | 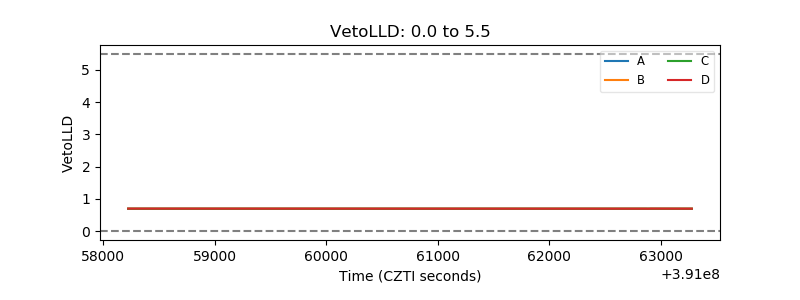 |
| Alpha Counter | 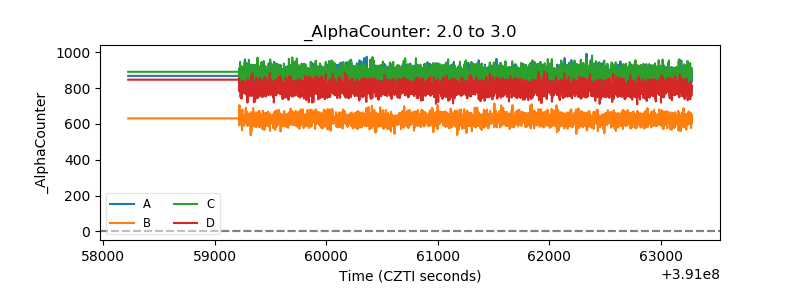 |
| _CPM_Rate | 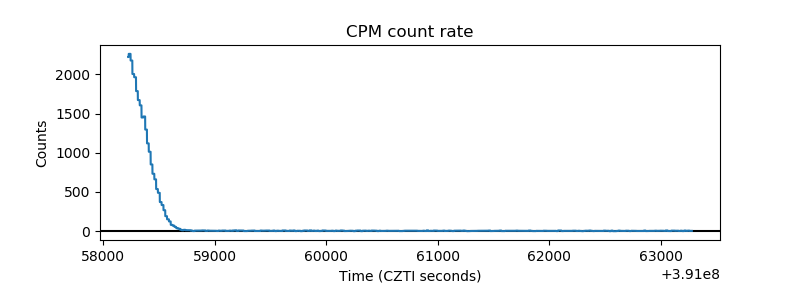 |
| CZT Counter | 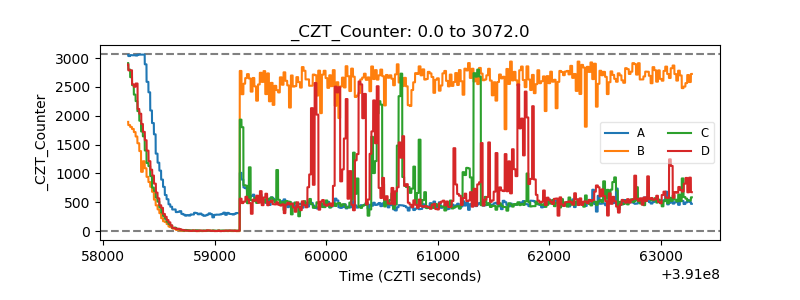 |
| +2.5 Volts monitor | 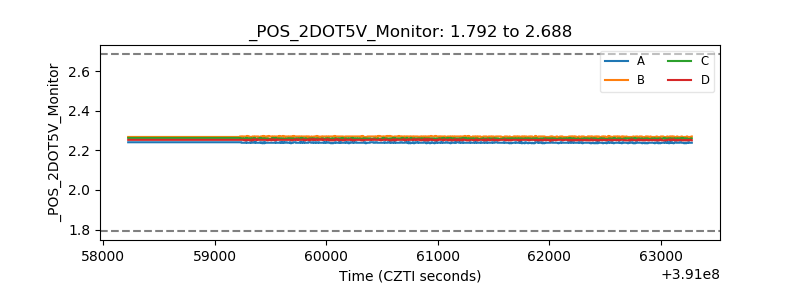 |
| +5 Volts monitor | 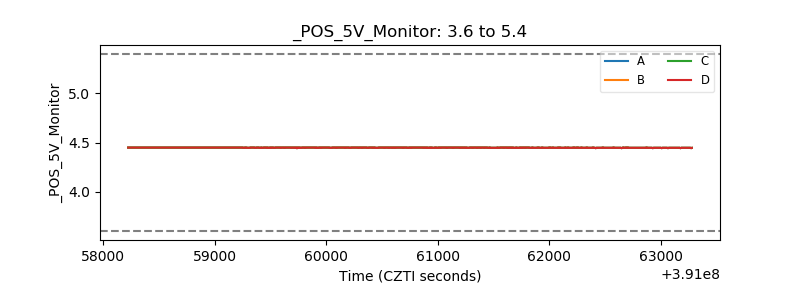 |
| _ROLL_ROT | 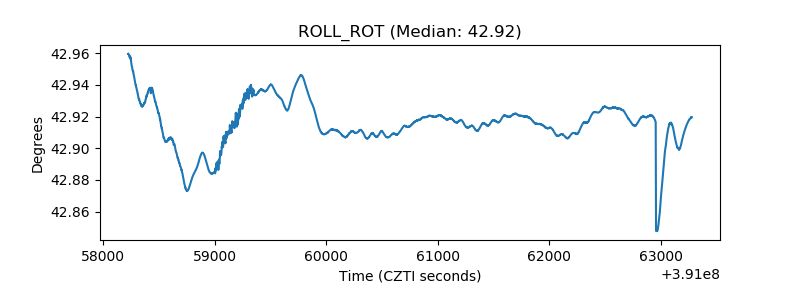 |
| _Roll_DEC | 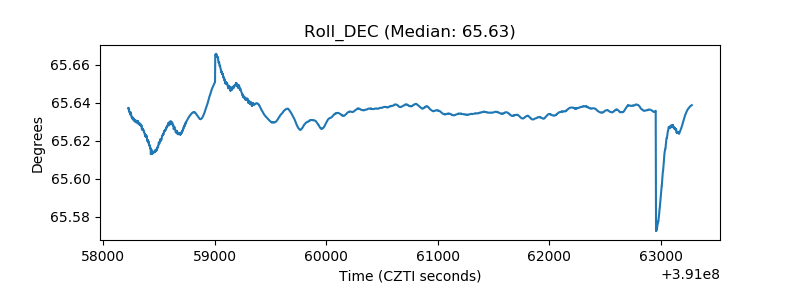 |
| _Roll_RA | 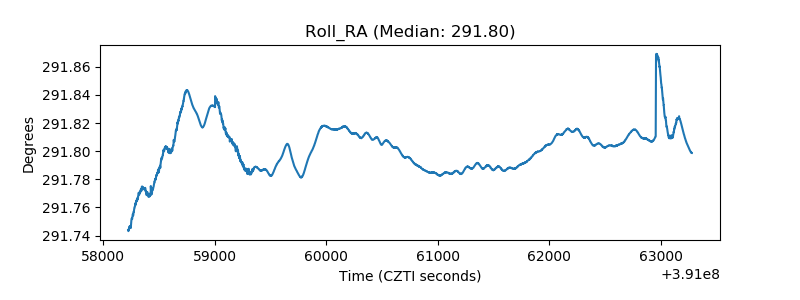 |
| Veto Counter | 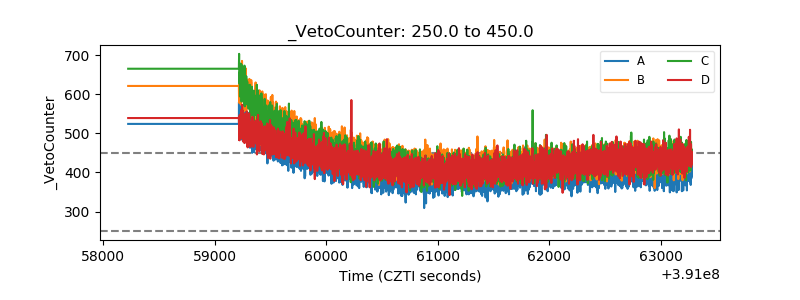 |