| Param | Original file | Final file |
|---|---|---|
| Filename | modeM0/AS1T05_009T08_9000005150cztM0_level2_bc.evt | modeM0/AS1T05_009T08_9000005150cztM0_level2_quad_clean.evt |
| Size (bytes) | 497,016,000 | 158,443,200 |
| Size | 474.0 MB | 151.1 MB |
| Events in quadrant A | 2,266,696 | 1,269,711 |
| Events in quadrant B | 4,682,900 | 446,717 |
| Events in quadrant C | 3,120,846 | 1,230,345 |
| Events in quadrant D | 4,303,202 | 1,171,268 |
| Mode SS | |||
|---|---|---|---|
| Quadrant | BADHDUFLAG | Total packets | Discarded packets |
| A | 0 | 198 | 0 |
| B | 0 | 198 | 0 |
| C | 0 | 198 | 0 |
| D | 0 | 198 | 0 |
| Mode M0 | |||
|---|---|---|---|
| Quadrant | BADHDUFLAG | Total packets | Discarded packets |
| A | 0 | 20013 | 0 |
| B | 0 | 82056 | 0 |
| C | 0 | 23900 | 0 |
| D | 0 | 27963 | 0 |
| Mode M9 | |||
|---|---|---|---|
| Quadrant | BADHDUFLAG | Total packets | Discarded packets |
| A | 0 | 36 | 0 |
| B | 0 | 36 | 0 |
| C | 0 | 36 | 0 |
| D | 0 | 36 | 0 |
| Quadrant | Total seconds | Saturated seconds | Saturation percentage |
|---|---|---|---|
| A | 9761 | 14 | 0.143428% |
| B | 9761 | 9647 | 98.832087% |
| C | 9761 | 410 | 4.200389% |
| D | 9761 | 440 | 4.507735% |
Noise dominated data is calculated using 1-second bins in cleaned event files. If a bin has >2000 counts, and if more than 50% of those come from <1% of pixels, then it is considered to be noise-dominated and hence unusable.
| Quadrant | # 1 sec bins | Bins with >0 counts | Bins with >2000 counts | High rate bins dominated by noise | Noise dominated (total time) | Noise dominated (detector-on time) | Marked lightcurve |
|---|---|---|---|---|---|---|---|
| A | 13346 | 9763 | 0 | 0 | 0.00% | 0.00% | 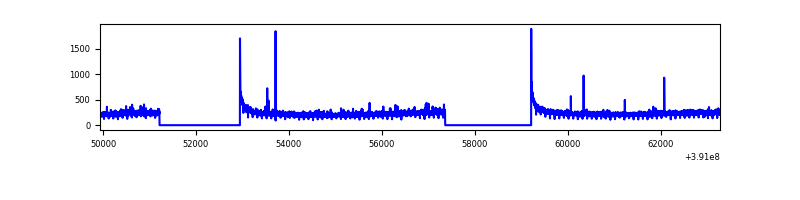 |
| B | 13345 | 9758 | 117 | 117 | 0.88% | 1.20% | 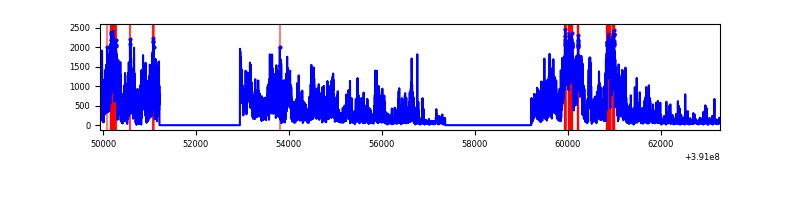 |
| C | 13346 | 9761 | 13 | 13 | 0.10% | 0.13% | 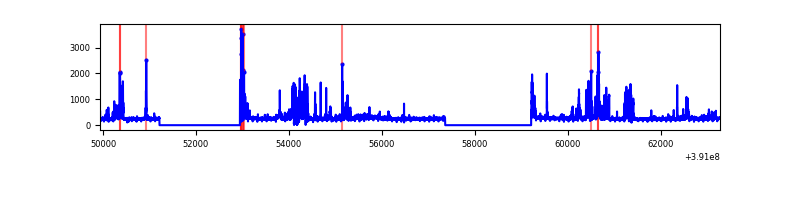 |
| D | 13346 | 9761 | 73 | 73 | 0.55% | 0.75% | 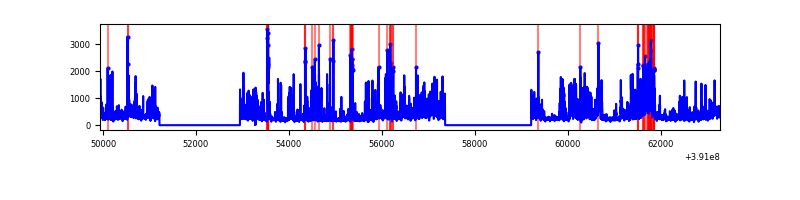 |
Top three noisy pixels from each quadrant. If the there are fewer than three noisy pixels in the level2.evt file, extra rows are filled as -1
| Pixel properties | Quadrant properties | ||||||
|---|---|---|---|---|---|---|---|
| Quadrant | DetID | PixID | Counts | Sigma | Mean | Median | Sigma |
| A | 10 | 83 | 232765 | 2026.04 | 508 | 499 | 114.6 |
| A | 8 | 144 | 29963 | 257.01 | 508 | 499 | 114.6 |
| A | 15 | 169 | 24636 | 210.55 | 508 | 499 | 114.6 |
| B | 5 | 31 | 2019158 | 44236.56 | 174 | 174 | 45.6 |
| B | 5 | 15 | 1750367 | 38347.26 | 174 | 174 | 45.6 |
| B | 0 | 190 | 92801 | 2029.49 | 174 | 174 | 45.6 |
| C | 9 | 187 | 666147 | 5833.06 | 485 | 480 | 114.1 |
| C | 15 | 214 | 375582 | 3286.92 | 485 | 480 | 114.1 |
| C | 0 | 10 | 86054 | 749.86 | 485 | 480 | 114.1 |
| D | 2 | 250 | 536854 | 4514.3 | 489 | 472 | 118.8 |
| D | 12 | 227 | 438737 | 3688.52 | 489 | 472 | 118.8 |
| D | 12 | 17 | 335698 | 2821.33 | 489 | 472 | 118.8 |
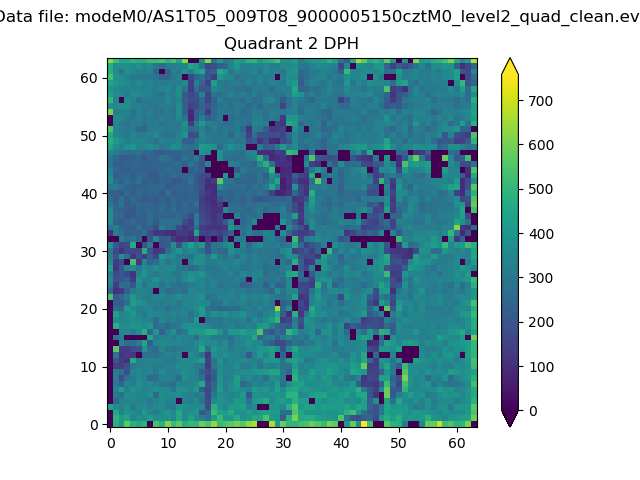
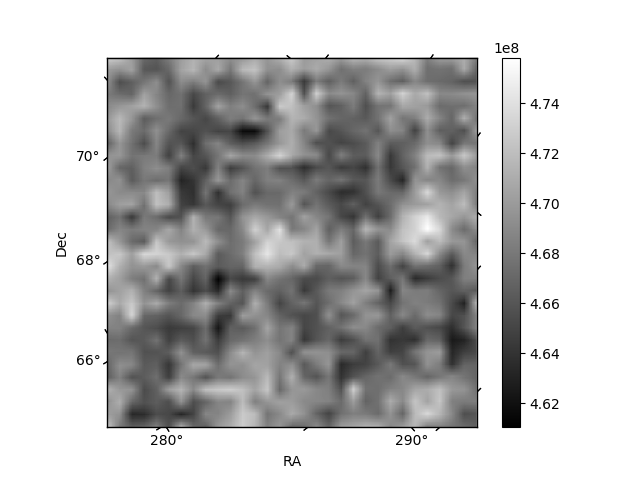
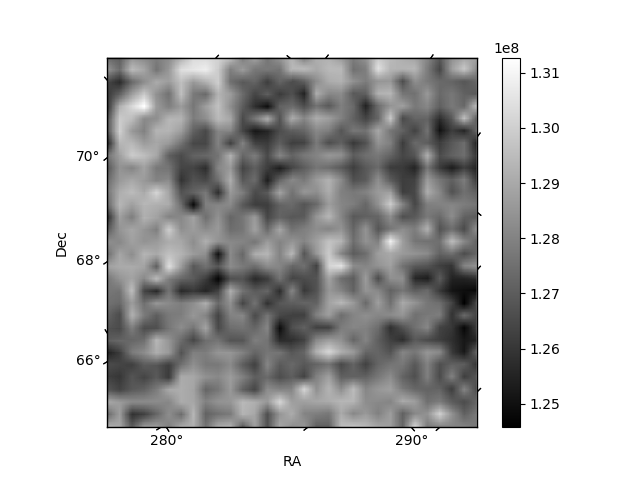
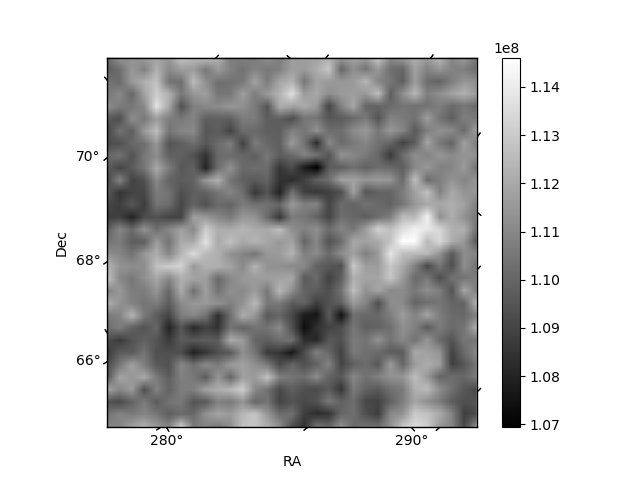
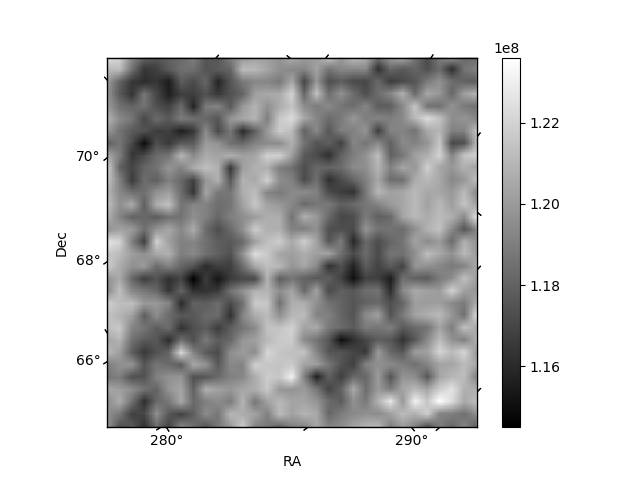
Histogram calculated using DETX and DETY for each event in the final _common_clean file
| Quadrant A | 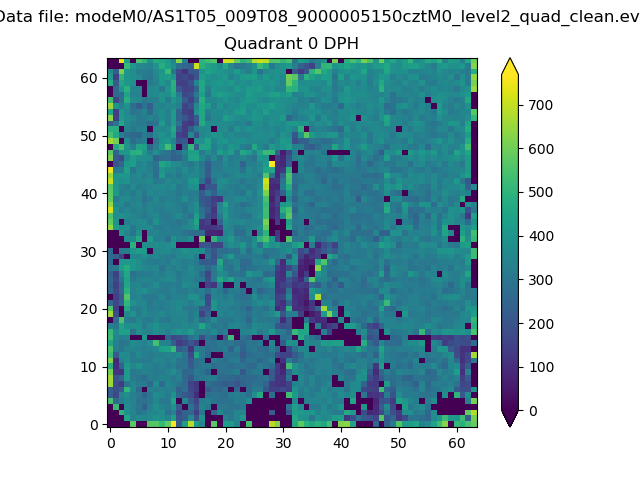 |
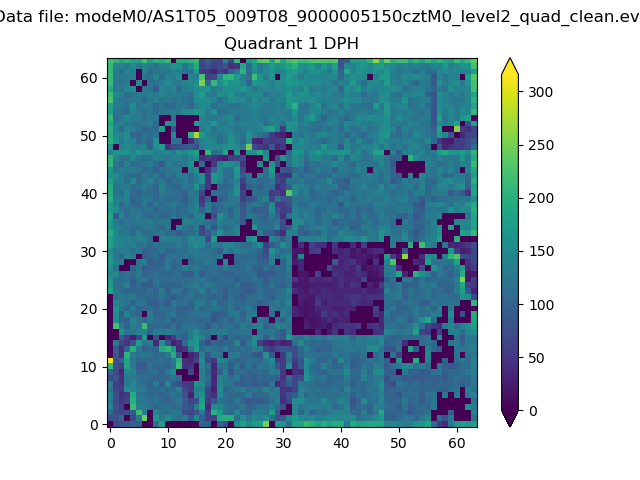 |
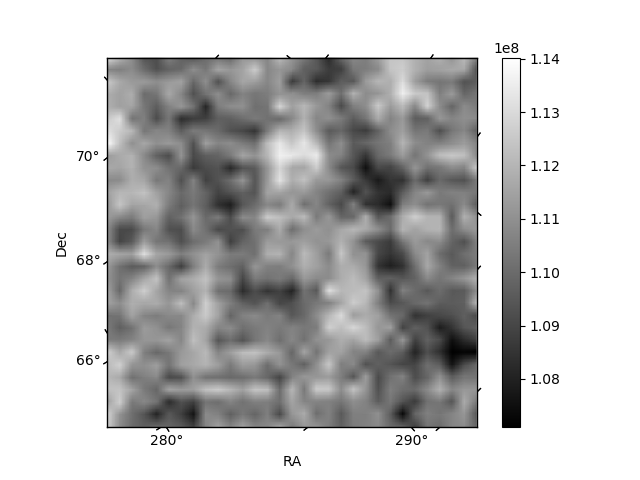
Quadrant B |
|---|---|---|---|
| Quadrant D | 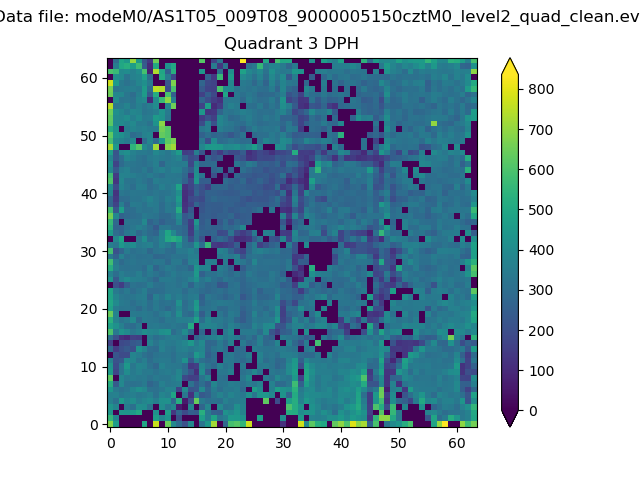 |
 |
Quadrant C |
| Plot type | Count rate plots | Images |
|---|---|---|
| Comparison with Poisson distribution Blue bars denote a histogram of data divided into 1 sec bins. Red curve is a Poisson curve with rate = median count rate of data. |
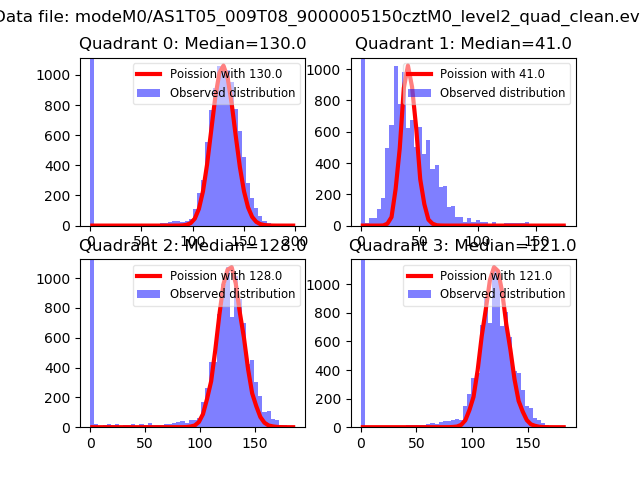 |
 |
| Quadrant-wise count rates Data is divided into 100 sec bins |
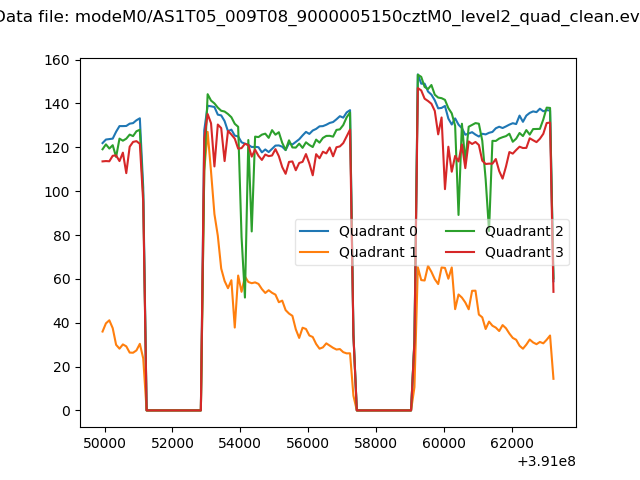 |
|
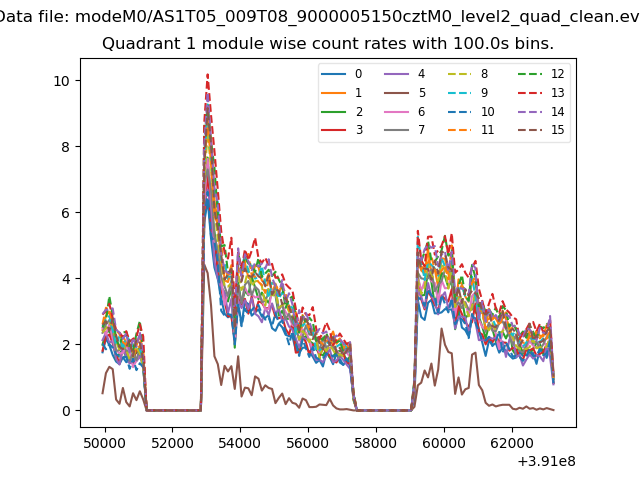
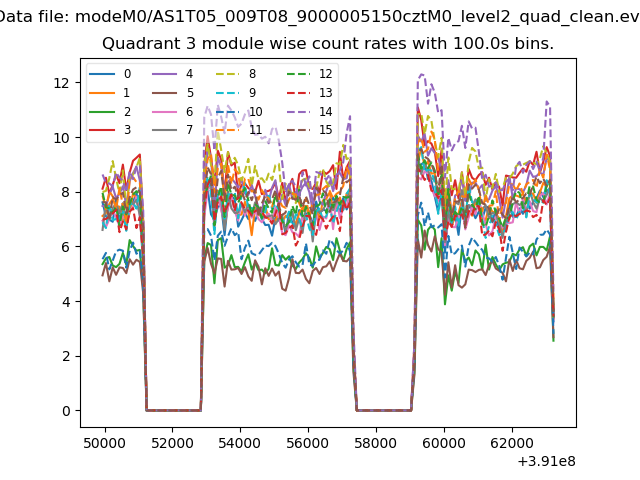
| Module-wise count rates for Quadrant A Data is divided into 100 sec bins |
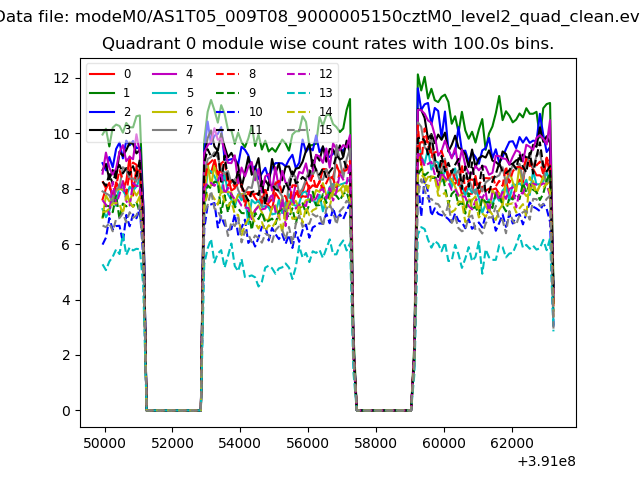 |
 |
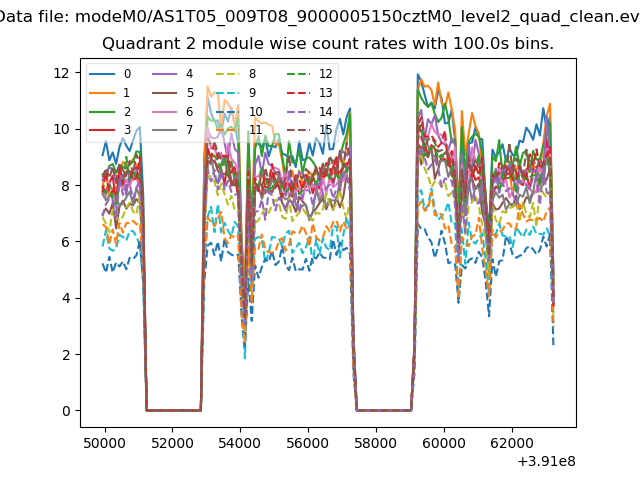
| Module-wise count rates for Quadrant B Data is divided into 100 sec bins |
 |
 |
| Module-wise count rates for Quadrant C Data is divided into 100 sec bins |
 |
 |
| Module-wise count rates for Quadrant D Data is divided into 100 sec bins |
 |
 |
| Parameter | Plot |
|---|---|
| CZT HV Monitor | 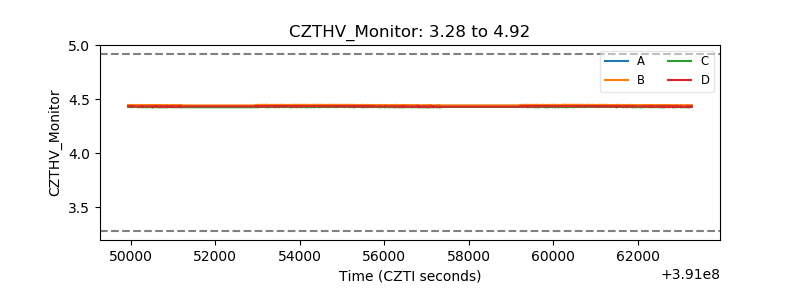 |
| D_VDD | 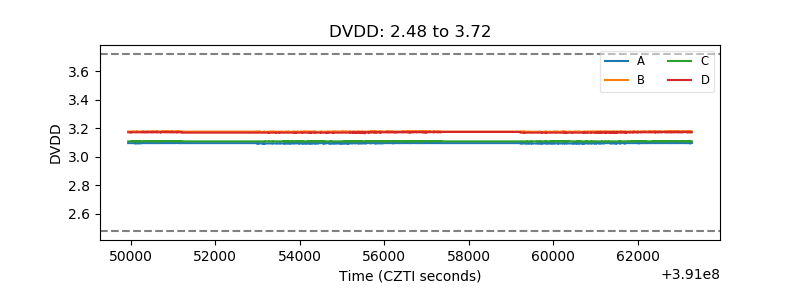 |
| Temperature 1 | 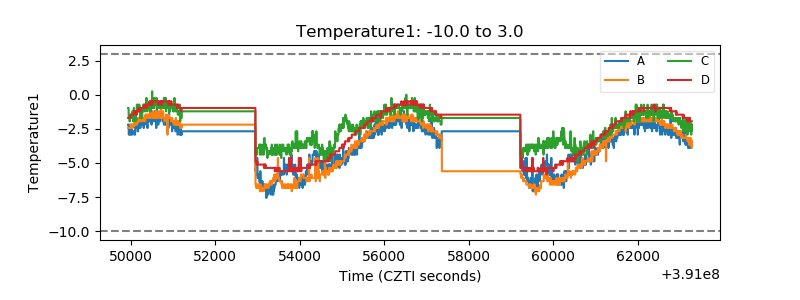 |
| Veto HV Monitor | 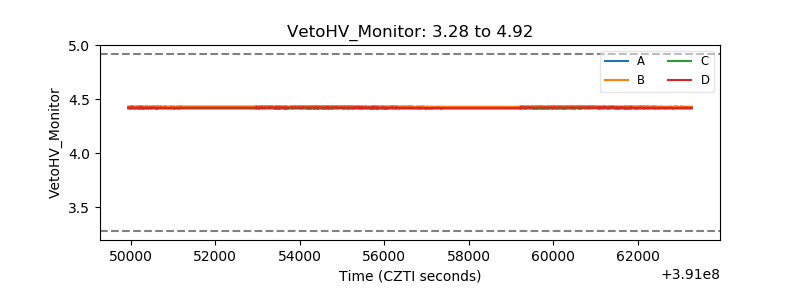 |
| Veto LLD | 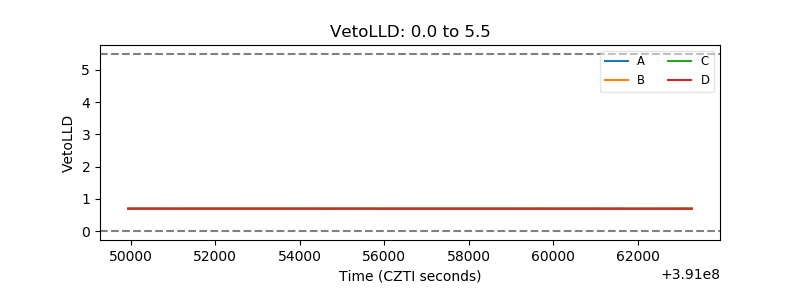 |
| Alpha Counter | 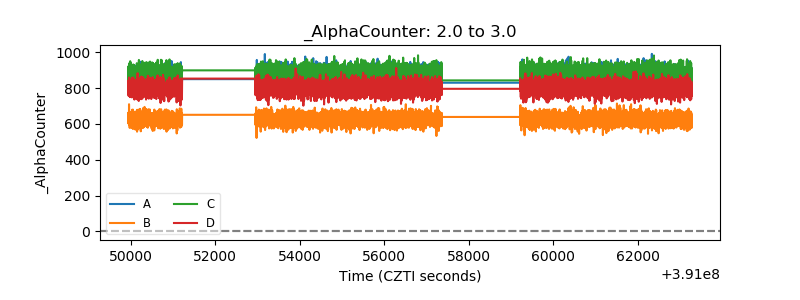 |
| _CPM_Rate | 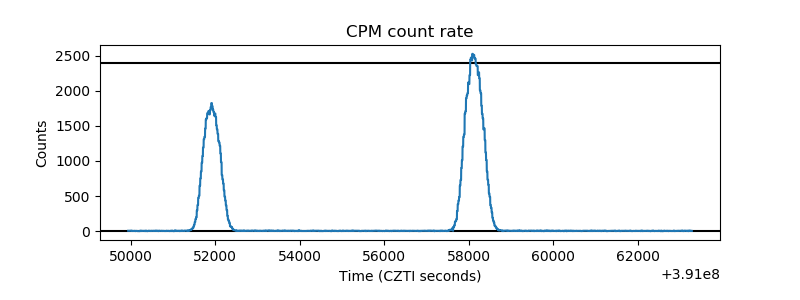 |
| CZT Counter | 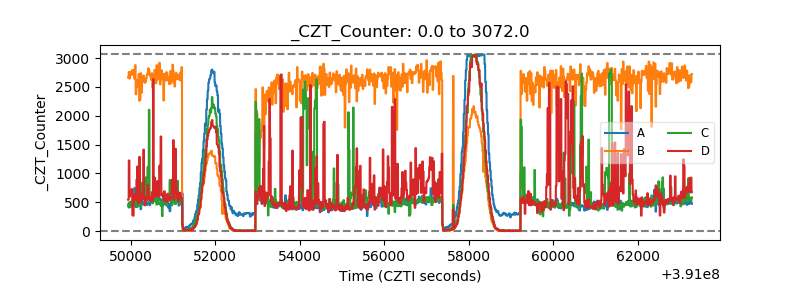 |
| +2.5 Volts monitor | 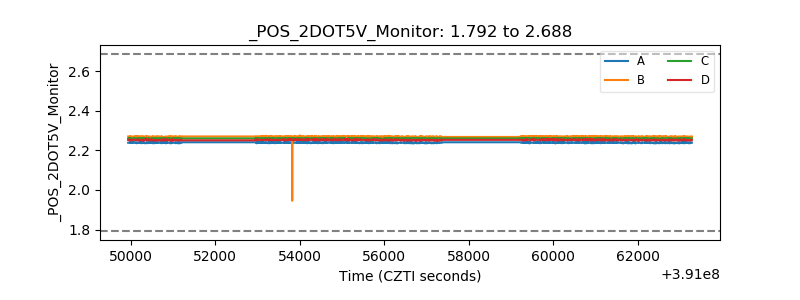 |
| +5 Volts monitor | 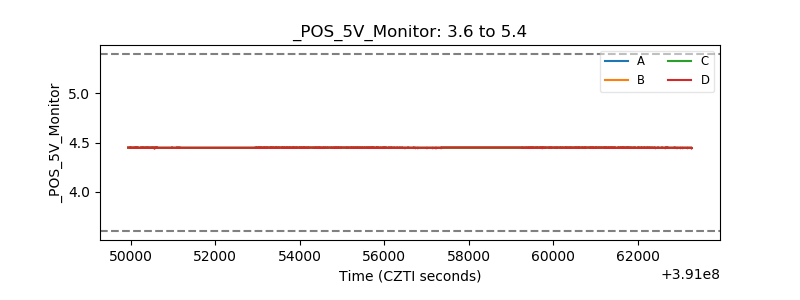 |
| _ROLL_ROT | 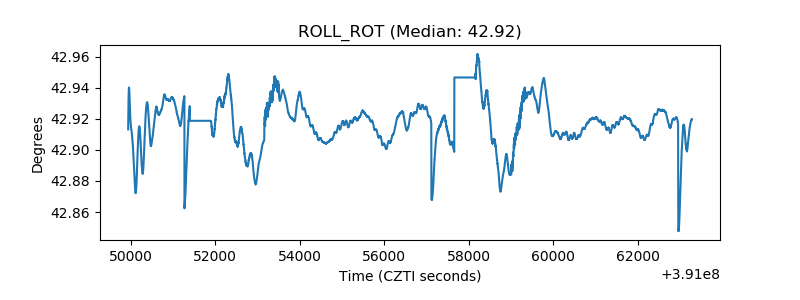 |
| _Roll_DEC | 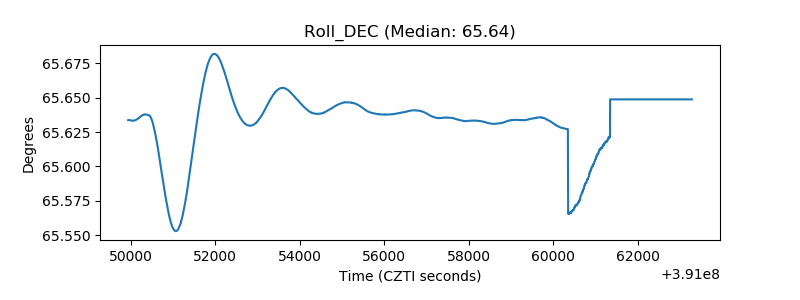 |
| _Roll_RA | 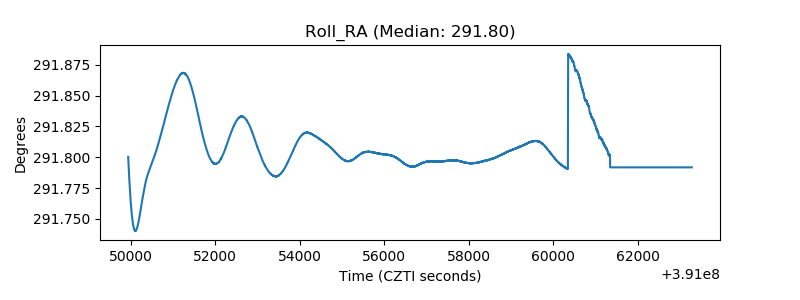 |
| Veto Counter | 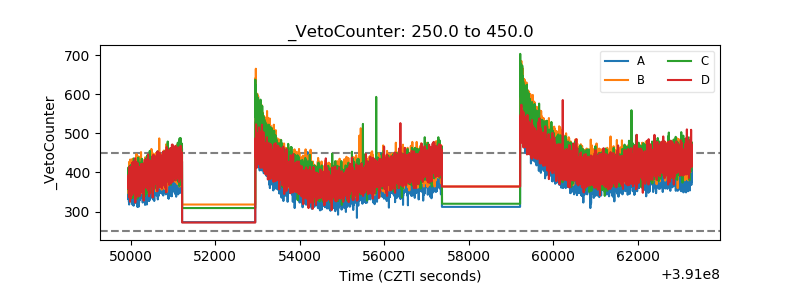 |