| Param | Original file | Final file |
|---|---|---|
| Filename | modeM0/AS1A11_050T19_9000005156_36001cztM0_level2.evt | modeM0/AS1A11_050T19_9000005156_36001cztM0_level2_quad_clean.evt |
| Size (bytes) | 421,338,240 | 102,136,320 |
| Size | 401.8 MB | 97.4 MB |
| Events in quadrant A | 2,500,173 | 701,051 |
| Events in quadrant B | 3,005,976 | 696,155 |
| Events in quadrant C | 3,247,330 | 690,555 |
| Events in quadrant D | 3,673,869 | 661,675 |
| Mode M0 | |||
|---|---|---|---|
| Quadrant | BADHDUFLAG | Total packets | Discarded packets |
| A | 0 | 10298 | 3 |
| B | 0 | 11998 | 2 |
| C | 0 | 12601 | 2 |
| D | 0 | 14025 | 2 |
| Mode SS | |||
|---|---|---|---|
| Quadrant | BADHDUFLAG | Total packets | Discarded packets |
| A | 0 | 102 | 0 |
| B | 0 | 102 | 0 |
| C | 0 | 102 | 0 |
| D | 0 | 102 | 0 |
| Mode M9 | |||
|---|---|---|---|
| Quadrant | BADHDUFLAG | Total packets | Discarded packets |
| A | 0 | 24 | 0 |
| B | 0 | 24 | 0 |
| C | 0 | 24 | 0 |
| D | 0 | 25 | 0 |
| Quadrant | Total seconds | Saturated seconds | Saturation percentage |
|---|---|---|---|
| A | 4895 | 5 | 0.102145% |
| B | 4895 | 109 | 2.226762% |
| C | 4895 | 228 | 4.657814% |
| D | 4895 | 226 | 4.616956% |
Noise dominated data is calculated using 1-second bins in cleaned event files. If a bin has >2000 counts, and if more than 50% of those come from <1% of pixels, then it is considered to be noise-dominated and hence unusable.
| Quadrant | # 1 sec bins | Bins with >0 counts | Bins with >2000 counts | High rate bins dominated by noise | Noise dominated (total time) | Noise dominated (detector-on time) | Marked lightcurve |
|---|---|---|---|---|---|---|---|
| A | 7048 | 4896 | 0 | 0 | 0.00% | 0.00% | 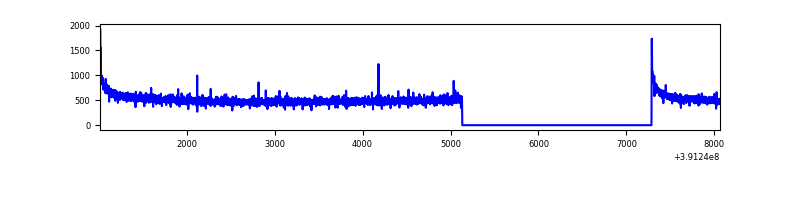 |
| B | 7048 | 4896 | 68 | 68 | 0.96% | 1.39% | 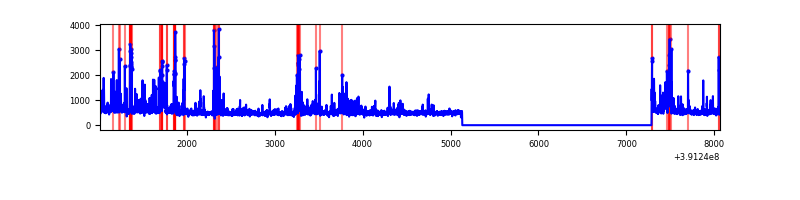 |
| C | 7048 | 4896 | 195 | 195 | 2.77% | 3.98% | 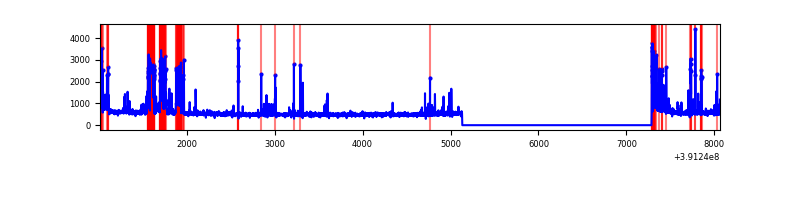 |
| D | 7048 | 4896 | 181 | 181 | 2.57% | 3.70% | 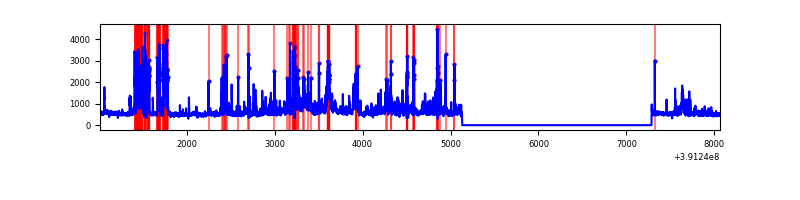 |
Top three noisy pixels from each quadrant. If the there are fewer than three noisy pixels in the level2.evt file, extra rows are filled as -1
| Pixel properties | Quadrant properties | ||||||
|---|---|---|---|---|---|---|---|
| Quadrant | DetID | PixID | Counts | Sigma | Mean | Median | Sigma |
| A | 10 | 83 | 162625 | 1363.5 | 602 | 592 | 118.8 |
| A | 13 | 254 | 7979 | 62.16 | 602 | 592 | 118.8 |
| A | 13 | 6 | 7698 | 59.8 | 602 | 592 | 118.8 |
| B | 5 | 172 | 376080 | 3437.35 | 585 | 572 | 109.2 |
| B | 4 | 171 | 142048 | 1295.05 | 585 | 572 | 109.2 |
| B | 5 | 255 | 69116 | 627.44 | 585 | 572 | 109.2 |
| C | 9 | 187 | 432954 | 3290.56 | 577 | 582 | 131.4 |
| C | 15 | 214 | 206402 | 1566.39 | 577 | 582 | 131.4 |
| C | 0 | 207 | 168948 | 1281.34 | 577 | 582 | 131.4 |
| D | 12 | 6 | 293202 | 2062.94 | 585 | 571 | 141.9 |
| D | 12 | 227 | 268541 | 1889.09 | 585 | 571 | 141.9 |
| D | 12 | 235 | 262522 | 1846.66 | 585 | 571 | 141.9 |
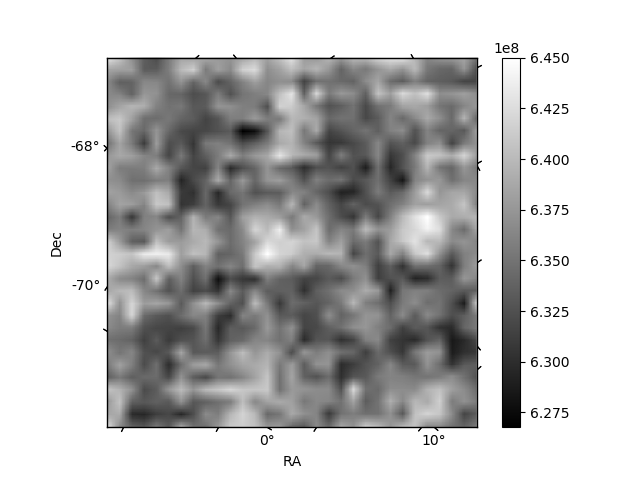
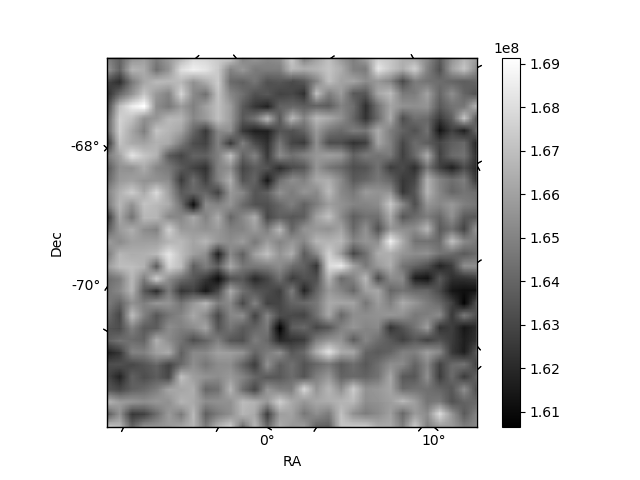
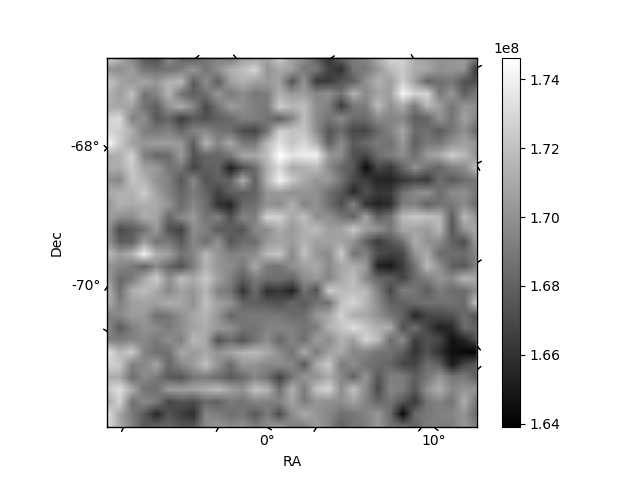
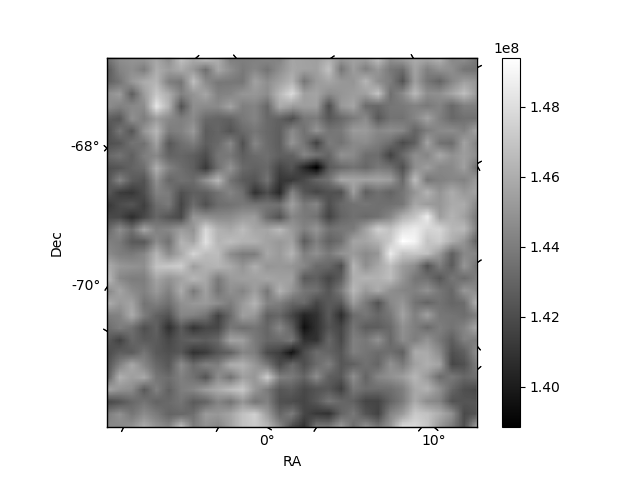
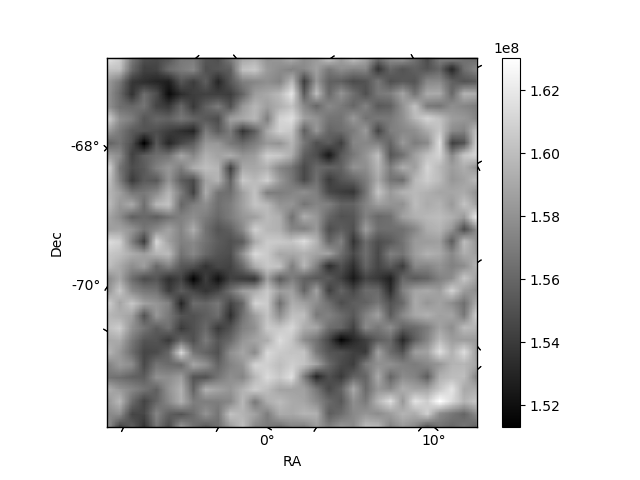
Histogram calculated using DETX and DETY for each event in the final _common_clean file
| Quadrant A | 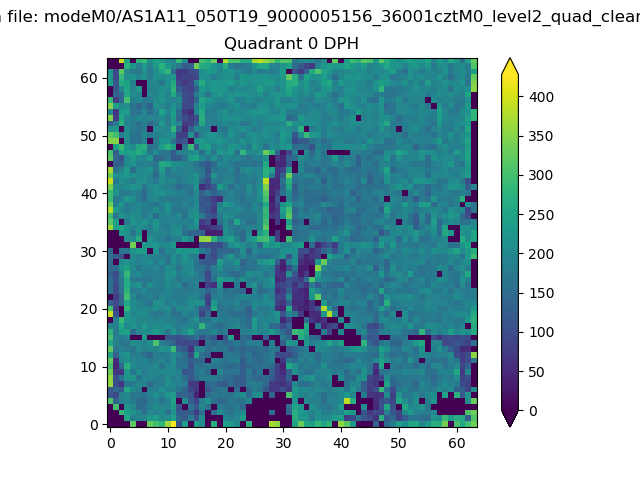 |
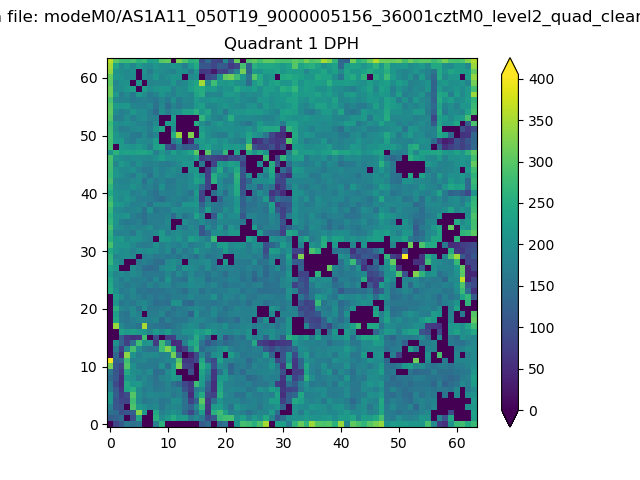 |
Quadrant B |
|---|---|---|---|
| Quadrant D | 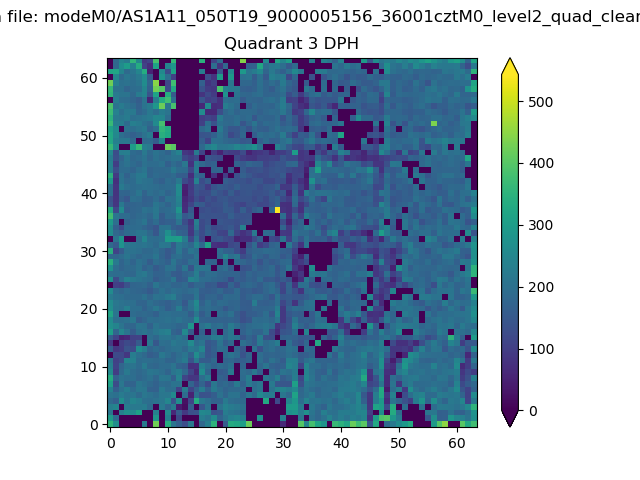 |
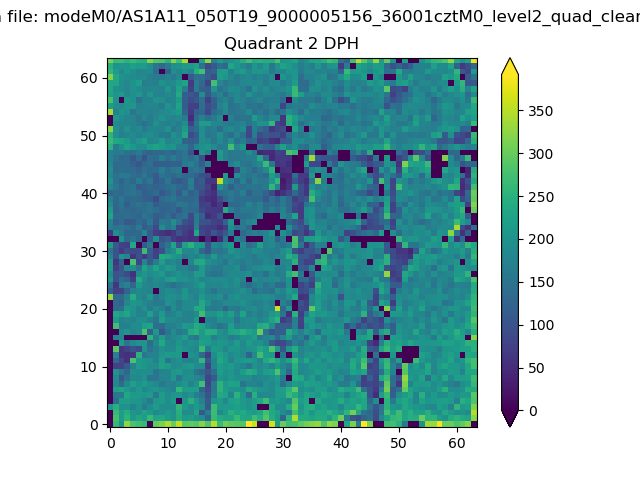 |
Quadrant C |
| Plot type | Count rate plots | Images |
|---|---|---|
| Comparison with Poisson distribution Blue bars denote a histogram of data divided into 1 sec bins. Red curve is a Poisson curve with rate = median count rate of data. |
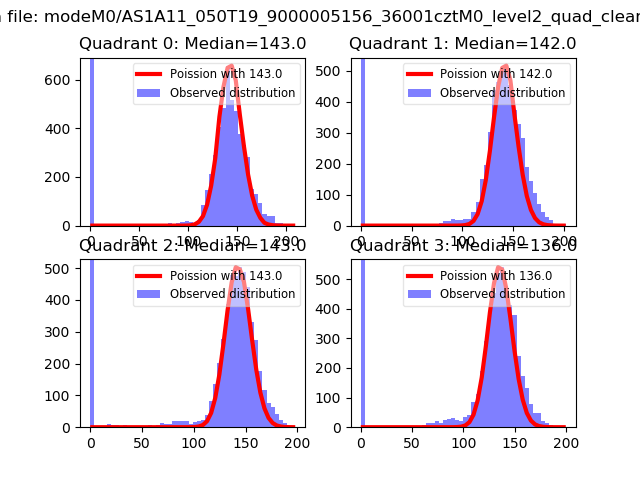 |
 |
| Quadrant-wise count rates Data is divided into 100 sec bins |
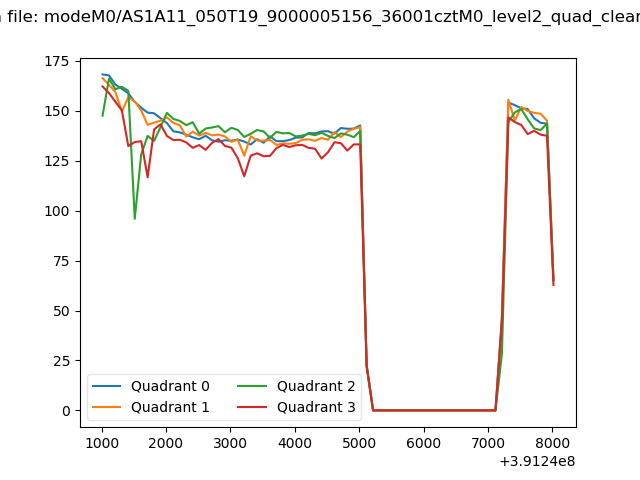 |
|
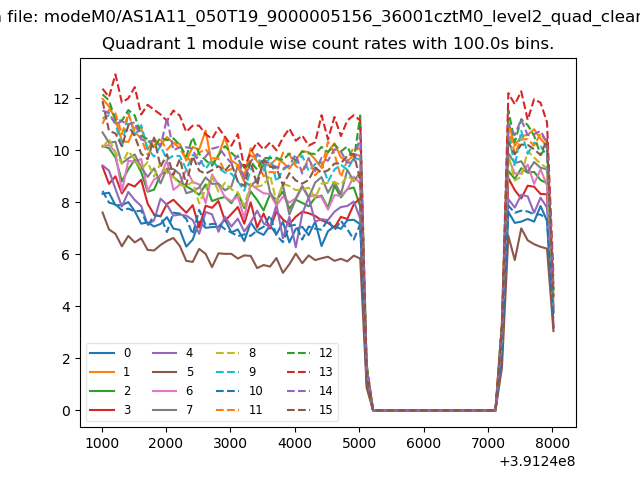
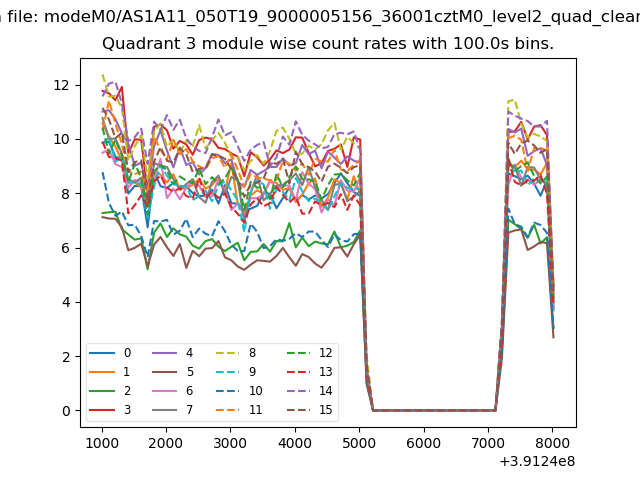
| Module-wise count rates for Quadrant A Data is divided into 100 sec bins |
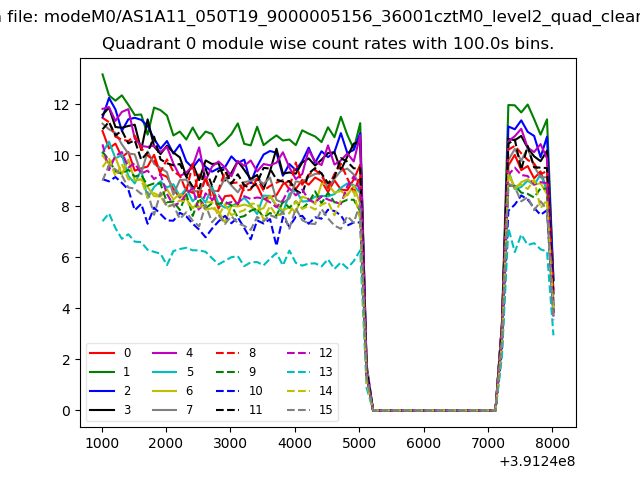 |
 |
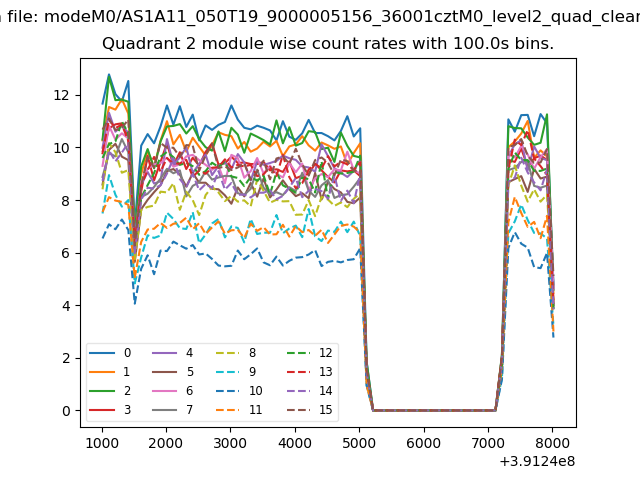
| Module-wise count rates for Quadrant B Data is divided into 100 sec bins |
 |
 |
| Module-wise count rates for Quadrant C Data is divided into 100 sec bins |
 |
 |
| Module-wise count rates for Quadrant D Data is divided into 100 sec bins |
 |
 |
| Parameter | Plot |
|---|---|
| CZT HV Monitor | 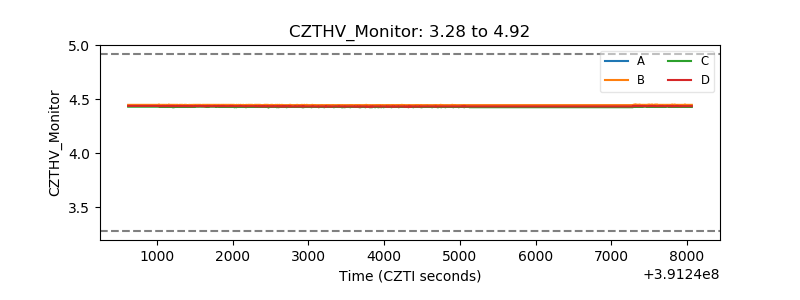 |
| D_VDD | 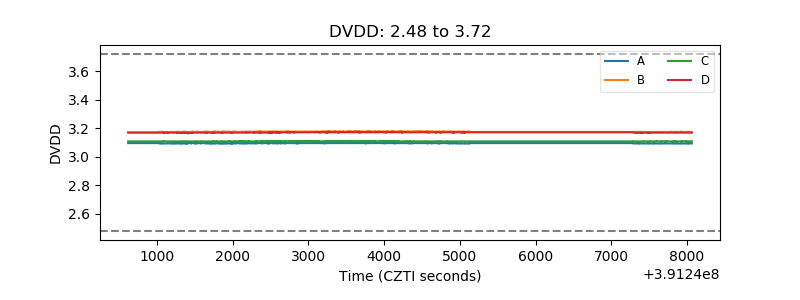 |
| Temperature 1 | 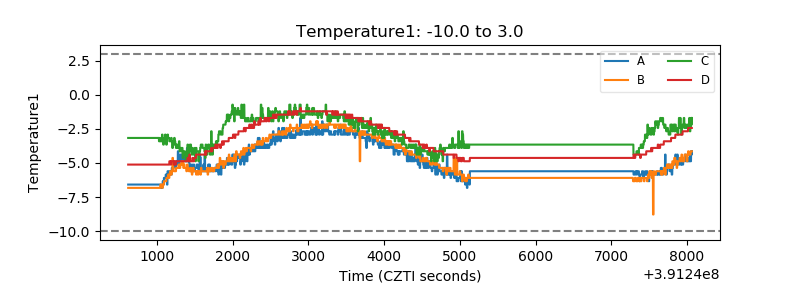 |
| Veto HV Monitor | 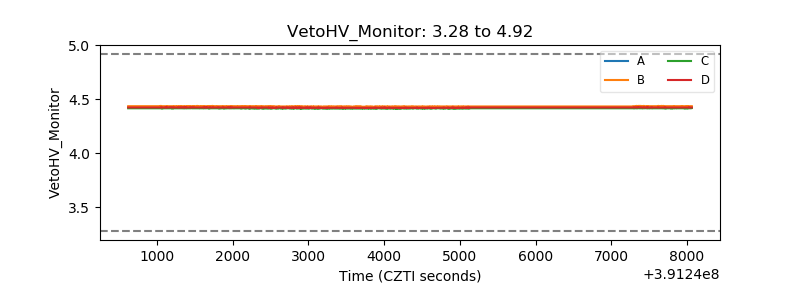 |
| Veto LLD |  |
| Alpha Counter | 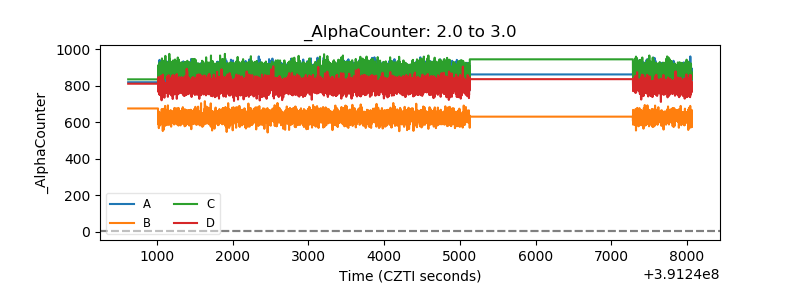 |
| _CPM_Rate | 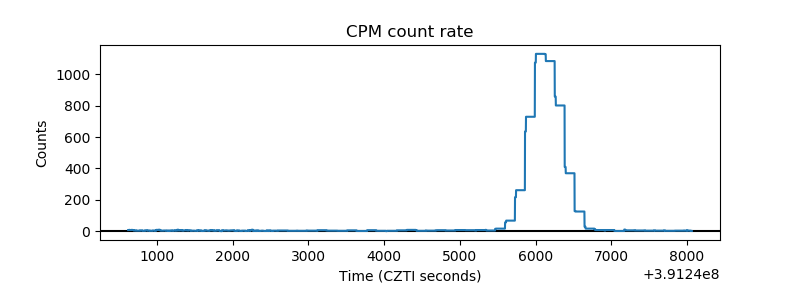 |
| CZT Counter | 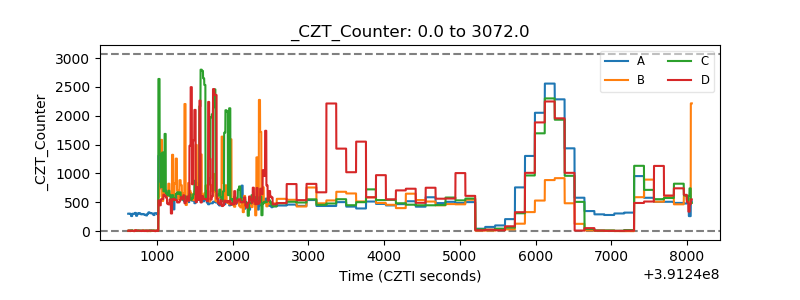 |
| +2.5 Volts monitor | 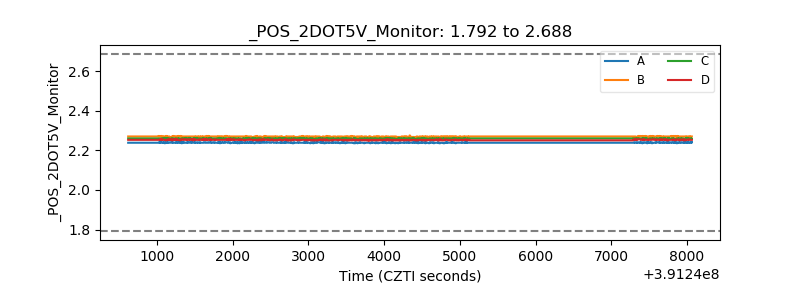 |
| +5 Volts monitor | 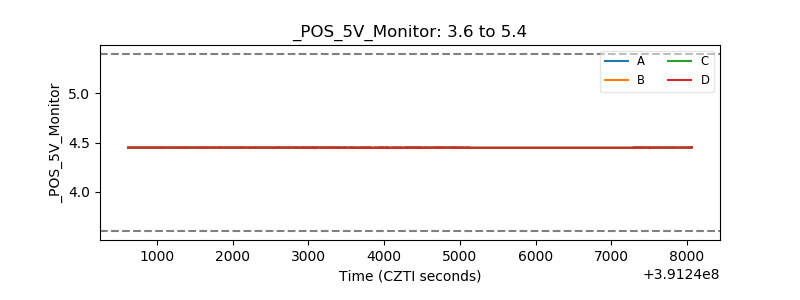 |
| _ROLL_ROT | 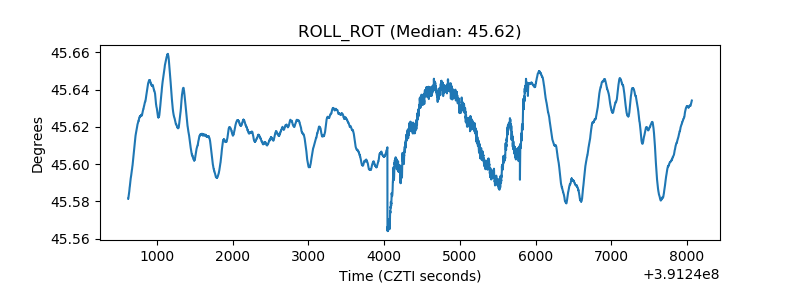 |
| _Roll_DEC | 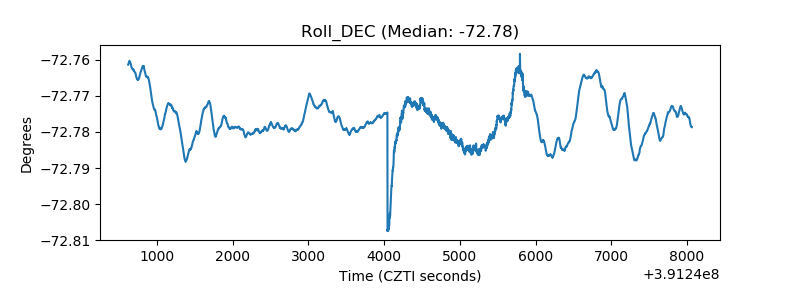 |
| _Roll_RA | 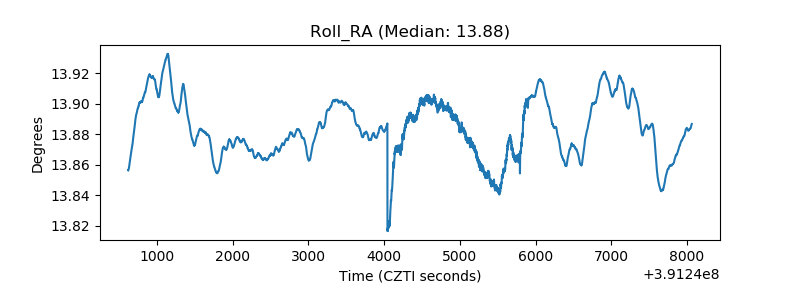 |
| Veto Counter | 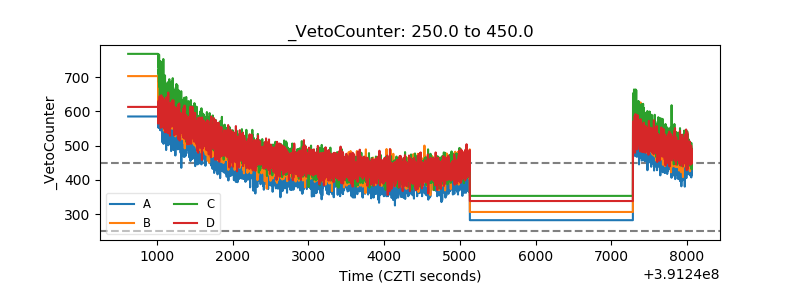 |