| Param | Original file | Final file |
|---|---|---|
| Filename | modeM0/AS1A11_050T19_9000005156_35999cztM0_level2.evt | modeM0/AS1A11_050T19_9000005156_35999cztM0_level2_quad_clean.evt |
| Size (bytes) | 451,454,400 | 106,721,280 |
| Size | 430.5 MB | 101.8 MB |
| Events in quadrant A | 2,607,238 | 728,072 |
| Events in quadrant B | 2,894,197 | 735,713 |
| Events in quadrant C | 3,366,783 | 728,719 |
| Events in quadrant D | 4,456,154 | 680,177 |
| Mode M0 | |||
|---|---|---|---|
| Quadrant | BADHDUFLAG | Total packets | Discarded packets |
| A | 0 | 10835 | 3 |
| B | 0 | 11712 | 2 |
| C | 0 | 13108 | 2 |
| D | 0 | 16725 | 2 |
| Mode SS | |||
|---|---|---|---|
| Quadrant | BADHDUFLAG | Total packets | Discarded packets |
| A | 0 | 104 | 0 |
| B | 0 | 104 | 0 |
| C | 0 | 104 | 0 |
| D | 0 | 104 | 0 |
| Mode M9 | |||
|---|---|---|---|
| Quadrant | BADHDUFLAG | Total packets | Discarded packets |
| A | 0 | 29 | 0 |
| B | 0 | 29 | 0 |
| C | 0 | 29 | 0 |
| D | 0 | 30 | 0 |
| Quadrant | Total seconds | Saturated seconds | Saturation percentage |
|---|---|---|---|
| A | 5132 | 12 | 0.233827% |
| B | 5132 | 79 | 1.539361% |
| C | 5132 | 128 | 2.494154% |
| D | 5132 | 249 | 4.851910% |
Noise dominated data is calculated using 1-second bins in cleaned event files. If a bin has >2000 counts, and if more than 50% of those come from <1% of pixels, then it is considered to be noise-dominated and hence unusable.
| Quadrant | # 1 sec bins | Bins with >0 counts | Bins with >2000 counts | High rate bins dominated by noise | Noise dominated (total time) | Noise dominated (detector-on time) | Marked lightcurve |
|---|---|---|---|---|---|---|---|
| A | 7105 | 5133 | 0 | 0 | 0.00% | 0.00% | 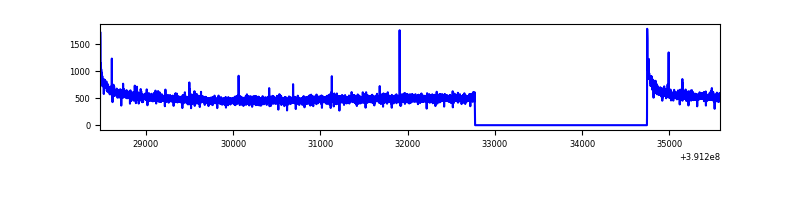 |
| B | 7105 | 5133 | 51 | 51 | 0.72% | 0.99% | 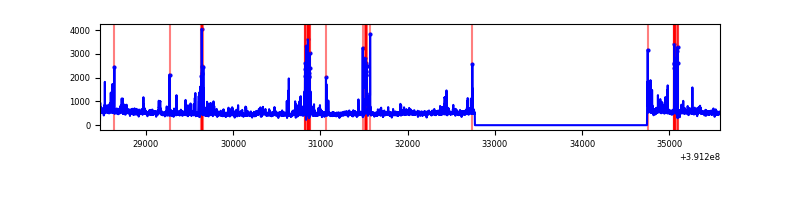 |
| C | 7105 | 5133 | 107 | 107 | 1.51% | 2.08% | 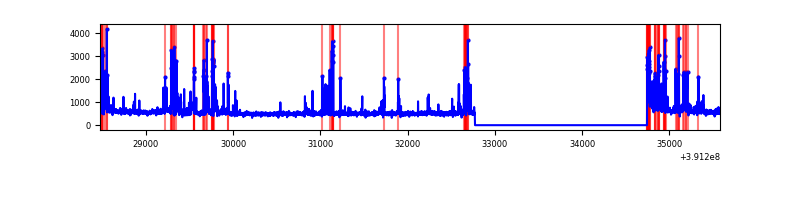 |
| D | 7105 | 5133 | 229 | 229 | 3.22% | 4.46% | 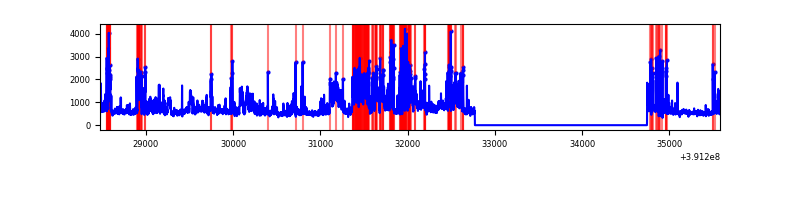 |
Top three noisy pixels from each quadrant. If the there are fewer than three noisy pixels in the level2.evt file, extra rows are filled as -1
| Pixel properties | Quadrant properties | ||||||
|---|---|---|---|---|---|---|---|
| Quadrant | DetID | PixID | Counts | Sigma | Mean | Median | Sigma |
| A | 10 | 83 | 162795 | 1296.43 | 629 | 617 | 125.1 |
| A | 13 | 254 | 7406 | 54.27 | 629 | 617 | 125.1 |
| A | 7 | 191 | 6100 | 43.83 | 629 | 617 | 125.1 |
| B | 5 | 172 | 261144 | 2241.33 | 620 | 604 | 116.2 |
| B | 4 | 171 | 114519 | 979.97 | 620 | 604 | 116.2 |
| B | 5 | 255 | 43286 | 367.18 | 620 | 604 | 116.2 |
| C | 0 | 207 | 428894 | 3008.21 | 621 | 626 | 142.4 |
| C | 15 | 214 | 215208 | 1507.25 | 621 | 626 | 142.4 |
| C | 9 | 187 | 175778 | 1230.29 | 621 | 626 | 142.4 |
| D | 12 | 227 | 1115096 | 7476.47 | 616 | 600 | 149.1 |
| D | 10 | 118 | 284597 | 1905.16 | 616 | 600 | 149.1 |
| D | 12 | 235 | 209609 | 1402.11 | 616 | 600 | 149.1 |
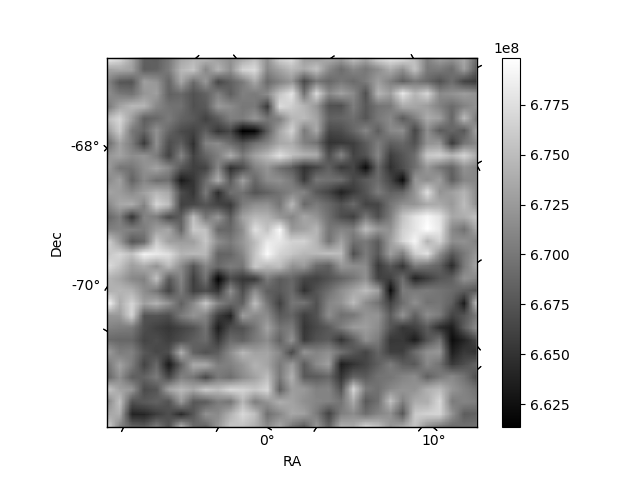
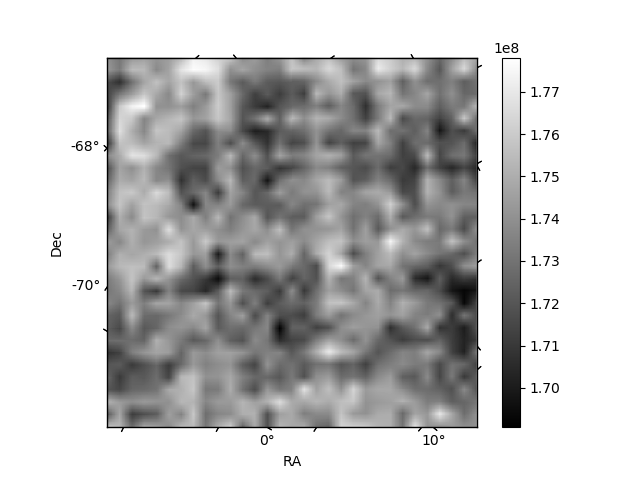
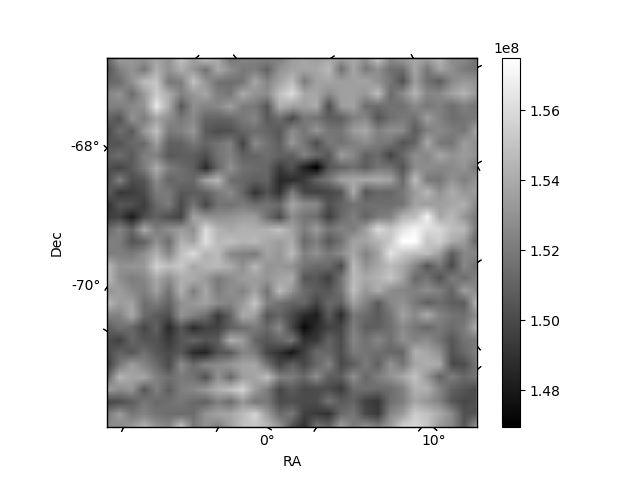
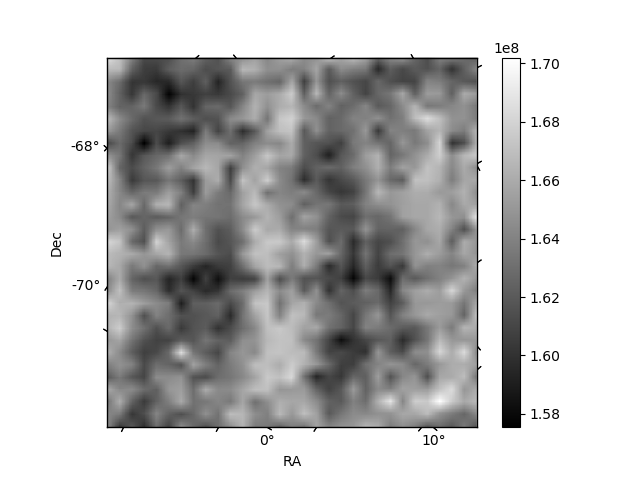
Histogram calculated using DETX and DETY for each event in the final _common_clean file
| Quadrant A | 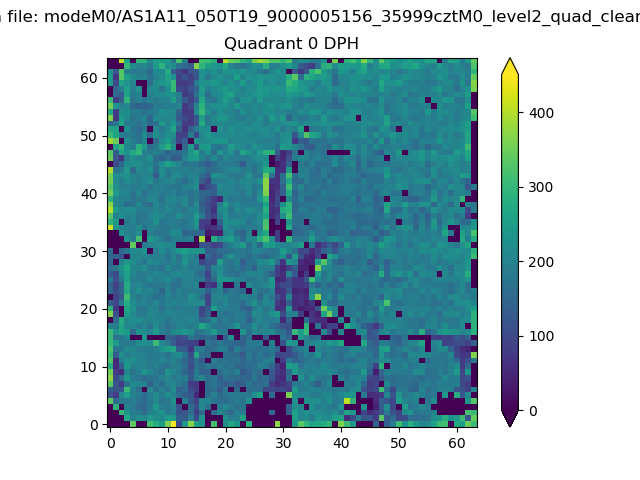 |
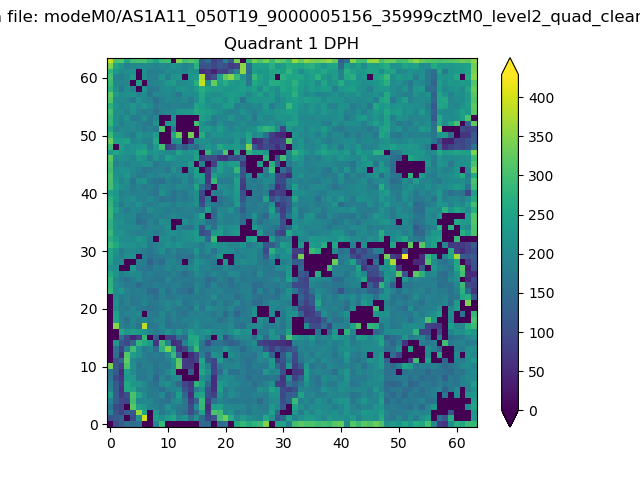 |
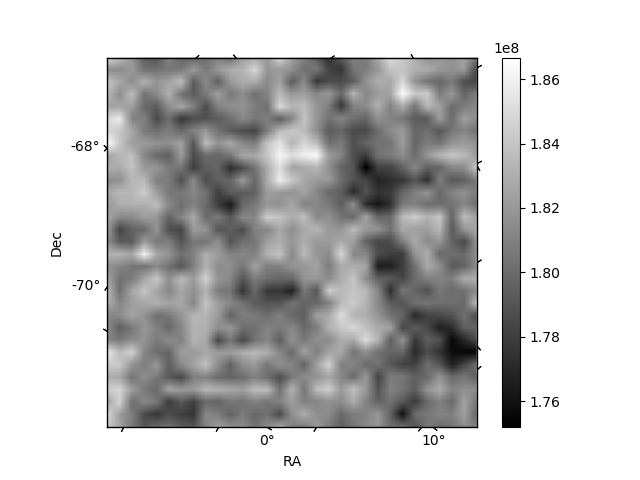
Quadrant B |
|---|---|---|---|
| Quadrant D | 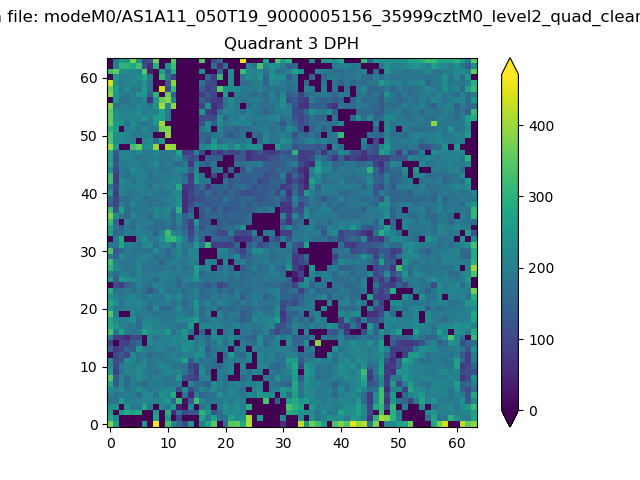 |
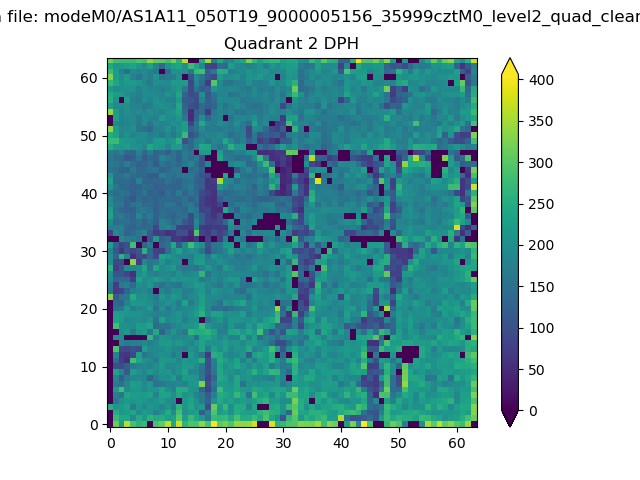 |
Quadrant C |
| Plot type | Count rate plots | Images |
|---|---|---|
| Comparison with Poisson distribution Blue bars denote a histogram of data divided into 1 sec bins. Red curve is a Poisson curve with rate = median count rate of data. |
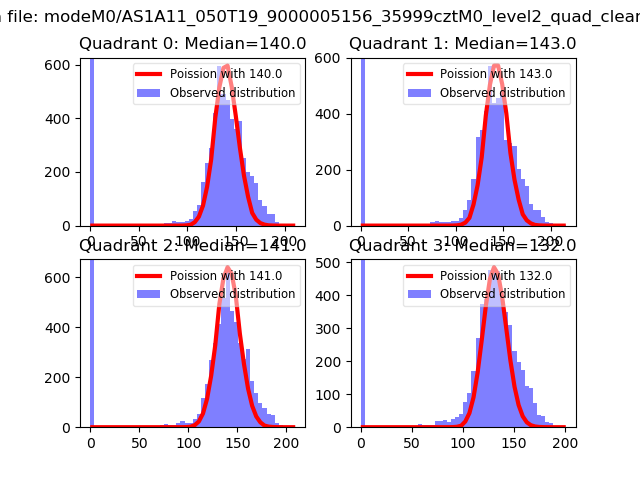 |
 |
| Quadrant-wise count rates Data is divided into 100 sec bins |
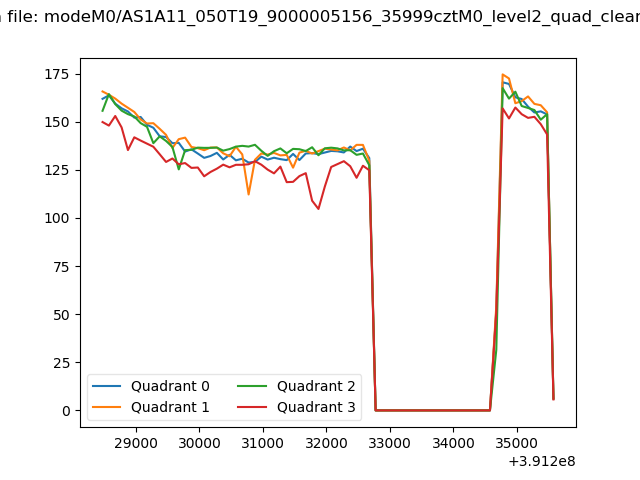 |
|
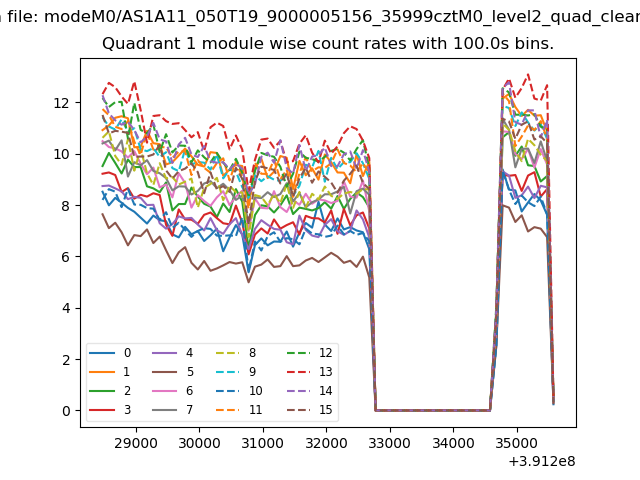
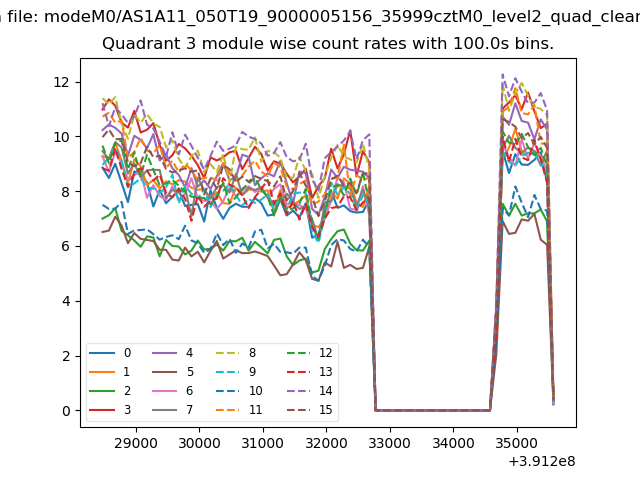
| Module-wise count rates for Quadrant A Data is divided into 100 sec bins |
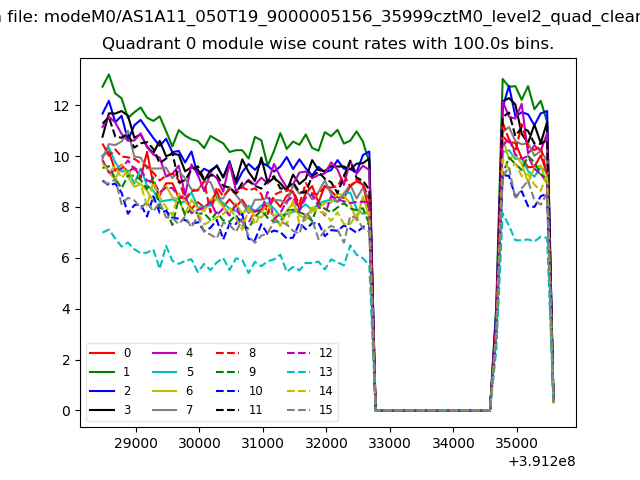 |
 |
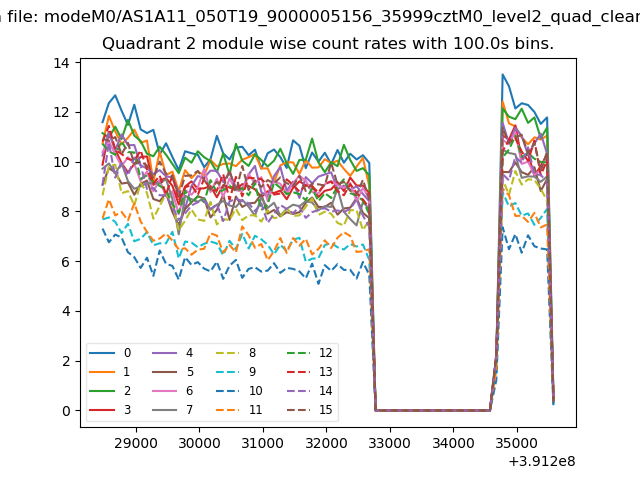
| Module-wise count rates for Quadrant B Data is divided into 100 sec bins |
 |
 |
| Module-wise count rates for Quadrant C Data is divided into 100 sec bins |
 |
 |
| Module-wise count rates for Quadrant D Data is divided into 100 sec bins |
 |
 |
| Parameter | Plot |
|---|---|
| CZT HV Monitor | 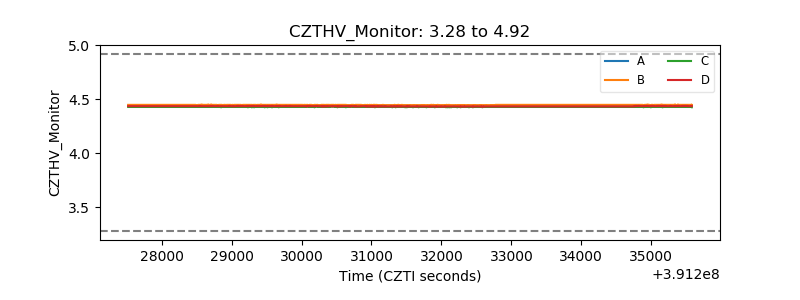 |
| D_VDD | 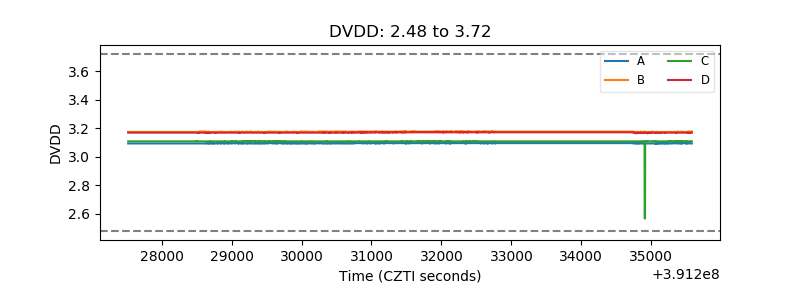 |
| Temperature 1 | 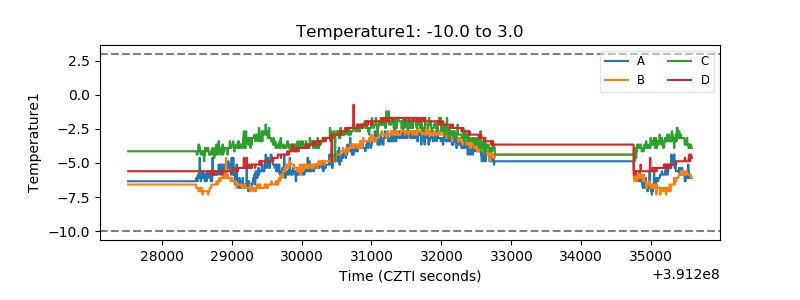 |
| Veto HV Monitor | 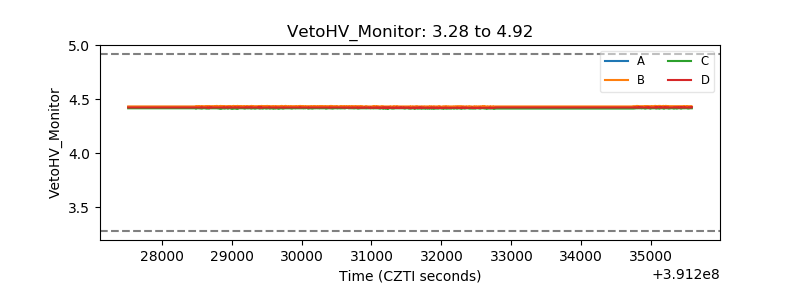 |
| Veto LLD | 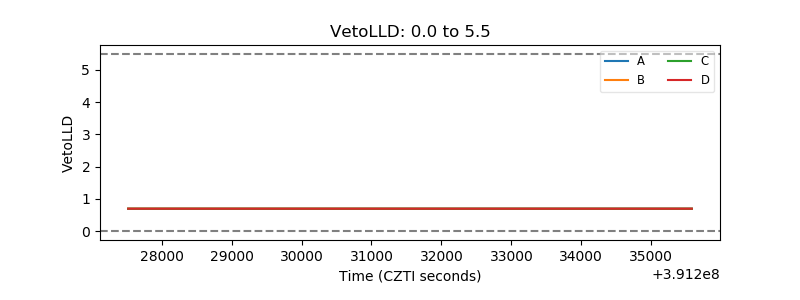 |
| Alpha Counter | 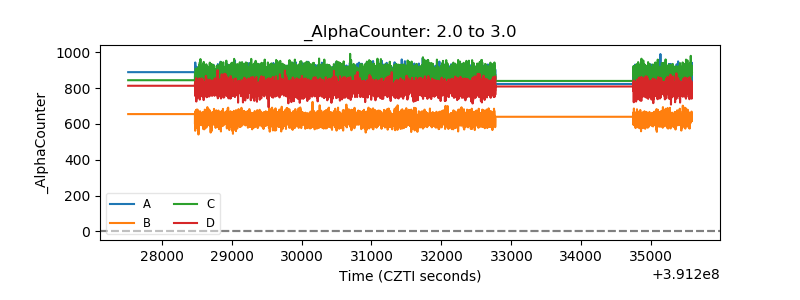 |
| _CPM_Rate | 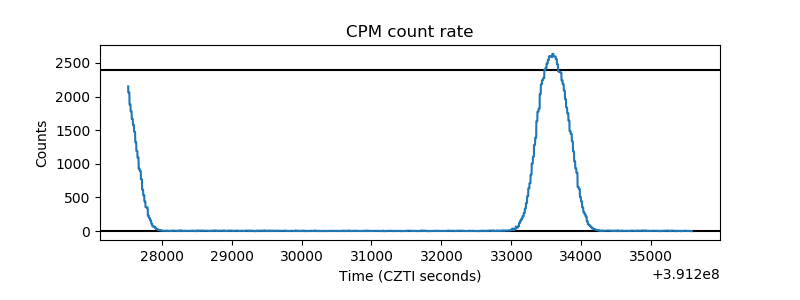 |
| CZT Counter | 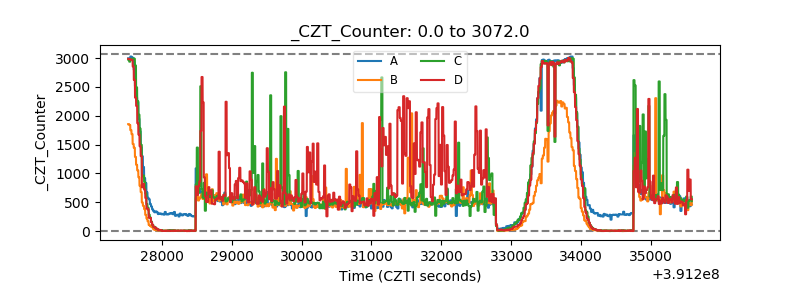 |
| +2.5 Volts monitor | 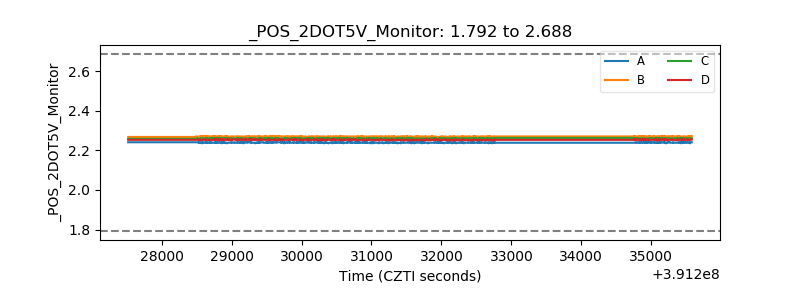 |
| +5 Volts monitor | 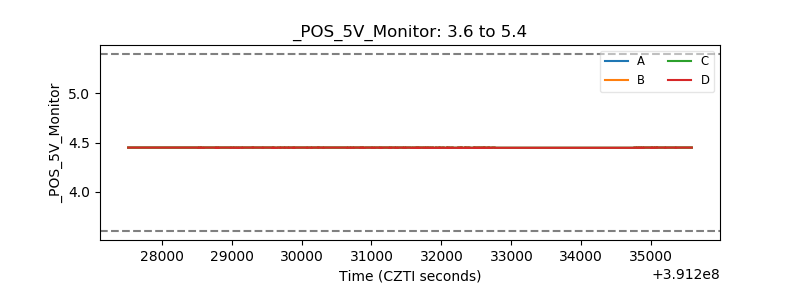 |
| _ROLL_ROT | 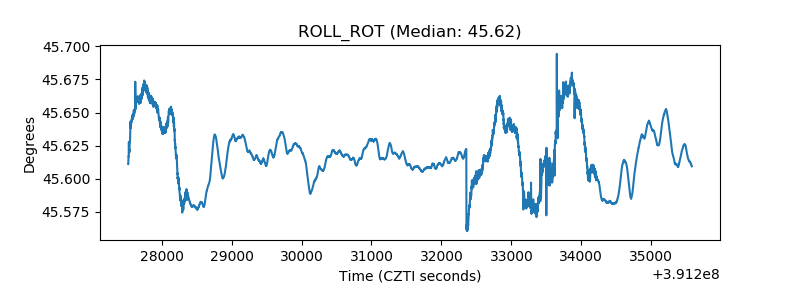 |
| _Roll_DEC | 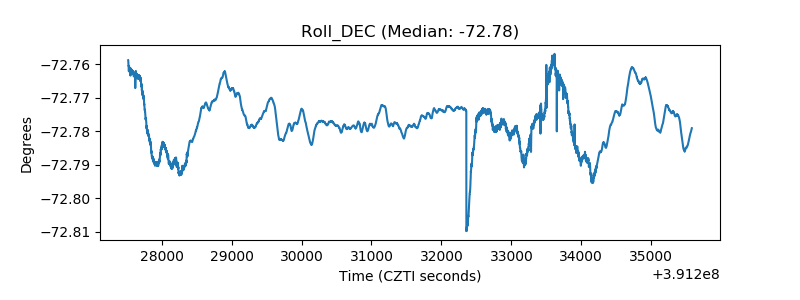 |
| _Roll_RA | 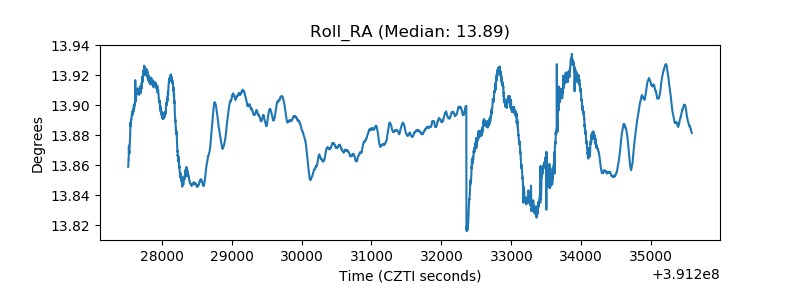 |
| Veto Counter | 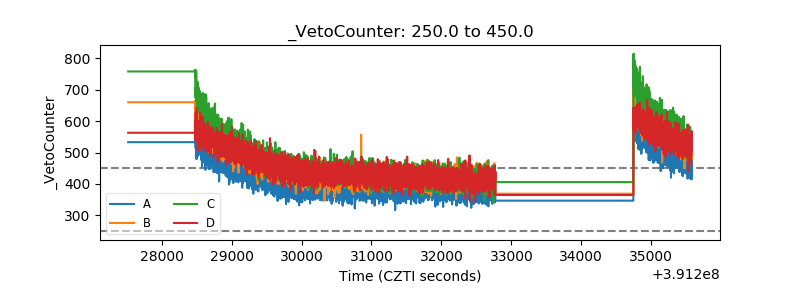 |