| Param | Original file | Final file |
|---|---|---|
| Filename | modeM0/AS1A11_050T19_9000005156_35988cztM0_level2.evt | modeM0/AS1A11_050T19_9000005156_35988cztM0_level2_quad_clean.evt |
| Size (bytes) | 2,082,265,920 | 213,076,800 |
| Size | 1.9 GB | 203.2 MB |
| Events in quadrant A | 6,225,128 | 1,743,256 |
| Events in quadrant B | 25,403,472 | 865,892 |
| Events in quadrant C | 17,383,948 | 1,354,506 |
| Events in quadrant D | 13,193,144 | 1,599,154 |
| Mode M0 | |||
|---|---|---|---|
| Quadrant | BADHDUFLAG | Total packets | Discarded packets |
| A | 0 | 26272 | 4 |
| B | 0 | 84031 | 8 |
| C | 0 | 60080 | 3 |
| D | 0 | 48215 | 3 |
| Mode SS | |||
|---|---|---|---|
| Quadrant | BADHDUFLAG | Total packets | Discarded packets |
| A | 0 | 262 | 0 |
| B | 0 | 262 | 0 |
| C | 0 | 262 | 0 |
| D | 0 | 262 | 0 |
| Mode M9 | |||
|---|---|---|---|
| Quadrant | BADHDUFLAG | Total packets | Discarded packets |
| A | 0 | 64 | 0 |
| B | 0 | 64 | 0 |
| C | 0 | 64 | 0 |
| D | 0 | 64 | 0 |
| Quadrant | Total seconds | Saturated seconds | Saturation percentage |
|---|---|---|---|
| A | 12771 | 15 | 0.117454% |
| B | 12772 | 8817 | 69.033824% |
| C | 12860 | 4381 | 34.066874% |
| D | 12807 | 1341 | 10.470836% |
Noise dominated data is calculated using 1-second bins in cleaned event files. If a bin has >2000 counts, and if more than 50% of those come from <1% of pixels, then it is considered to be noise-dominated and hence unusable.
| Quadrant | # 1 sec bins | Bins with >0 counts | Bins with >2000 counts | High rate bins dominated by noise | Noise dominated (total time) | Noise dominated (detector-on time) | Marked lightcurve |
|---|---|---|---|---|---|---|---|
| A | 19199 | 12775 | 0 | 0 | 0.00% | 0.00% | 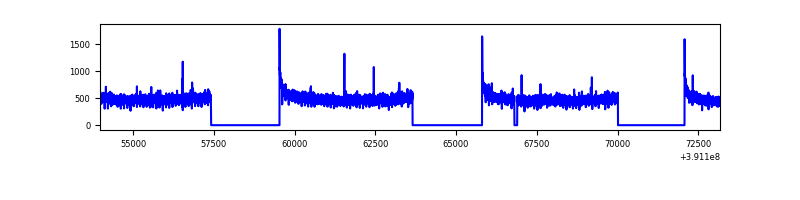 |
| B | 19199 | 12773 | 8611 | 8611 | 44.85% | 67.42% | 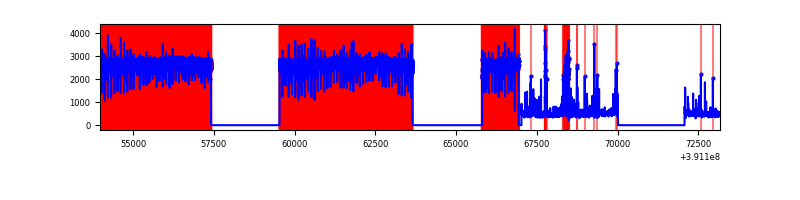 |
| C | 19199 | 12863 | 4106 | 4106 | 21.39% | 31.92% | 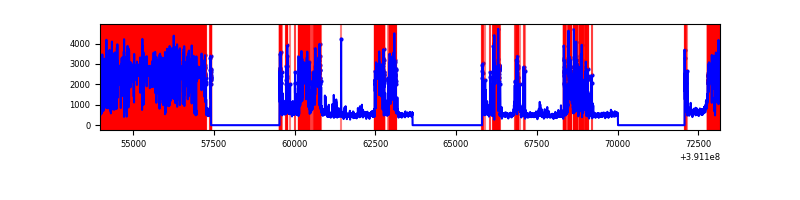 |
| D | 19199 | 12811 | 978 | 978 | 5.09% | 7.63% | 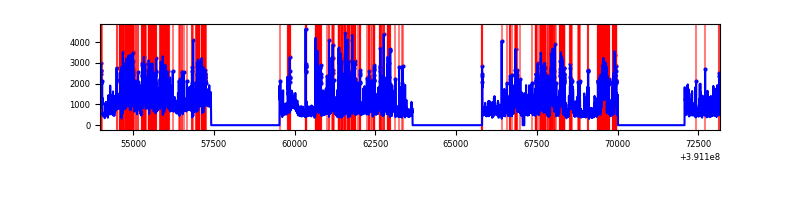 |
Top three noisy pixels from each quadrant. If the there are fewer than three noisy pixels in the level2.evt file, extra rows are filled as -1
| Pixel properties | Quadrant properties | ||||||
|---|---|---|---|---|---|---|---|
| Quadrant | DetID | PixID | Counts | Sigma | Mean | Median | Sigma |
| A | 10 | 83 | 329256 | 1090.65 | 1521 | 1493 | 300.5 |
| A | 13 | 254 | 20373 | 62.82 | 1521 | 1493 | 300.5 |
| A | 3 | 137 | 14824 | 44.36 | 1521 | 1493 | 300.5 |
| B | 5 | 31 | 9363114 | 62386.7 | 806 | 787 | 150.1 |
| B | 5 | 15 | 8341049 | 55576.08 | 806 | 787 | 150.1 |
| B | 5 | 14 | 3268597 | 21775.34 | 806 | 787 | 150.1 |
| C | 9 | 187 | 11855779 | 43723.47 | 1189 | 1199 | 271.1 |
| C | 15 | 214 | 436561 | 1605.75 | 1189 | 1199 | 271.1 |
| C | 0 | 207 | 259974 | 954.44 | 1189 | 1199 | 271.1 |
| D | 1 | 52 | 4307912 | 12360.88 | 1447 | 1411 | 348.4 |
| D | 12 | 227 | 784969 | 2249.03 | 1447 | 1411 | 348.4 |
| D | 12 | 6 | 531084 | 1520.31 | 1447 | 1411 | 348.4 |
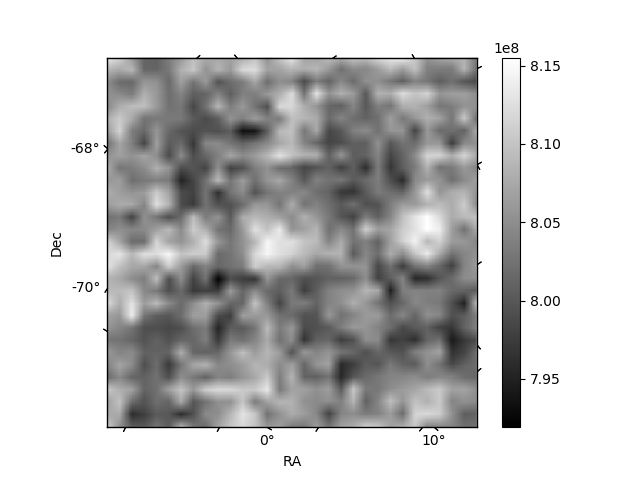
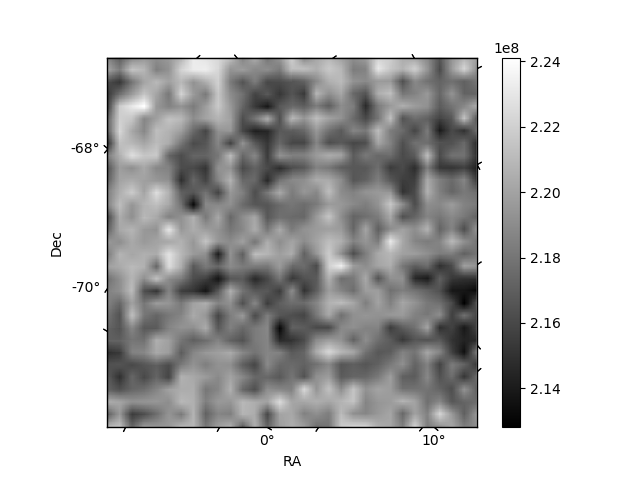
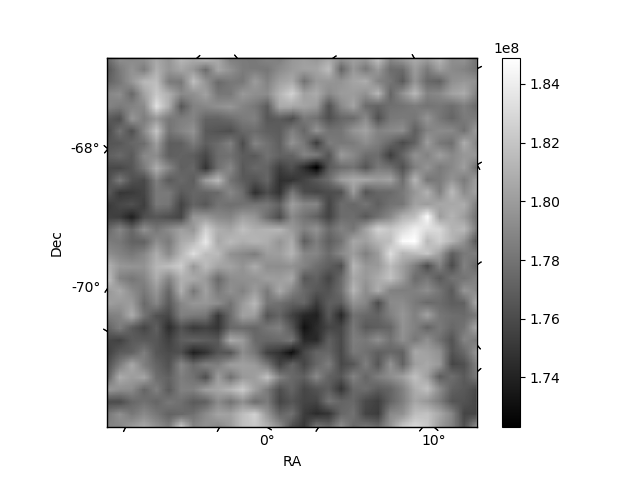
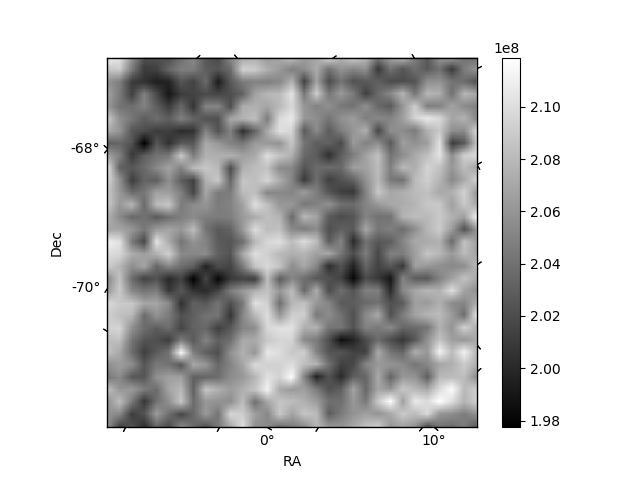
Histogram calculated using DETX and DETY for each event in the final _common_clean file
| Quadrant A | 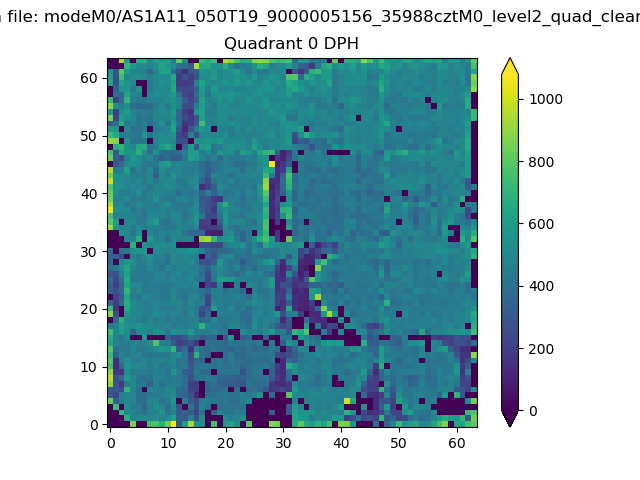 |
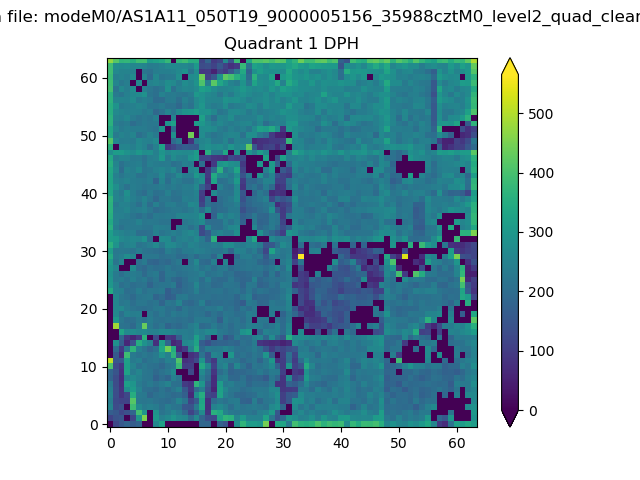 |
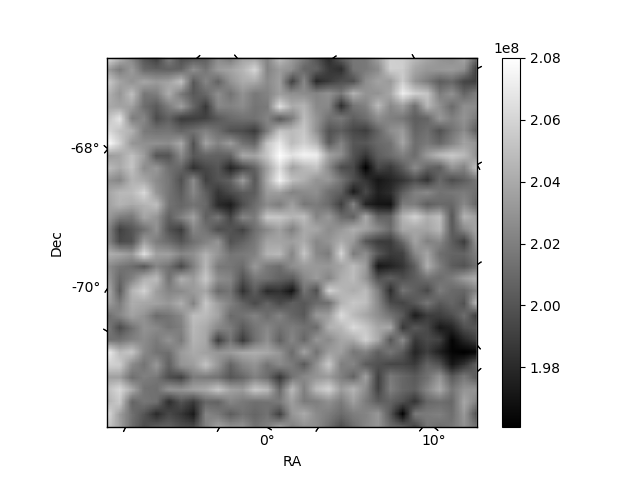
Quadrant B |
|---|---|---|---|
| Quadrant D | 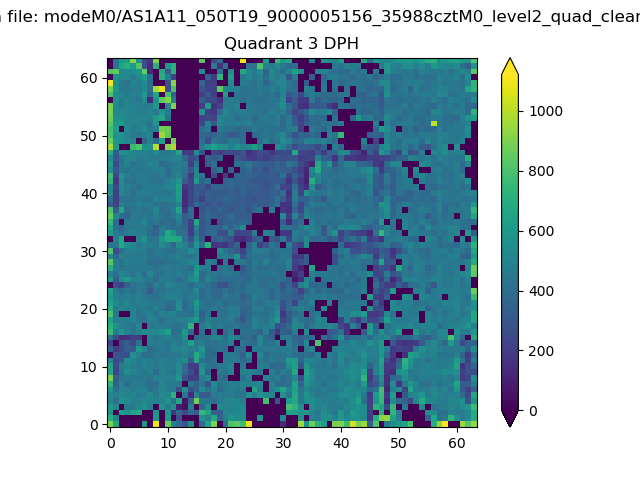 |
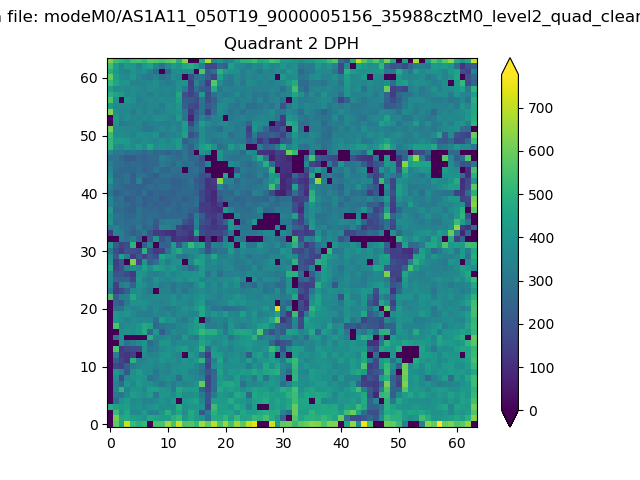 |
Quadrant C |
| Plot type | Count rate plots | Images |
|---|---|---|
| Comparison with Poisson distribution Blue bars denote a histogram of data divided into 1 sec bins. Red curve is a Poisson curve with rate = median count rate of data. |
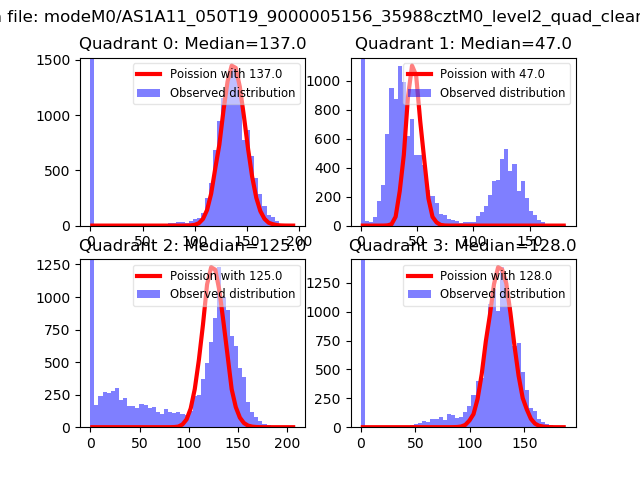 |
 |
| Quadrant-wise count rates Data is divided into 100 sec bins |
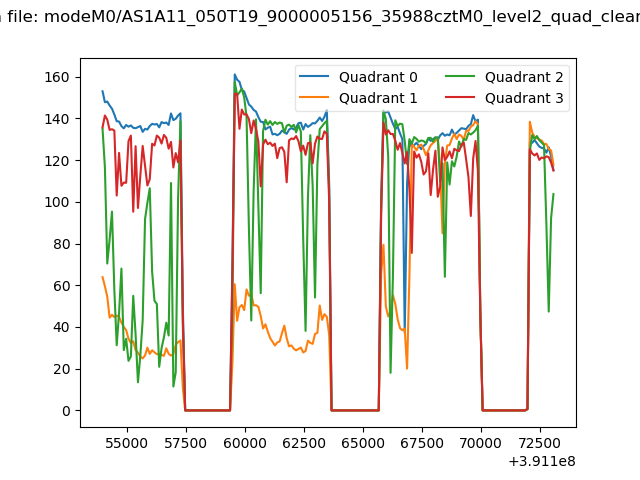 |
|
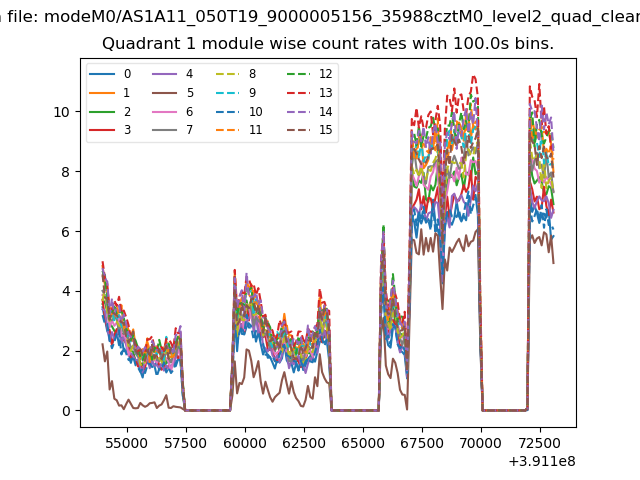
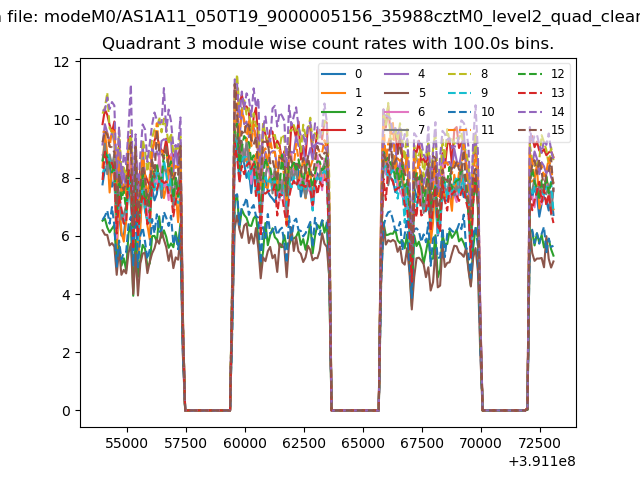
| Module-wise count rates for Quadrant A Data is divided into 100 sec bins |
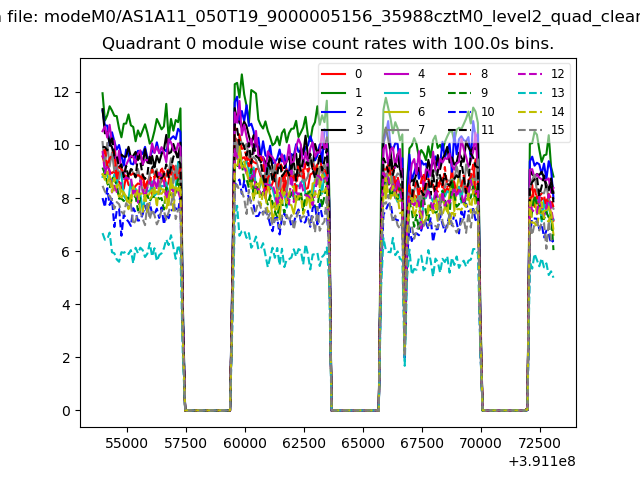 |
 |
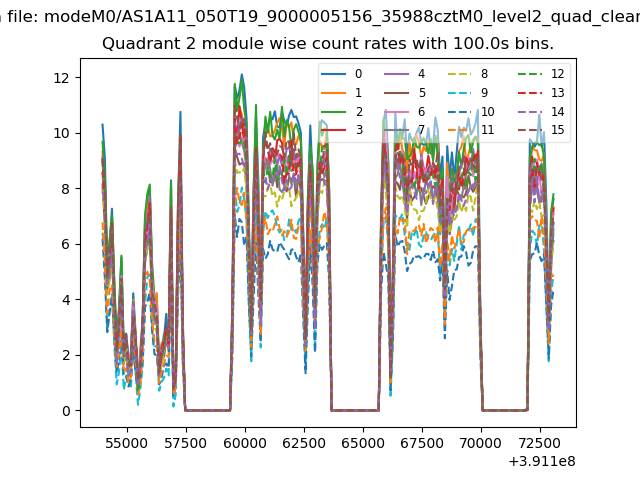
| Module-wise count rates for Quadrant B Data is divided into 100 sec bins |
 |
 |
| Module-wise count rates for Quadrant C Data is divided into 100 sec bins |
 |
 |
| Module-wise count rates for Quadrant D Data is divided into 100 sec bins |
 |
 |
| Parameter | Plot |
|---|---|
| CZT HV Monitor | 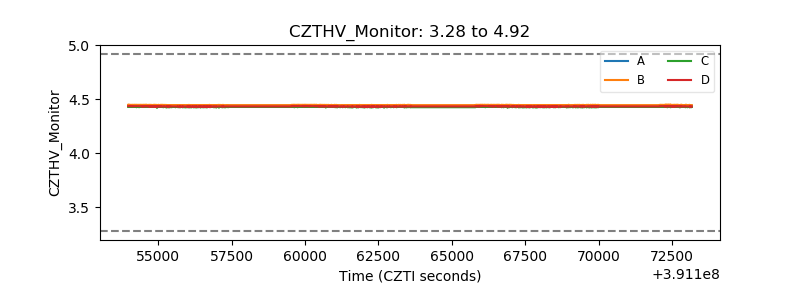 |
| D_VDD | 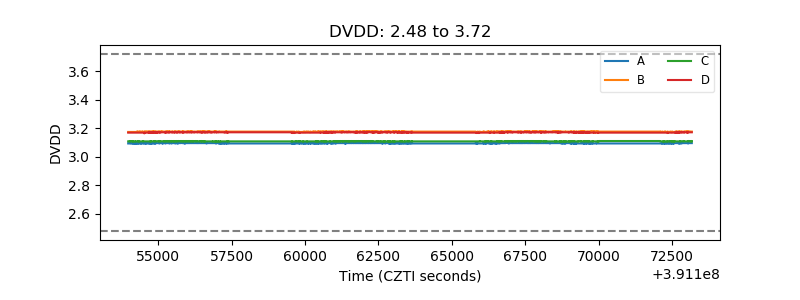 |
| Temperature 1 | 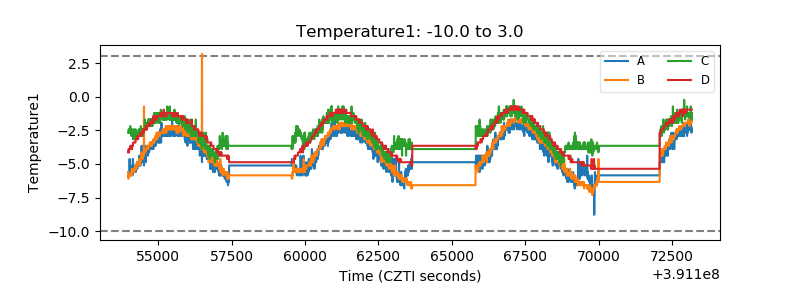 |
| Veto HV Monitor | 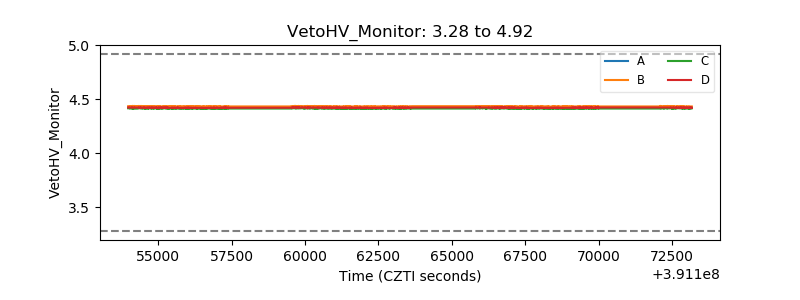 |
| Veto LLD | 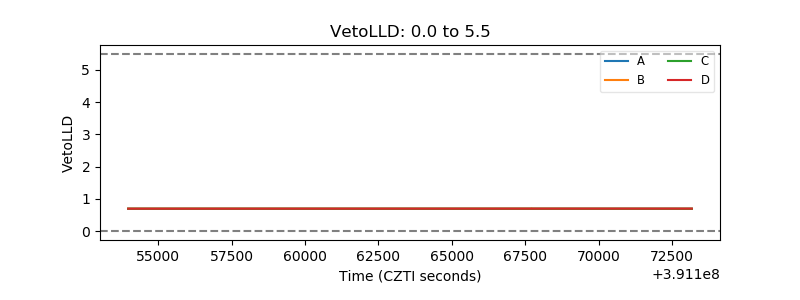 |
| Alpha Counter | 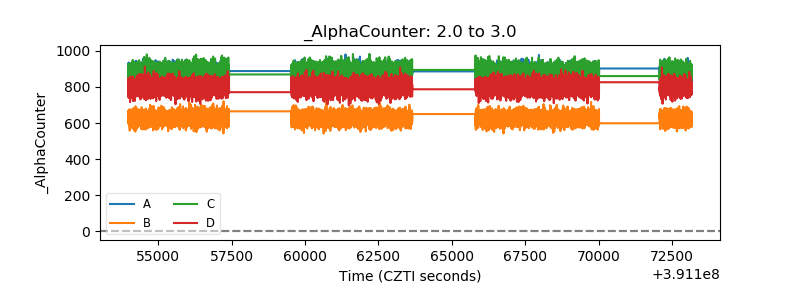 |
| _CPM_Rate | 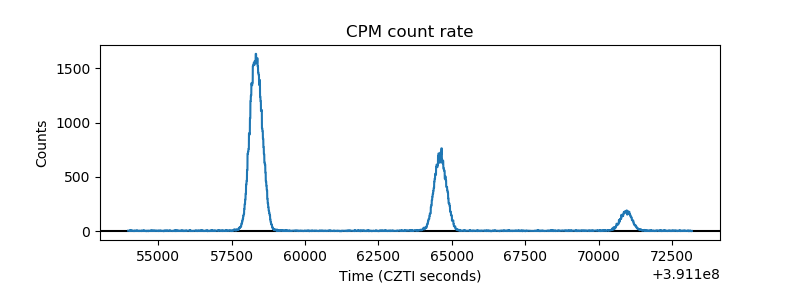 |
| CZT Counter | 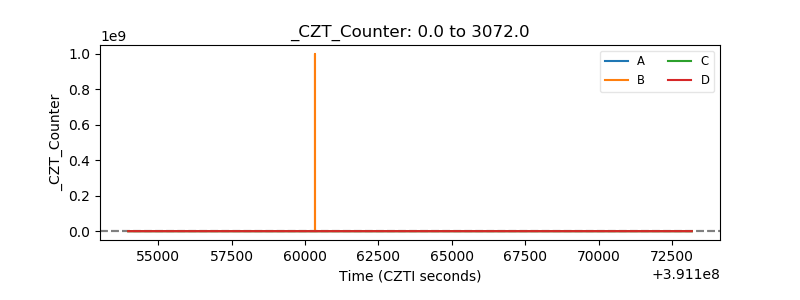 |
| +2.5 Volts monitor | 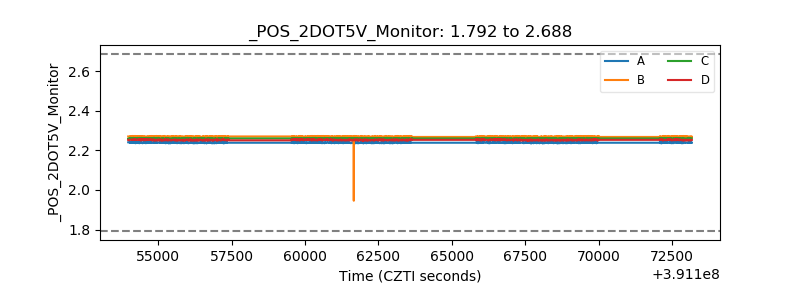 |
| +5 Volts monitor | 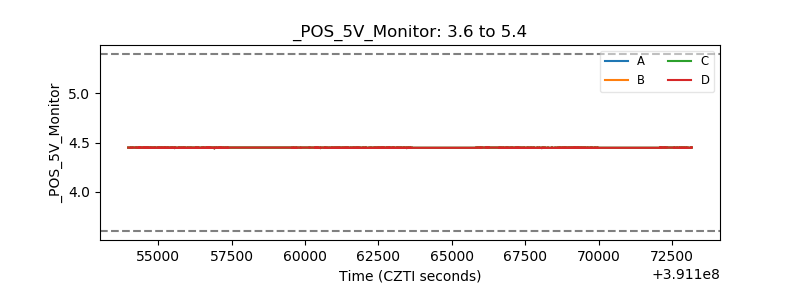 |
| _ROLL_ROT | 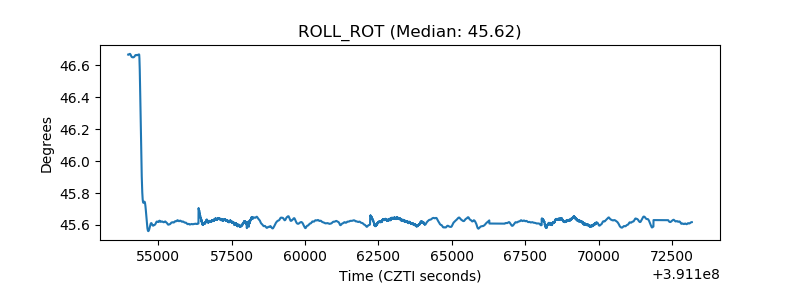 |
| _Roll_DEC | 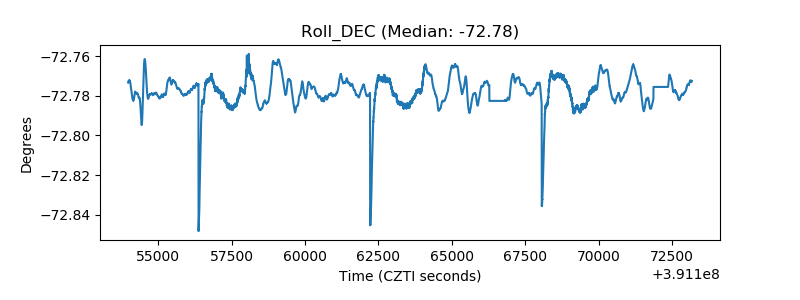 |
| _Roll_RA | 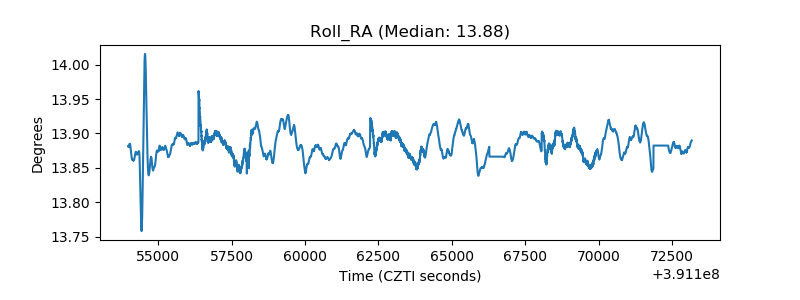 |
| Veto Counter | 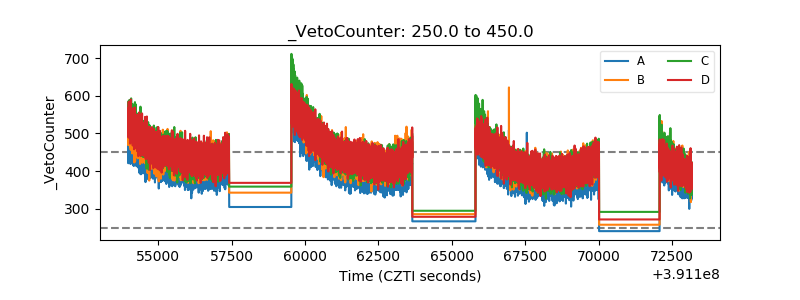 |