| Param | Original file | Final file |
|---|---|---|
| Filename | modeM0/AS1A11_050T19_9000005156_35976cztM0_level2.evt | modeM0/AS1A11_050T19_9000005156_35976cztM0_level2_quad_clean.evt |
| Size (bytes) | 895,642,560 | 83,531,520 |
| Size | 854.2 MB | 79.7 MB |
| Events in quadrant A | 2,573,296 | 680,991 |
| Events in quadrant B | 14,501,444 | 207,536 |
| Events in quadrant C | 4,024,796 | 641,672 |
| Events in quadrant D | 5,653,153 | 610,151 |
| Mode M0 | |||
|---|---|---|---|
| Quadrant | BADHDUFLAG | Total packets | Discarded packets |
| A | 0 | 11249 | 2 |
| B | 0 | 46853 | 1 |
| C | 0 | 15486 | 1 |
| D | 0 | 20543 | 1 |
| Mode SS | |||
|---|---|---|---|
| Quadrant | BADHDUFLAG | Total packets | Discarded packets |
| A | 0 | 114 | 0 |
| B | 0 | 114 | 0 |
| C | 0 | 114 | 0 |
| D | 0 | 114 | 0 |
| Mode M9 | |||
|---|---|---|---|
| Quadrant | BADHDUFLAG | Total packets | Discarded packets |
| A | 0 | 13 | 0 |
| B | 0 | 13 | 0 |
| C | 0 | 13 | 0 |
| D | 0 | 13 | 0 |
| Quadrant | Total seconds | Saturated seconds | Saturation percentage |
|---|---|---|---|
| A | 5511 | 11 | 0.199601% |
| B | 5511 | 5510 | 99.981854% |
| C | 5511 | 342 | 6.205770% |
| D | 5511 | 649 | 11.776447% |
Noise dominated data is calculated using 1-second bins in cleaned event files. If a bin has >2000 counts, and if more than 50% of those come from <1% of pixels, then it is considered to be noise-dominated and hence unusable.
| Quadrant | # 1 sec bins | Bins with >0 counts | Bins with >2000 counts | High rate bins dominated by noise | Noise dominated (total time) | Noise dominated (detector-on time) | Marked lightcurve |
|---|---|---|---|---|---|---|---|
| A | 6854 | 5512 | 1 | 1 | 0.01% | 0.02% | 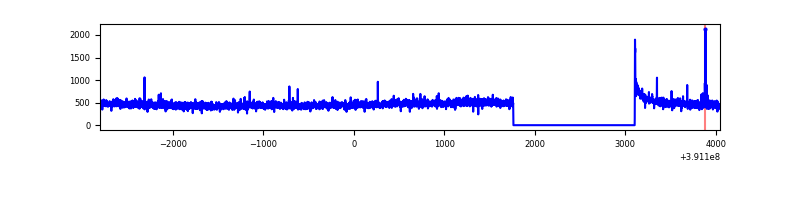 |
| B | 6853 | 5510 | 5357 | 5357 | 78.17% | 97.22% | 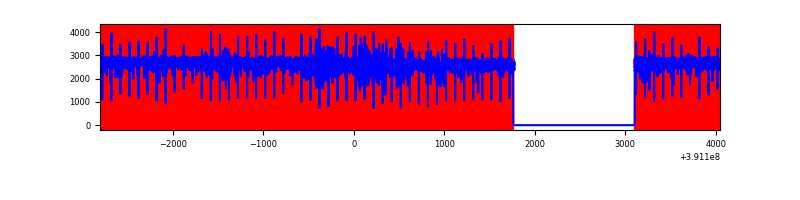 |
| C | 6854 | 5512 | 312 | 312 | 4.55% | 5.66% | 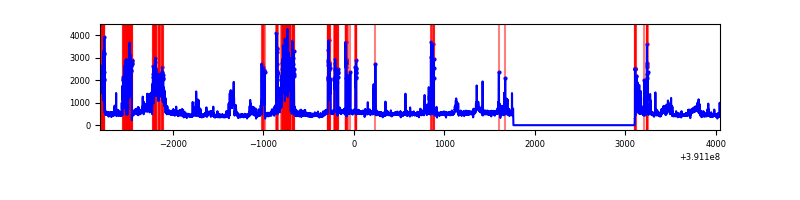 |
| D | 6854 | 5512 | 603 | 603 | 8.80% | 10.94% | 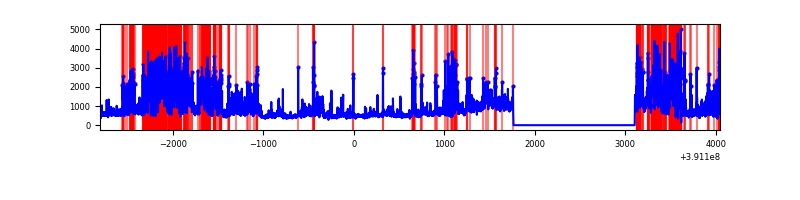 |
Top three noisy pixels from each quadrant. If the there are fewer than three noisy pixels in the level2.evt file, extra rows are filled as -1
| Pixel properties | Quadrant properties | ||||||
|---|---|---|---|---|---|---|---|
| Quadrant | DetID | PixID | Counts | Sigma | Mean | Median | Sigma |
| A | 10 | 83 | 134538 | 1079.59 | 617 | 605 | 124.1 |
| A | 15 | 169 | 30745 | 242.95 | 617 | 605 | 124.1 |
| A | 7 | 3 | 15011 | 116.12 | 617 | 605 | 124.1 |
| B | 5 | 31 | 7098199 | 160387.55 | 224 | 219 | 44.3 |
| B | 5 | 15 | 5115239 | 115580.14 | 224 | 219 | 44.3 |
| B | 5 | 14 | 901625 | 20368.37 | 224 | 219 | 44.3 |
| C | 9 | 187 | 1423957 | 10694.27 | 577 | 582 | 133.1 |
| C | 15 | 214 | 218851 | 1639.92 | 577 | 582 | 133.1 |
| C | 0 | 10 | 80131 | 597.68 | 577 | 582 | 133.1 |
| D | 13 | 249 | 843779 | 6037.78 | 574 | 557 | 139.7 |
| D | 12 | 17 | 752851 | 5386.7 | 574 | 557 | 139.7 |
| D | 1 | 52 | 746441 | 5340.81 | 574 | 557 | 139.7 |
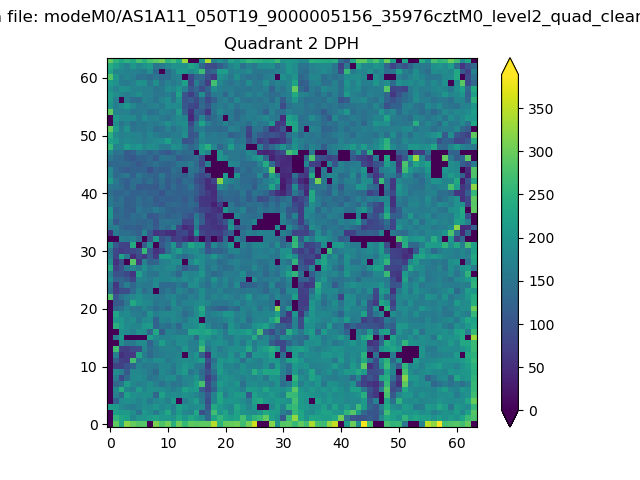
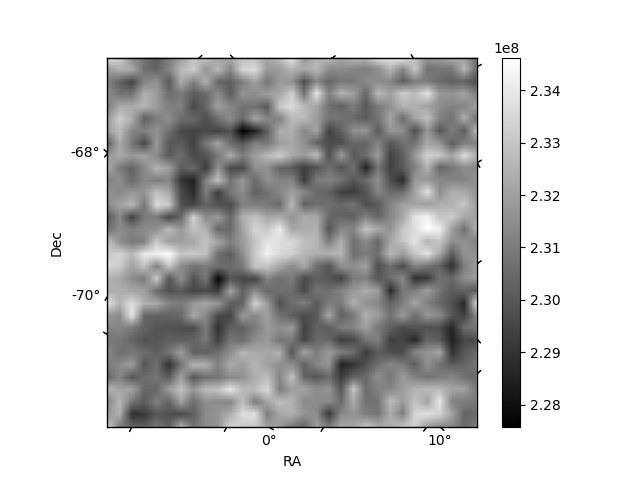
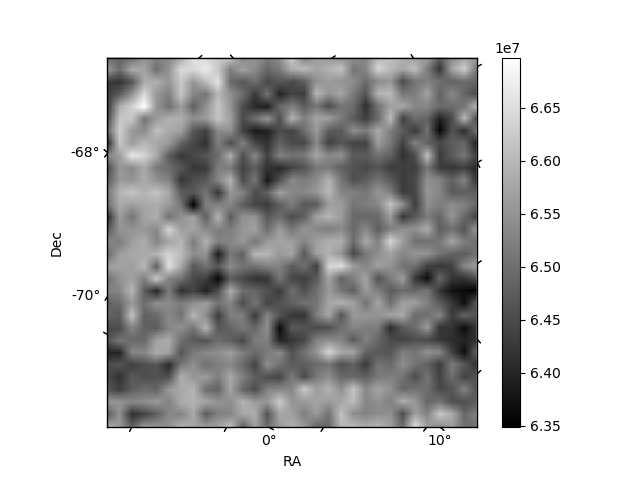
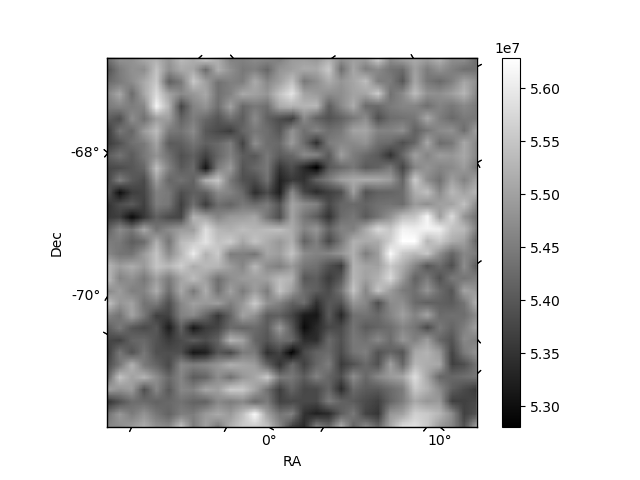
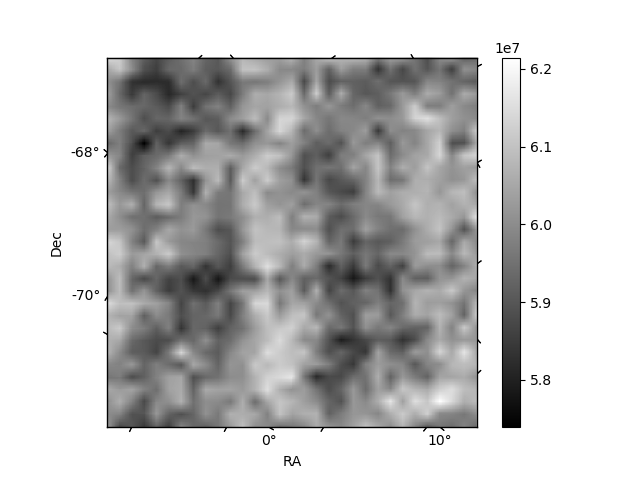
Histogram calculated using DETX and DETY for each event in the final _common_clean file
| Quadrant A | 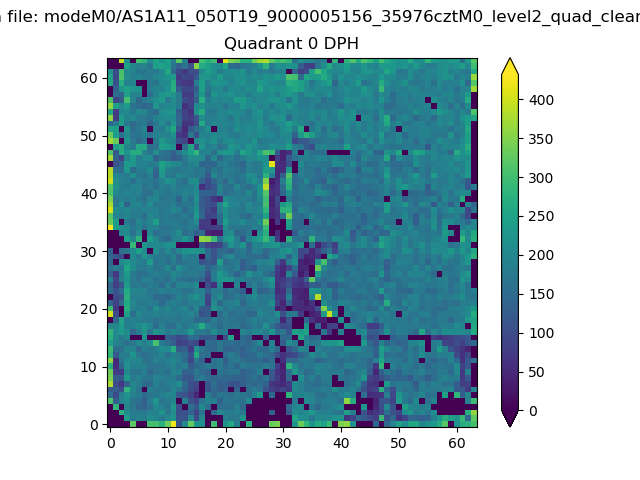 |
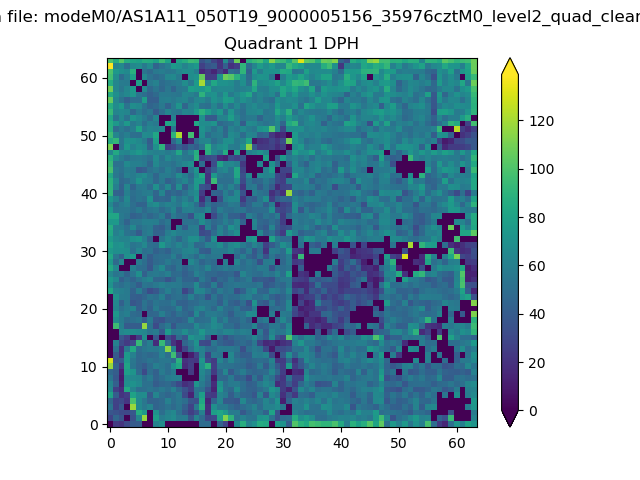 |
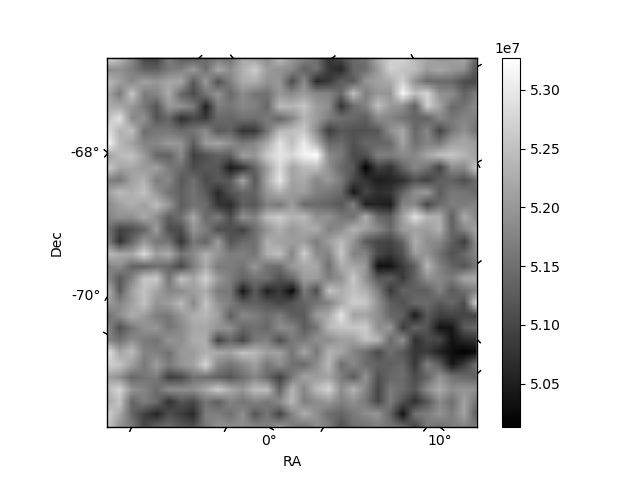
Quadrant B |
|---|---|---|---|
| Quadrant D | 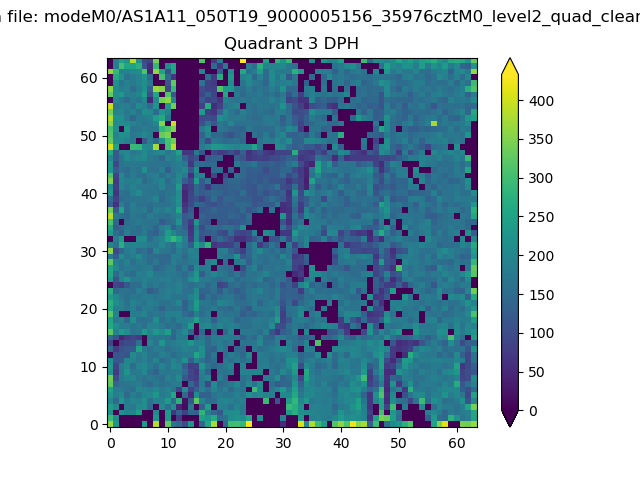 |
 |
Quadrant C |
| Plot type | Count rate plots | Images |
|---|---|---|
| Comparison with Poisson distribution Blue bars denote a histogram of data divided into 1 sec bins. Red curve is a Poisson curve with rate = median count rate of data. |
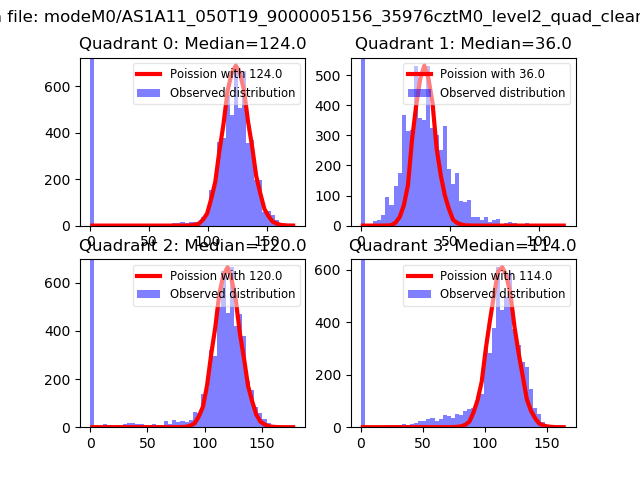 |
 |
| Quadrant-wise count rates Data is divided into 100 sec bins |
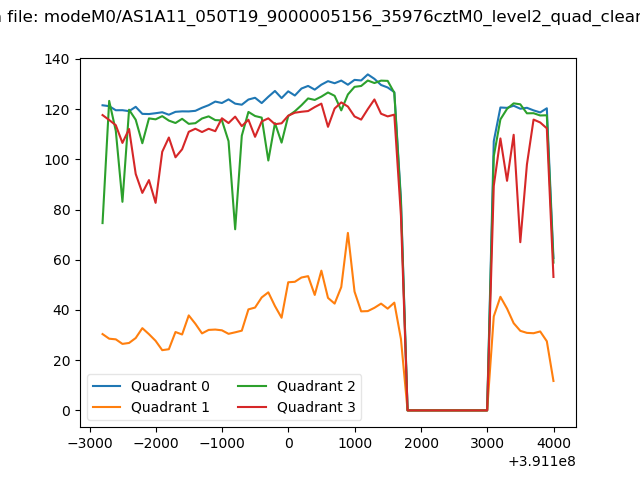 |
|
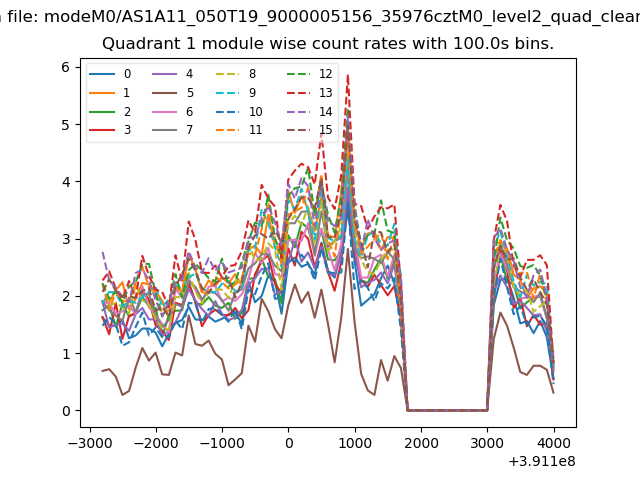
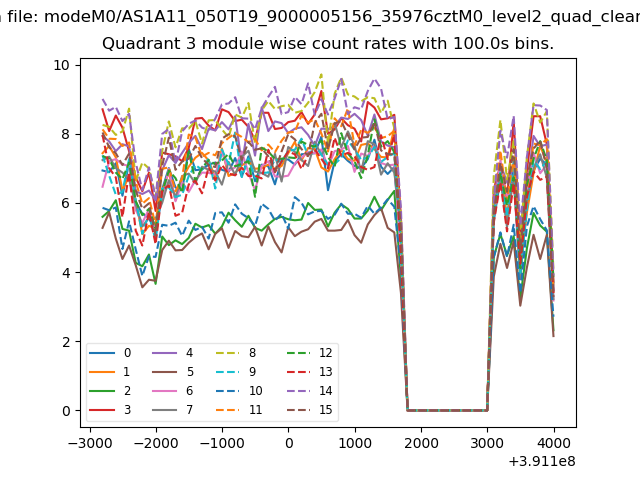
| Module-wise count rates for Quadrant A Data is divided into 100 sec bins |
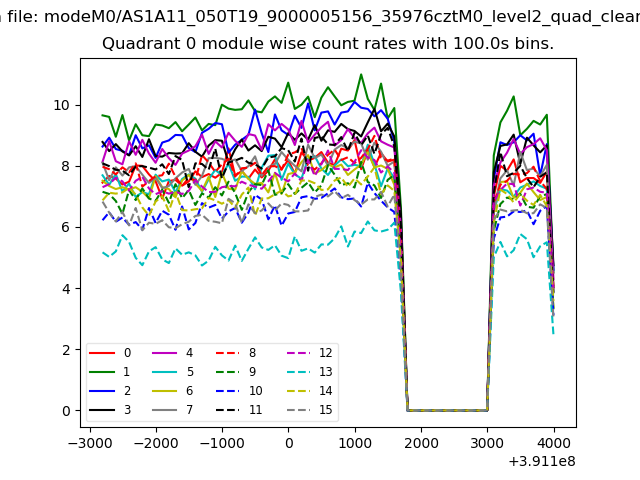 |
 |
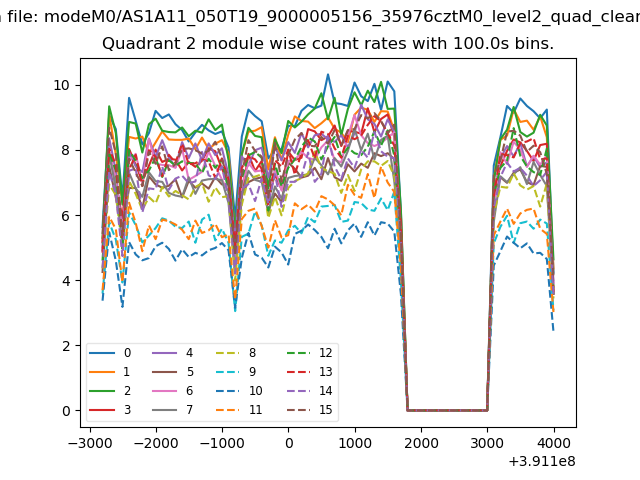
| Module-wise count rates for Quadrant B Data is divided into 100 sec bins |
 |
 |
| Module-wise count rates for Quadrant C Data is divided into 100 sec bins |
 |
 |
| Module-wise count rates for Quadrant D Data is divided into 100 sec bins |
 |
 |
| Parameter | Plot |
|---|---|
| CZT HV Monitor | 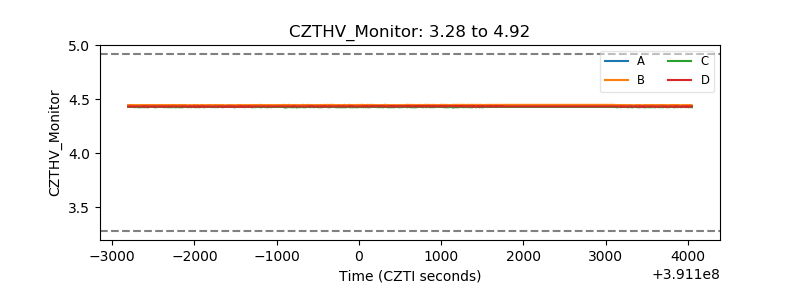 |
| D_VDD | 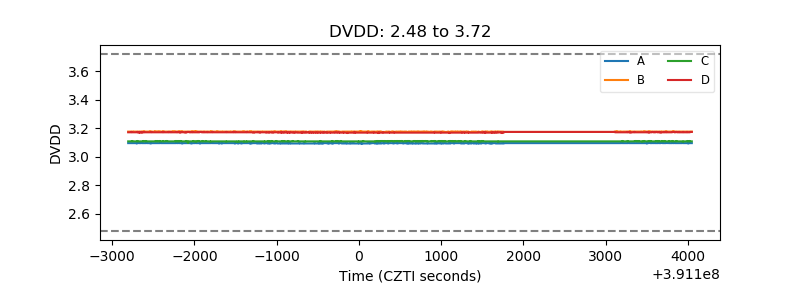 |
| Temperature 1 | 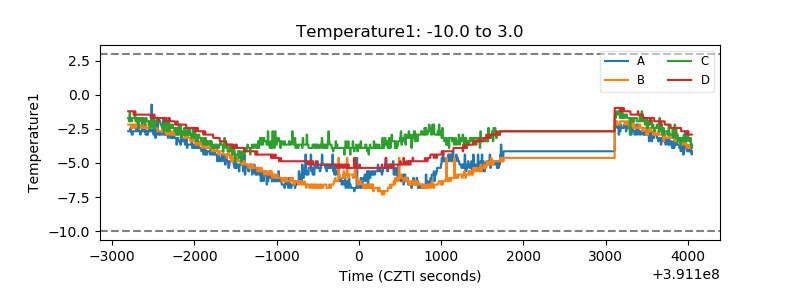 |
| Veto HV Monitor | 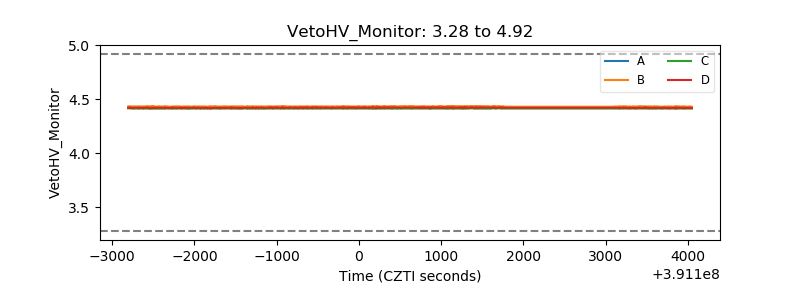 |
| Veto LLD | 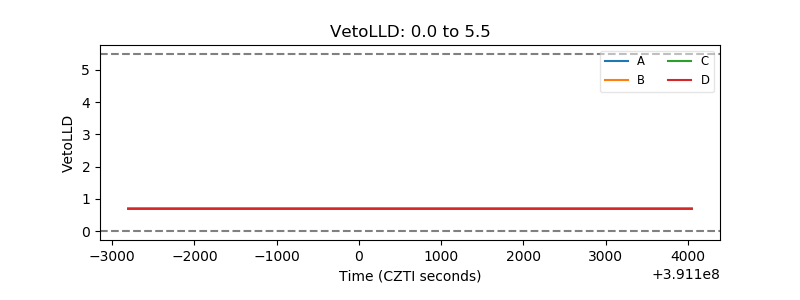 |
| Alpha Counter | 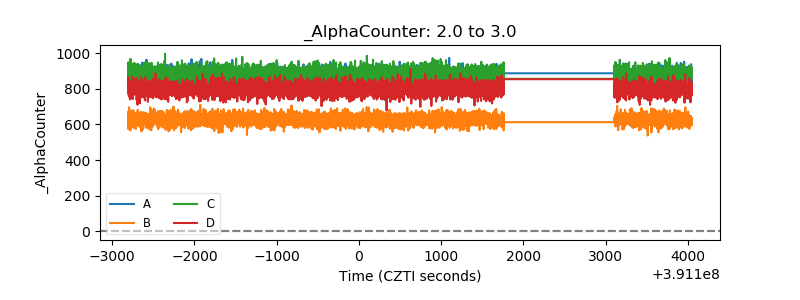 |
| _CPM_Rate | 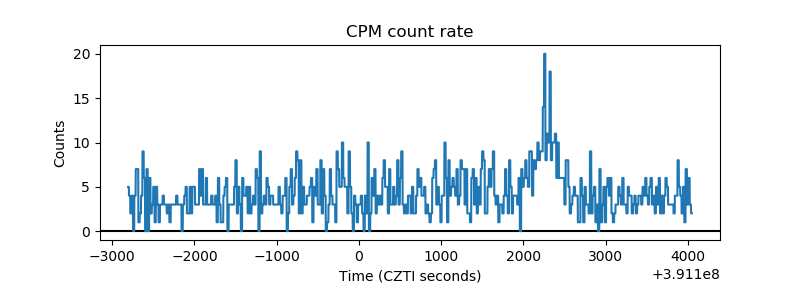 |
| CZT Counter | 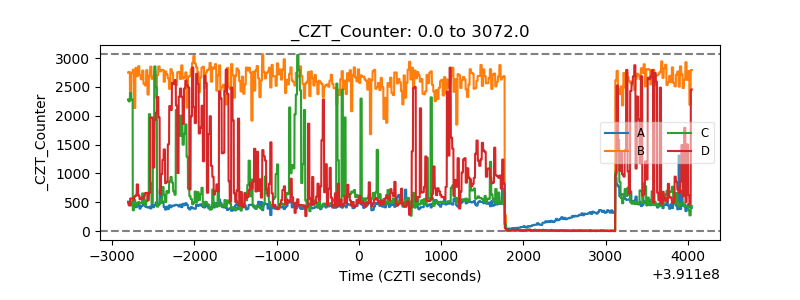 |
| +2.5 Volts monitor | 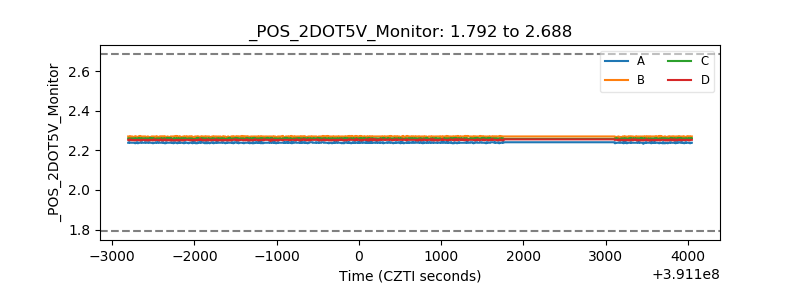 |
| +5 Volts monitor | 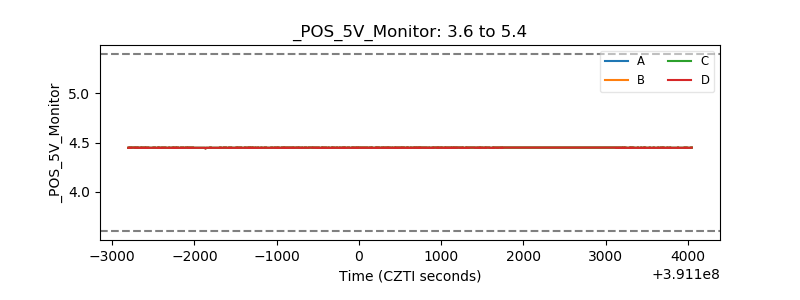 |
| _ROLL_ROT | 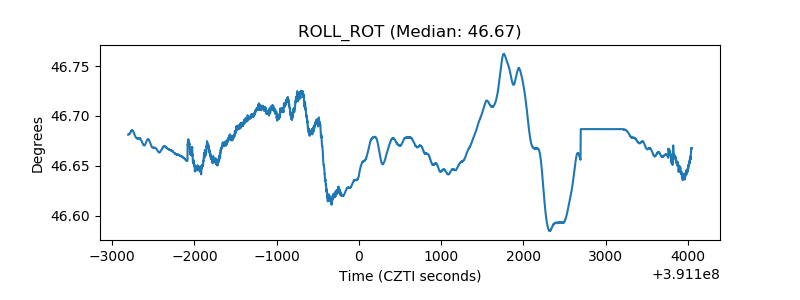 |
| _Roll_DEC | 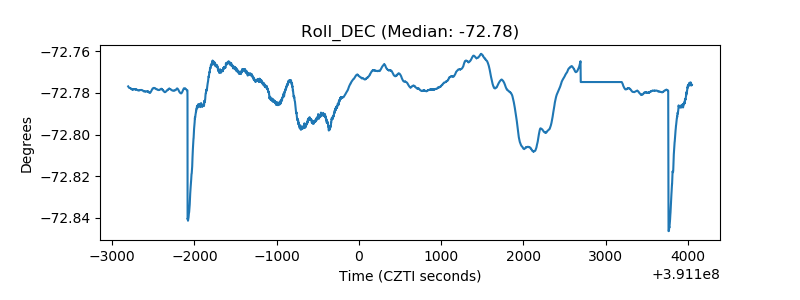 |
| _Roll_RA | 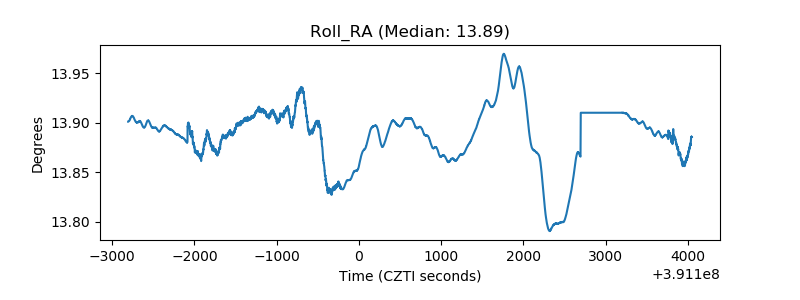 |
| Veto Counter | 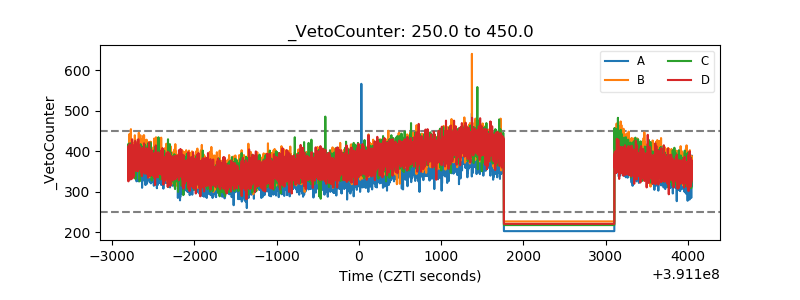 |