| Param | Original file | Final file |
|---|---|---|
| Filename | modeM0/AS1A11_050T19_9000005156cztM0_level2_bc.evt | modeM0/AS1A11_050T19_9000005156cztM0_level2_quad_clean.evt |
| Size (bytes) | 2,279,378,880 | 835,908,480 |
| Size | 2.1 GB | 797.2 MB |
| Events in quadrant A | 10,095,085 | 5,791,688 |
| Events in quadrant B | 12,815,698 | 5,756,308 |
| Events in quadrant C | 20,543,519 | 5,462,623 |
| Events in quadrant D | 22,551,927 | 5,257,958 |
| Mode M0 | |||
|---|---|---|---|
| Quadrant | BADHDUFLAG | Total packets | Discarded packets |
| A | 0 | 91073 | 0 |
| B | 0 | 103493 | 0 |
| C | 0 | 130006 | 0 |
| D | 0 | 142291 | 0 |
| Mode SS | |||
|---|---|---|---|
| Quadrant | BADHDUFLAG | Total packets | Discarded packets |
| A | 0 | 912 | 0 |
| B | 0 | 912 | 0 |
| C | 0 | 912 | 0 |
| D | 0 | 910 | 0 |
| Mode M9 | |||
|---|---|---|---|
| Quadrant | BADHDUFLAG | Total packets | Discarded packets |
| A | 0 | 161 | 0 |
| B | 0 | 161 | 0 |
| C | 0 | 161 | 0 |
| D | 0 | 162 | 0 |
| Quadrant | Total seconds | Saturated seconds | Saturation percentage |
|---|---|---|---|
| A | 44412 | 57 | 0.128344% |
| B | 44424 | 859 | 1.933639% |
| C | 44412 | 4546 | 10.235972% |
| D | 44412 | 4196 | 9.447897% |
Noise dominated data is calculated using 1-second bins in cleaned event files. If a bin has >2000 counts, and if more than 50% of those come from <1% of pixels, then it is considered to be noise-dominated and hence unusable.
| Quadrant | # 1 sec bins | Bins with >0 counts | Bins with >2000 counts | High rate bins dominated by noise | Noise dominated (total time) | Noise dominated (detector-on time) | Marked lightcurve |
|---|---|---|---|---|---|---|---|
| A | 59985 | 44461 | 0 | 0 | 0.00% | 0.00% | 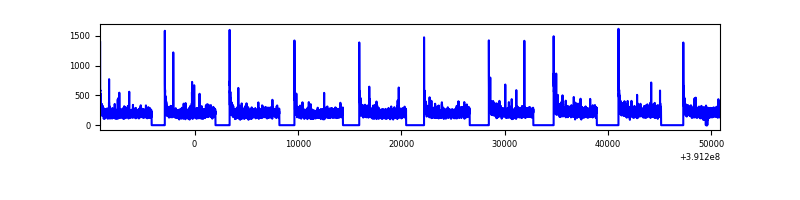 |
| B | 59984 | 44450 | 63 | 63 | 0.11% | 0.14% | 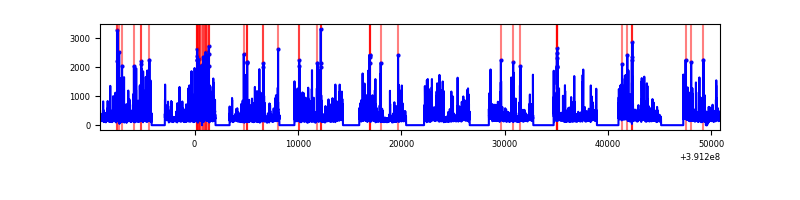 |
| C | 59984 | 44432 | 1345 | 1345 | 2.24% | 3.03% | 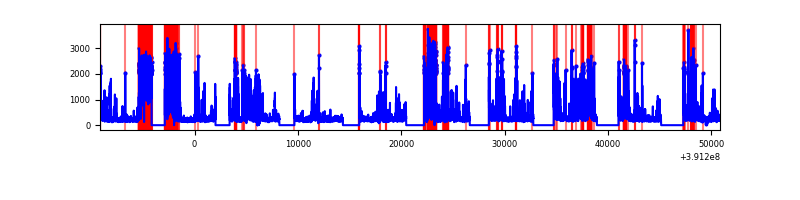 |
| D | 59984 | 44437 | 563 | 563 | 0.94% | 1.27% | 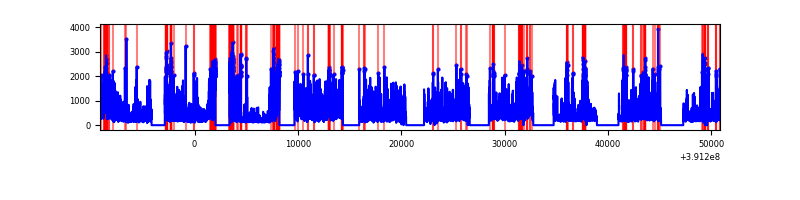 |
Top three noisy pixels from each quadrant. If the there are fewer than three noisy pixels in the level2.evt file, extra rows are filled as -1
| Pixel properties | Quadrant properties | ||||||
|---|---|---|---|---|---|---|---|
| Quadrant | DetID | PixID | Counts | Sigma | Mean | Median | Sigma |
| A | 10 | 83 | 1053181 | 2050.84 | 2315 | 2285 | 512.4 |
| A | 13 | 254 | 66459 | 125.24 | 2315 | 2285 | 512.4 |
| A | 13 | 6 | 47635 | 88.5 | 2315 | 2285 | 512.4 |
| B | 5 | 172 | 2010789 | 4407.73 | 2293 | 2240 | 455.7 |
| B | 4 | 171 | 629741 | 1377.04 | 2293 | 2240 | 455.7 |
| B | 5 | 255 | 466769 | 1019.4 | 2293 | 2240 | 455.7 |
| C | 9 | 187 | 7092461 | 14146.25 | 2168 | 2155 | 501.2 |
| C | 0 | 207 | 2727991 | 5438.46 | 2168 | 2155 | 501.2 |
| C | 15 | 214 | 1669678 | 3326.96 | 2168 | 2155 | 501.2 |
| D | 12 | 227 | 4154438 | 7937.2 | 2203 | 2143 | 523.1 |
| D | 12 | 235 | 3262035 | 6231.35 | 2203 | 2143 | 523.1 |
| D | 1 | 52 | 2176872 | 4157.04 | 2203 | 2143 | 523.1 |
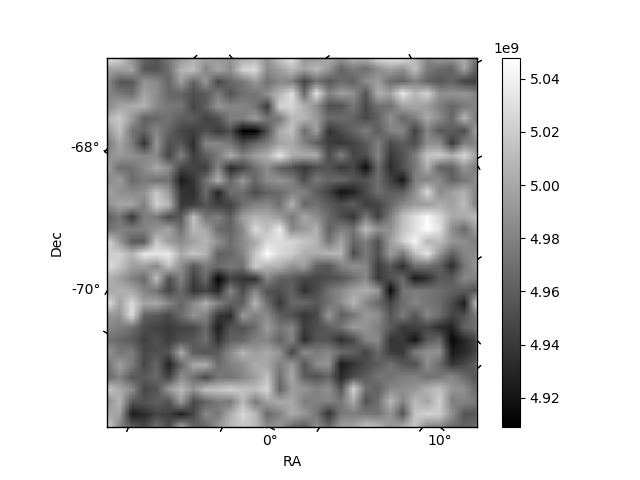
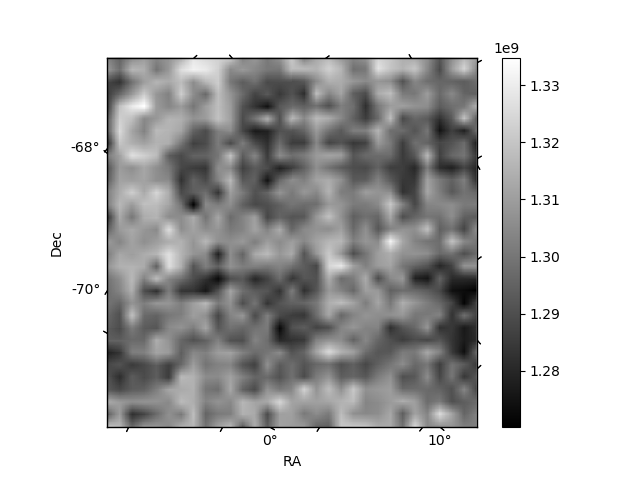
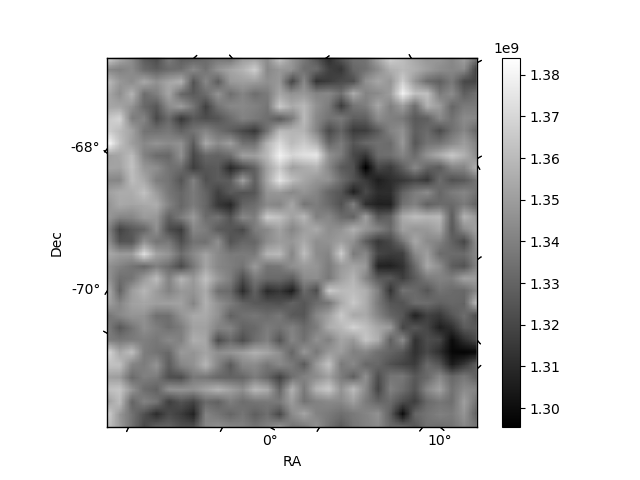
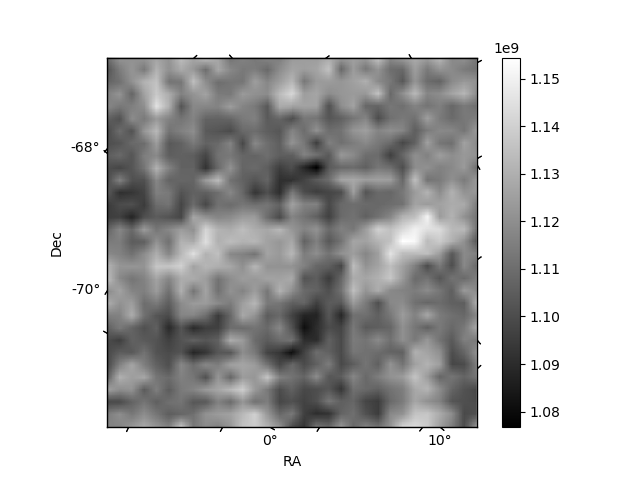
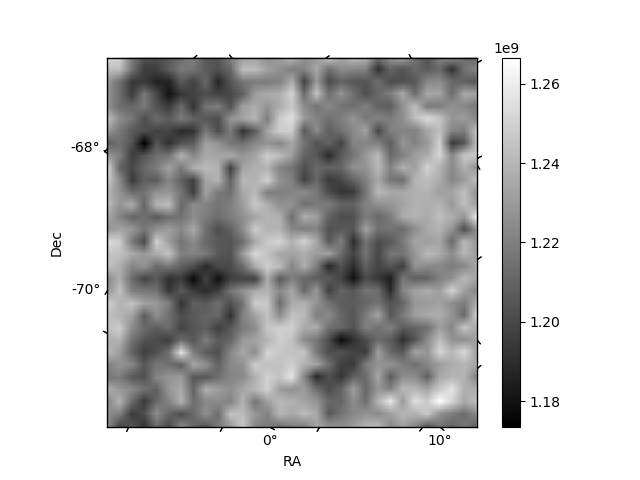
Histogram calculated using DETX and DETY for each event in the final _common_clean file
| Quadrant A | 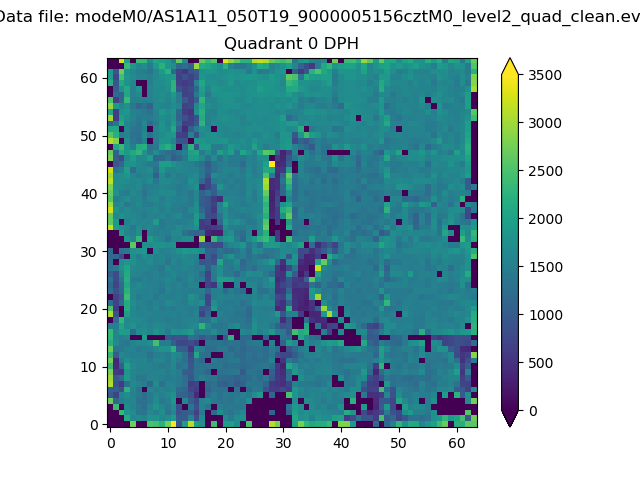 |
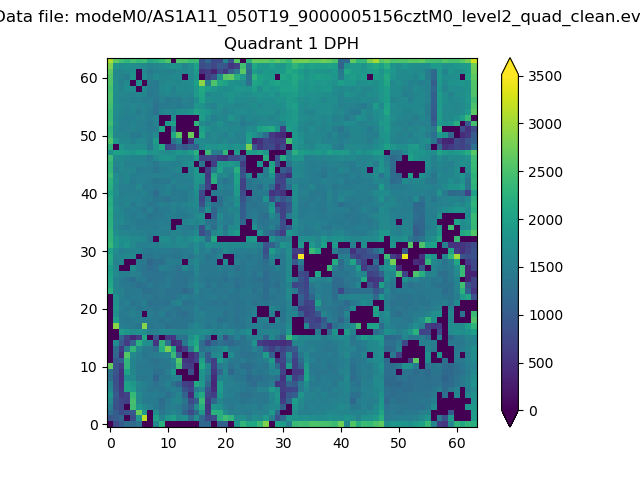 |
Quadrant B |
|---|---|---|---|
| Quadrant D | 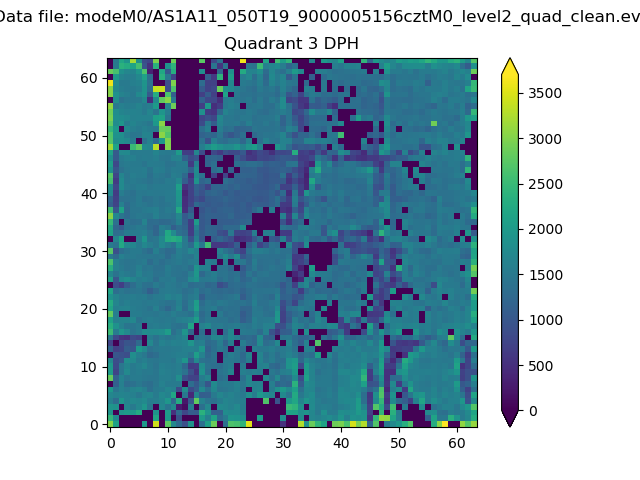 |
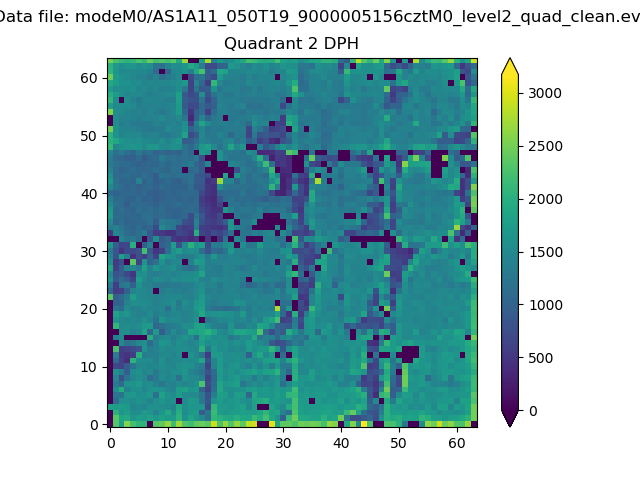 |
Quadrant C |
| Plot type | Count rate plots | Images |
|---|---|---|
| Comparison with Poisson distribution Blue bars denote a histogram of data divided into 1 sec bins. Red curve is a Poisson curve with rate = median count rate of data. |
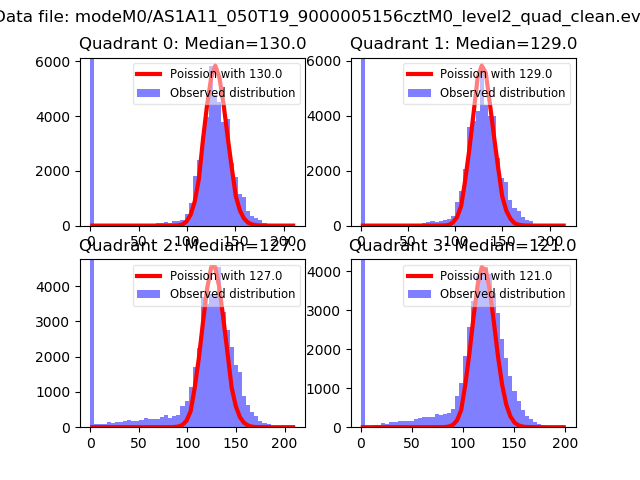 |
 |
| Quadrant-wise count rates Data is divided into 100 sec bins |
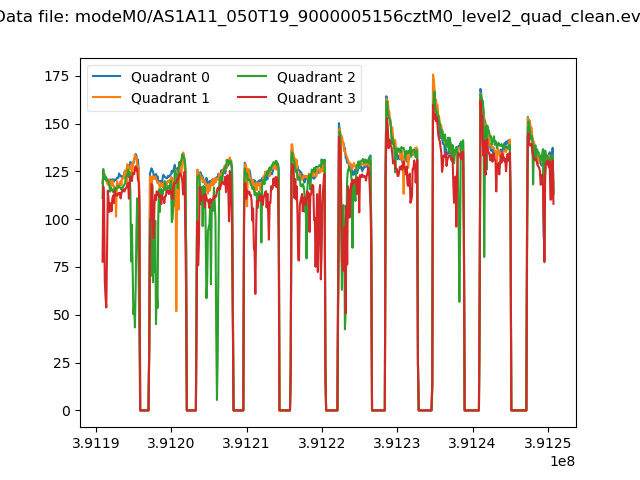 |
|
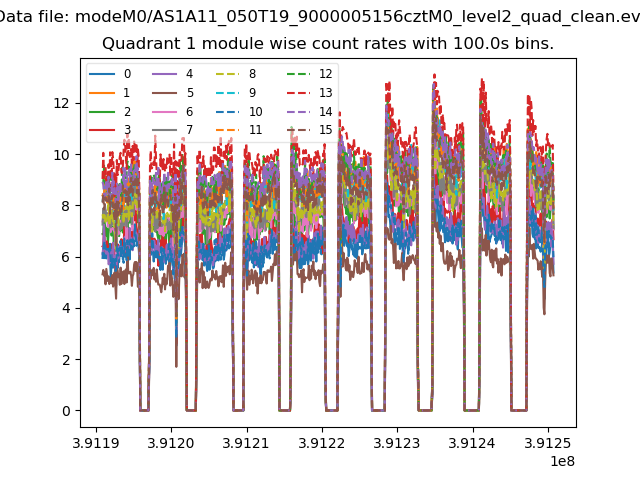
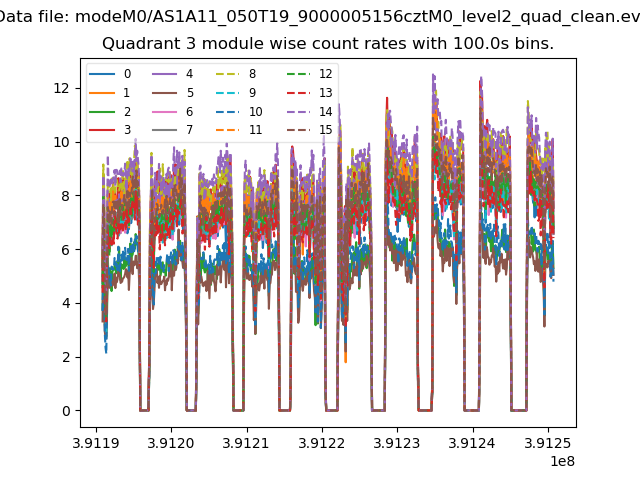
| Module-wise count rates for Quadrant A Data is divided into 100 sec bins |
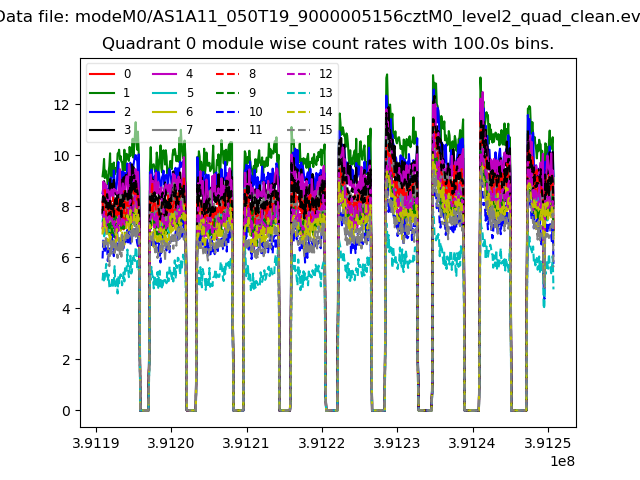 |
 |
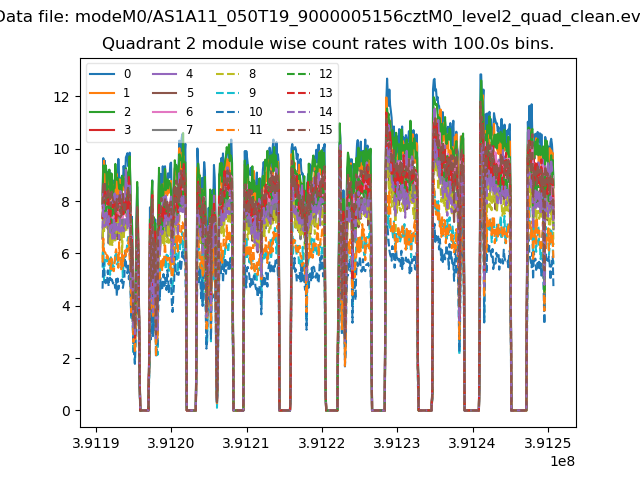
| Module-wise count rates for Quadrant B Data is divided into 100 sec bins |
 |
 |
| Module-wise count rates for Quadrant C Data is divided into 100 sec bins |
 |
 |
| Module-wise count rates for Quadrant D Data is divided into 100 sec bins |
 |
 |
| Parameter | Plot |
|---|---|
| CZT HV Monitor | 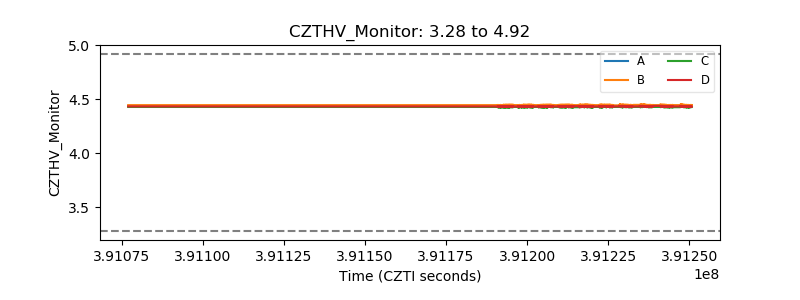 |
| D_VDD | 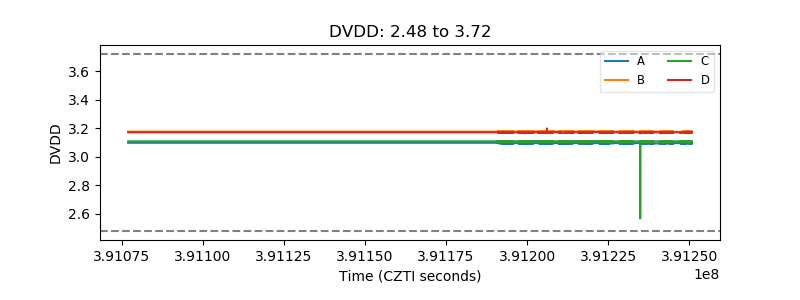 |
| Temperature 1 | 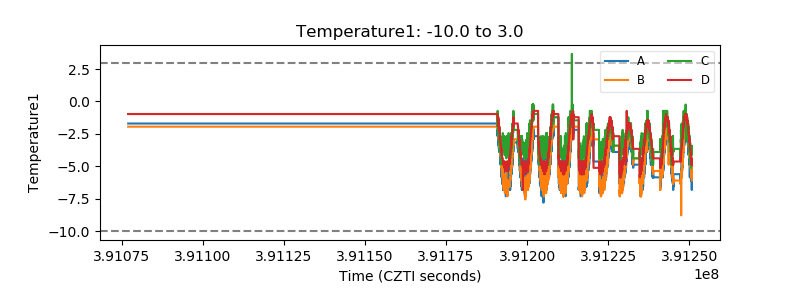 |
| Veto HV Monitor | 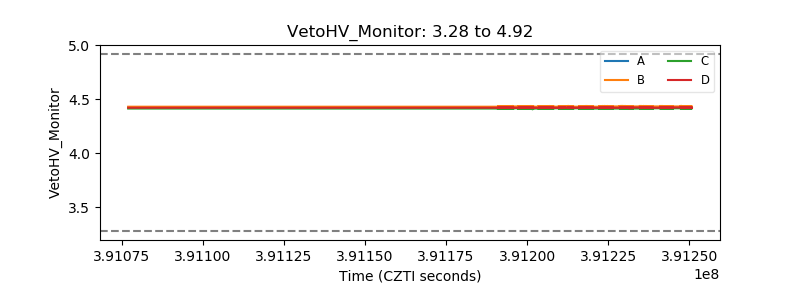 |
| Veto LLD | 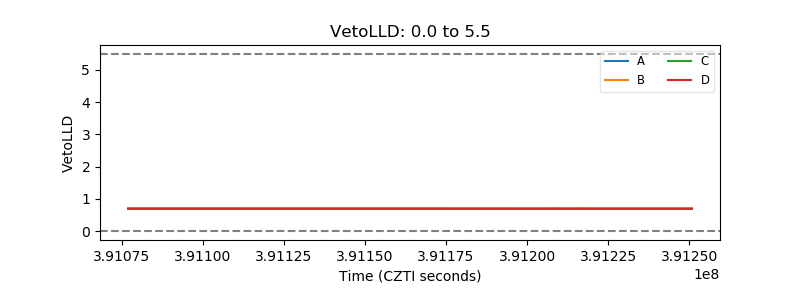 |
| Alpha Counter | 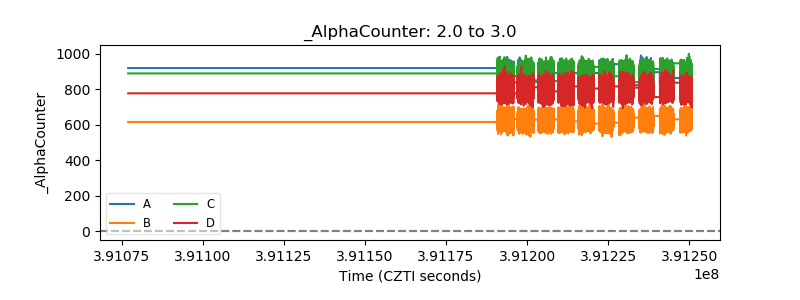 |
| _CPM_Rate | 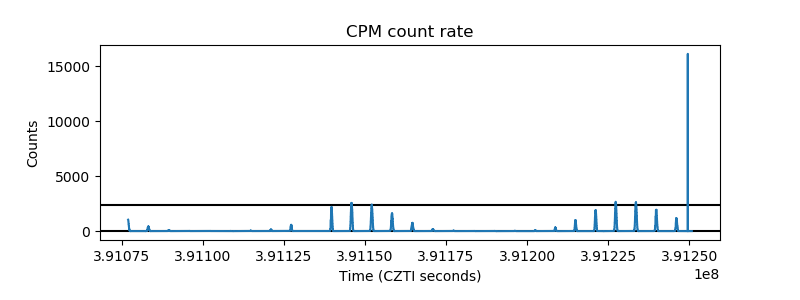 |
| CZT Counter | 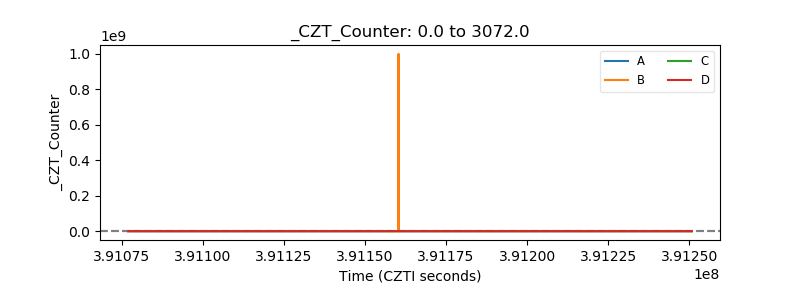 |
| +2.5 Volts monitor | 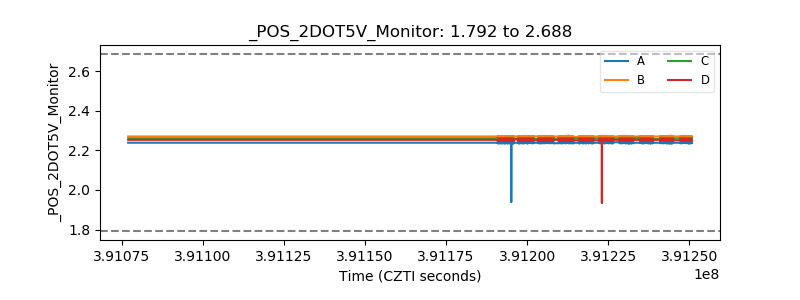 |
| +5 Volts monitor | 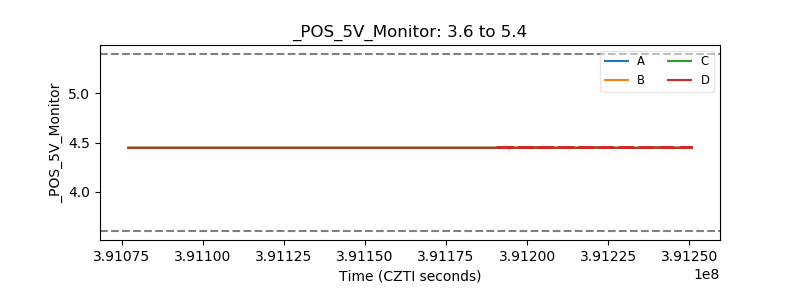 |
| _ROLL_ROT | 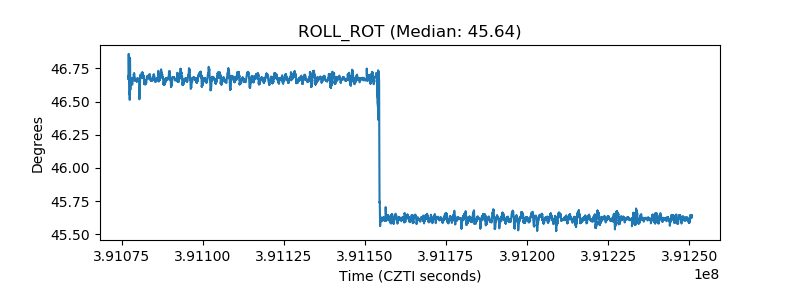 |
| _Roll_DEC | 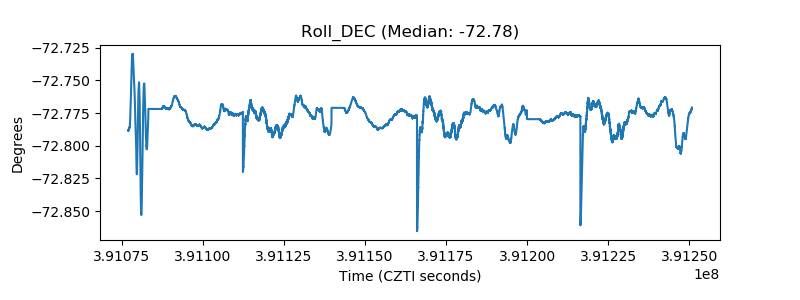 |
| _Roll_RA | 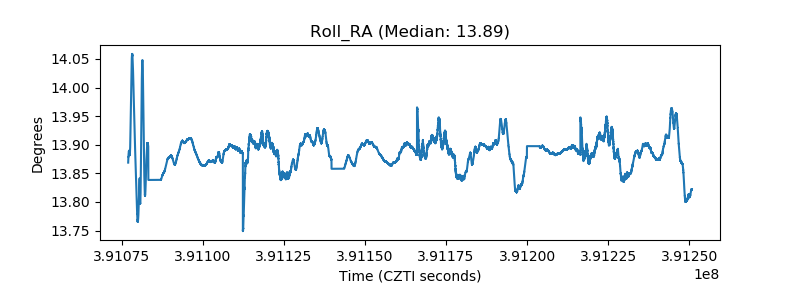 |
| Veto Counter | 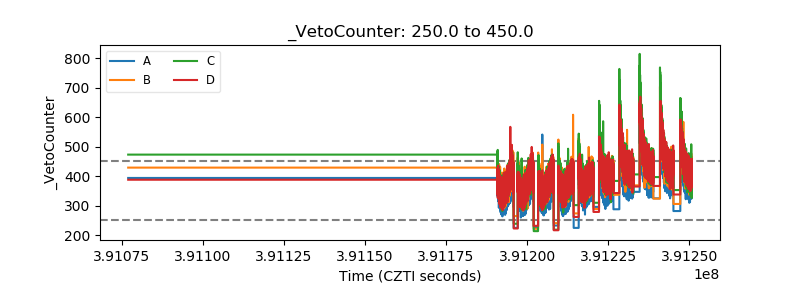 |