| Param | Original file | Final file |
|---|---|---|
| Filename | modeM0/AS1T05_009T09_9000005148cztM0_level2_bc.evt | modeM0/AS1T05_009T09_9000005148cztM0_level2_quad_clean.evt |
| Size (bytes) | 275,618,880 | 77,952,960 |
| Size | 262.9 MB | 74.3 MB |
| Events in quadrant A | 1,296,454 | 586,849 |
| Events in quadrant B | 2,462,006 | 181,131 |
| Events in quadrant C | 2,034,405 | 595,874 |
| Events in quadrant D | 2,121,695 | 564,133 |
| Mode M0 | |||
|---|---|---|---|
| Quadrant | BADHDUFLAG | Total packets | Discarded packets |
| A | 0 | 12554 | 0 |
| B | 0 | 52362 | 0 |
| C | 0 | 14962 | 0 |
| D | 0 | 15559 | 0 |
| Mode SS | |||
|---|---|---|---|
| Quadrant | BADHDUFLAG | Total packets | Discarded packets |
| A | 0 | 124 | 0 |
| B | 0 | 124 | 0 |
| C | 0 | 124 | 0 |
| D | 0 | 124 | 0 |
| Mode M9 | |||
|---|---|---|---|
| Quadrant | BADHDUFLAG | Total packets | Discarded packets |
| A | 0 | 16 | 0 |
| B | 0 | 16 | 0 |
| C | 0 | 16 | 0 |
| D | 0 | 16 | 0 |
| Quadrant | Total seconds | Saturated seconds | Saturation percentage |
|---|---|---|---|
| A | 6167 | 10 | 0.162153% |
| B | 6167 | 6167 | 100.000000% |
| C | 6167 | 119 | 1.929625% |
| D | 6167 | 210 | 3.405221% |
Noise dominated data is calculated using 1-second bins in cleaned event files. If a bin has >2000 counts, and if more than 50% of those come from <1% of pixels, then it is considered to be noise-dominated and hence unusable.
| Quadrant | # 1 sec bins | Bins with >0 counts | Bins with >2000 counts | High rate bins dominated by noise | Noise dominated (total time) | Noise dominated (detector-on time) | Marked lightcurve |
|---|---|---|---|---|---|---|---|
| A | 7750 | 6168 | 0 | 0 | 0.00% | 0.00% | 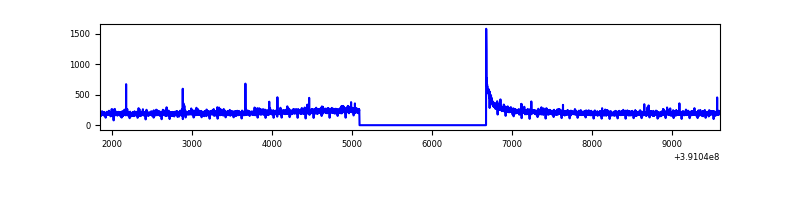 |
| B | 7749 | 6165 | 15 | 15 | 0.19% | 0.24% | 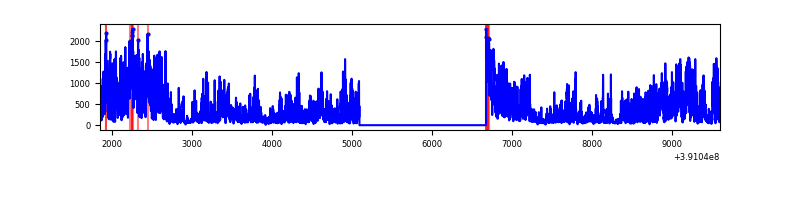 |
| C | 7750 | 6167 | 15 | 15 | 0.19% | 0.24% | 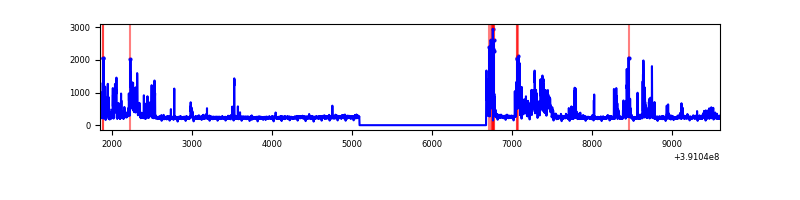 |
| D | 7750 | 6167 | 23 | 23 | 0.30% | 0.37% | 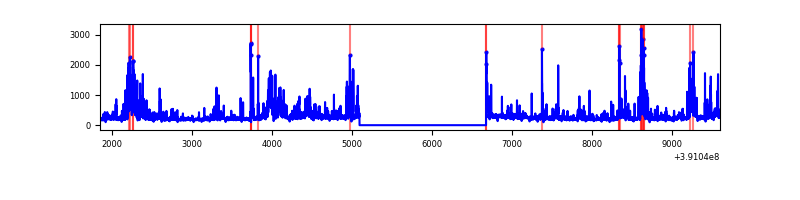 |
Top three noisy pixels from each quadrant. If the there are fewer than three noisy pixels in the level2.evt file, extra rows are filled as -1
| Pixel properties | Quadrant properties | ||||||
|---|---|---|---|---|---|---|---|
| Quadrant | DetID | PixID | Counts | Sigma | Mean | Median | Sigma |
| A | 10 | 83 | 125384 | 1829.58 | 295 | 289 | 68.4 |
| A | 15 | 169 | 10953 | 155.97 | 295 | 289 | 68.4 |
| A | 8 | 144 | 10322 | 146.74 | 295 | 289 | 68.4 |
| B | 5 | 31 | 1010237 | 38193.69 | 93 | 92 | 26.4 |
| B | 5 | 15 | 887142 | 33539.45 | 93 | 92 | 26.4 |
| B | 0 | 190 | 90914 | 3433.99 | 93 | 92 | 26.4 |
| C | 9 | 187 | 540040 | 7550.49 | 293 | 290 | 71.5 |
| C | 15 | 214 | 239967 | 3352.81 | 293 | 290 | 71.5 |
| C | 0 | 10 | 83567 | 1164.95 | 293 | 290 | 71.5 |
| D | 7 | 223 | 267651 | 3673.63 | 292 | 281 | 72.8 |
| D | 2 | 250 | 178711 | 2451.6 | 292 | 281 | 72.8 |
| D | 12 | 227 | 107800 | 1477.3 | 292 | 281 | 72.8 |
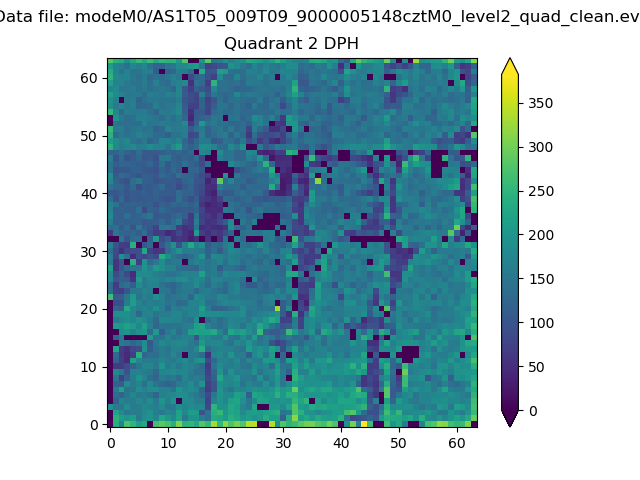
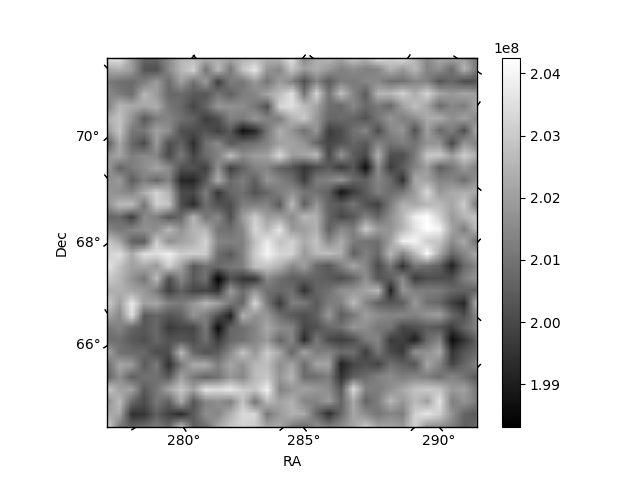
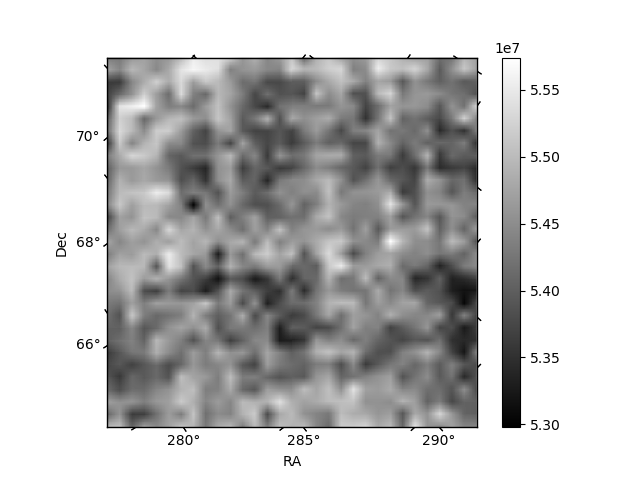
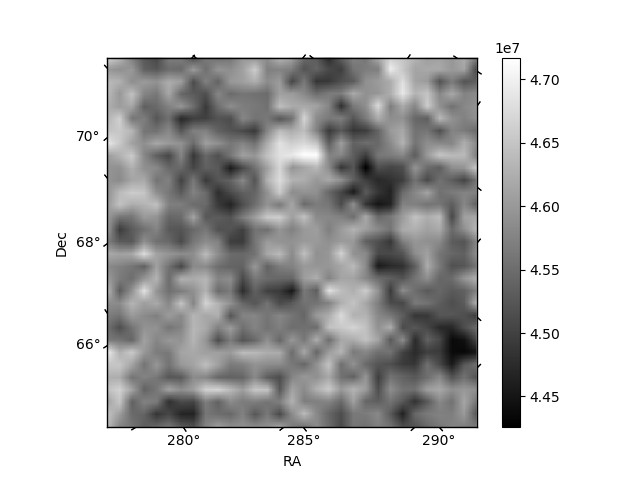
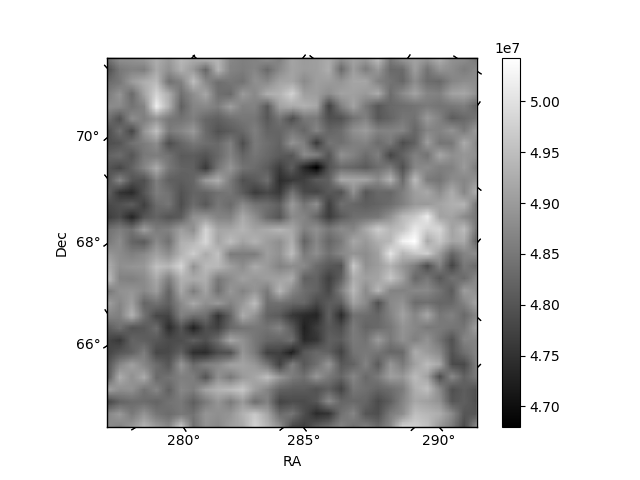
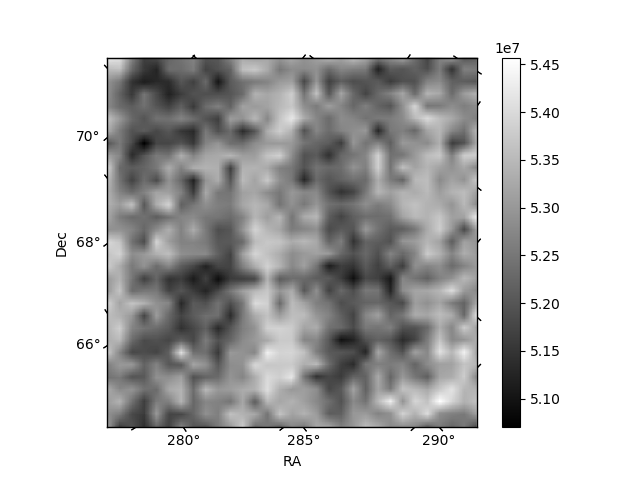
Histogram calculated using DETX and DETY for each event in the final _common_clean file
| Quadrant A | 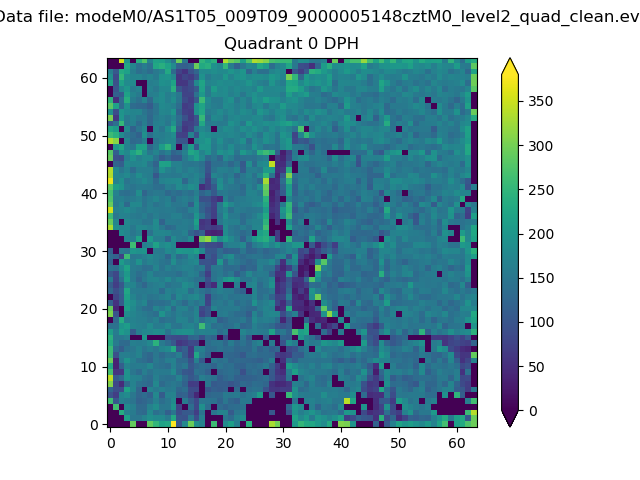 |
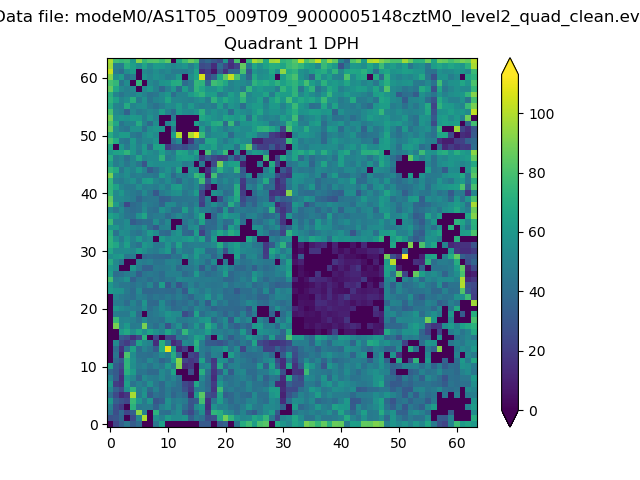 |
Quadrant B |
|---|---|---|---|
| Quadrant D | 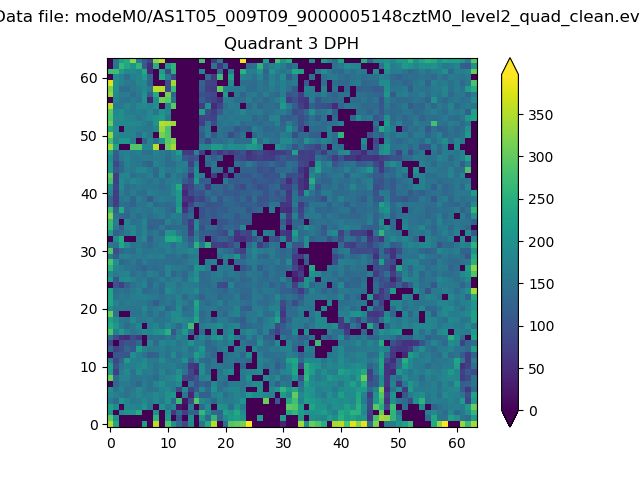 |
 |
Quadrant C |
| Plot type | Count rate plots | Images |
|---|---|---|
| Comparison with Poisson distribution Blue bars denote a histogram of data divided into 1 sec bins. Red curve is a Poisson curve with rate = median count rate of data. |
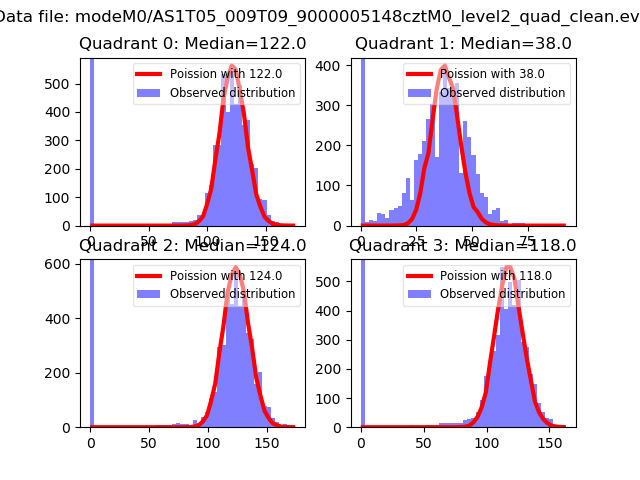 |
 |
| Quadrant-wise count rates Data is divided into 100 sec bins |
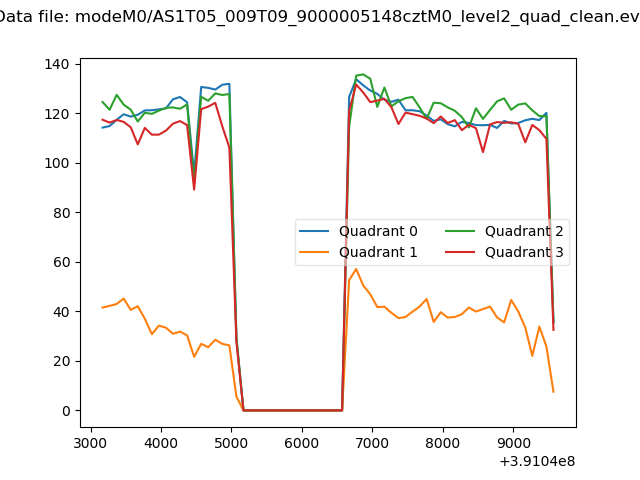 |
|
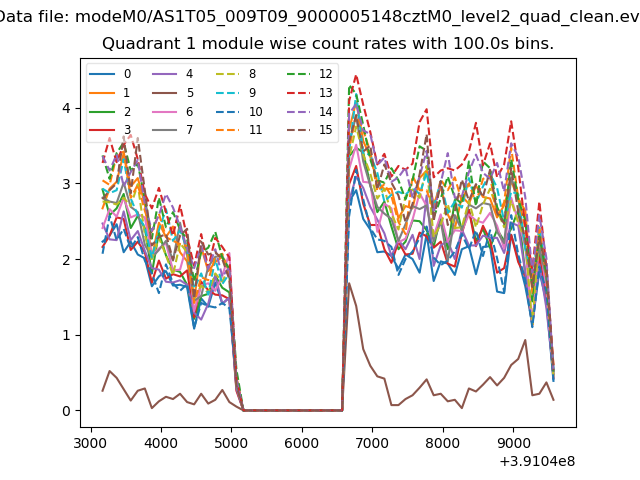
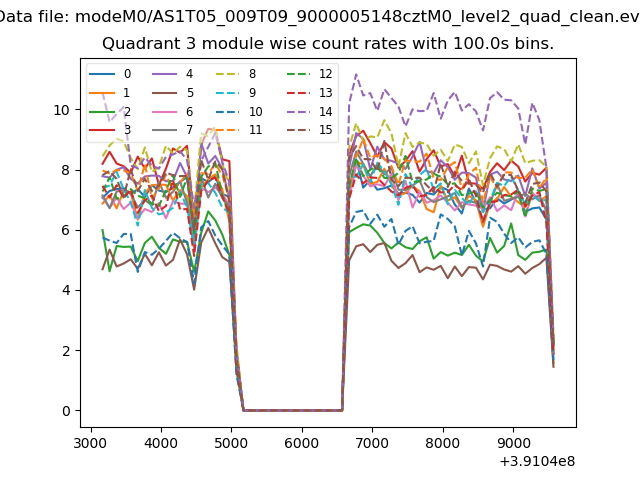
| Module-wise count rates for Quadrant A Data is divided into 100 sec bins |
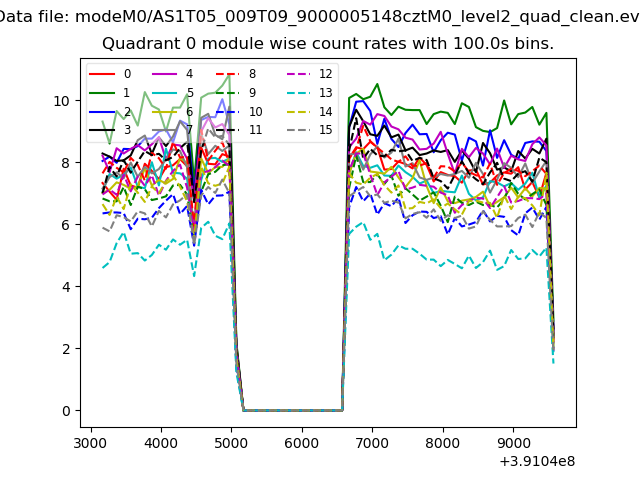 |
 |
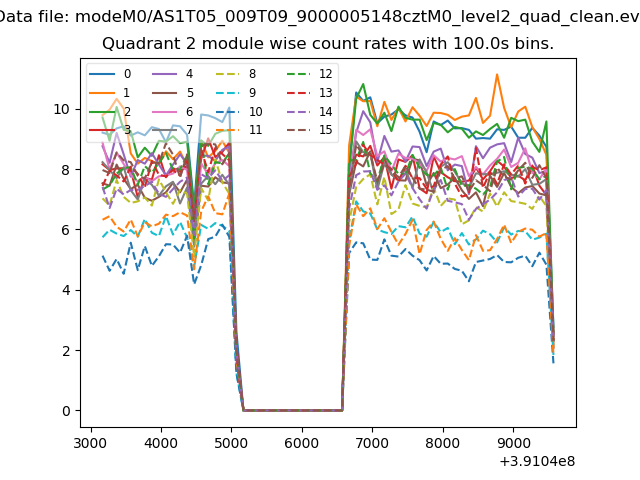
| Module-wise count rates for Quadrant B Data is divided into 100 sec bins |
 |
 |
| Module-wise count rates for Quadrant C Data is divided into 100 sec bins |
 |
 |
| Module-wise count rates for Quadrant D Data is divided into 100 sec bins |
 |
 |
| Parameter | Plot |
|---|---|
| CZT HV Monitor | 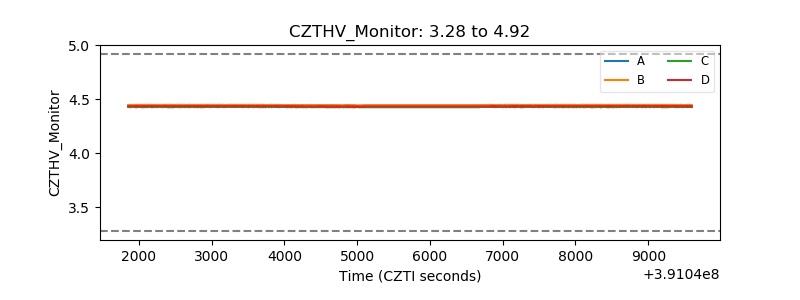 |
| D_VDD | 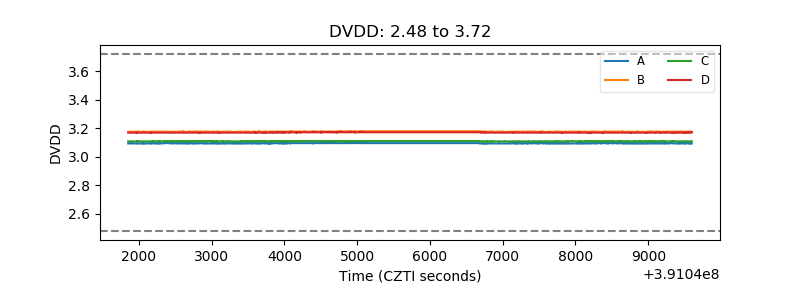 |
| Temperature 1 | 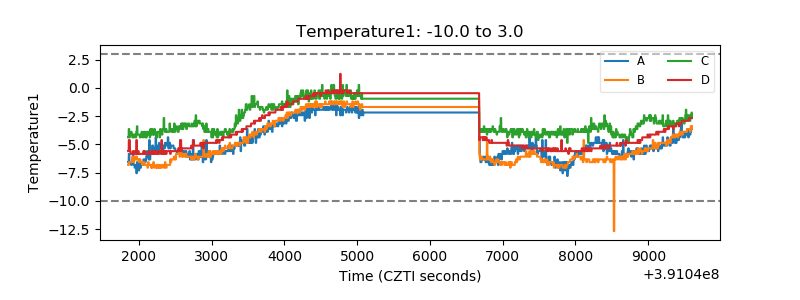 |
| Veto HV Monitor | 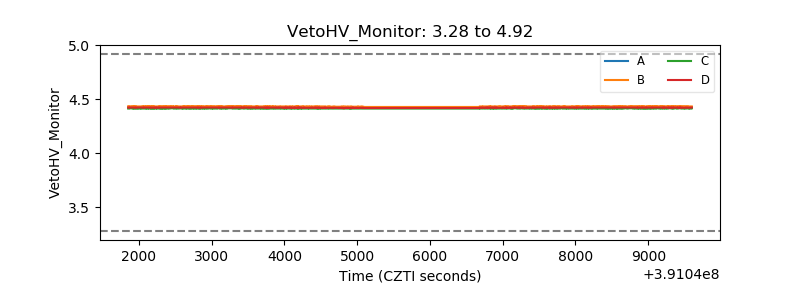 |
| Veto LLD | 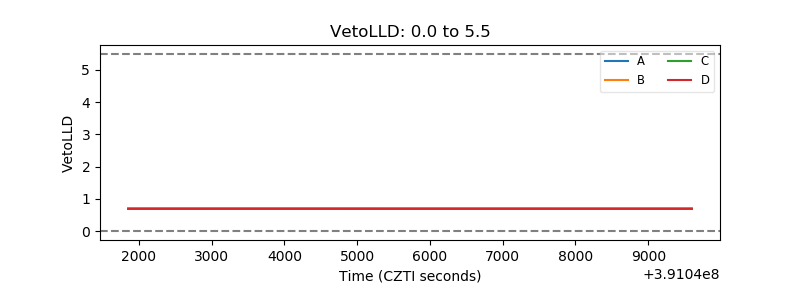 |
| Alpha Counter | 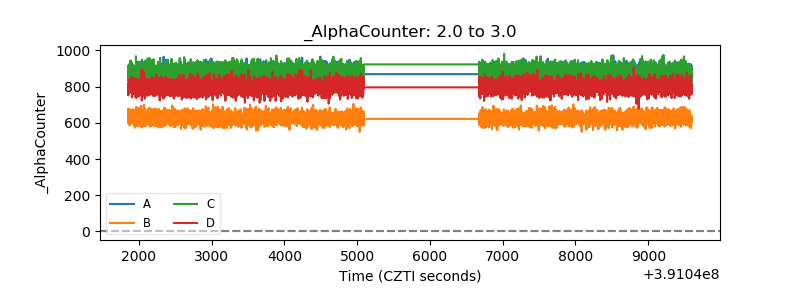 |
| _CPM_Rate | 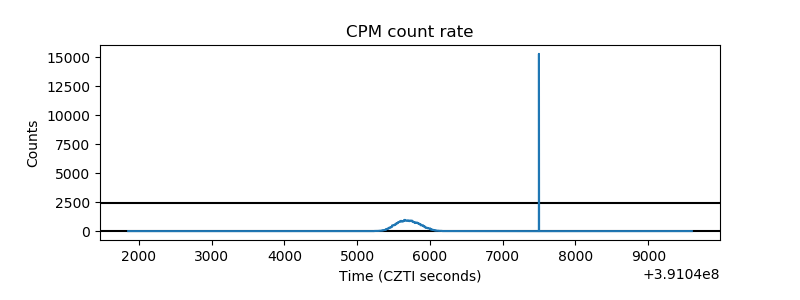 |
| CZT Counter | 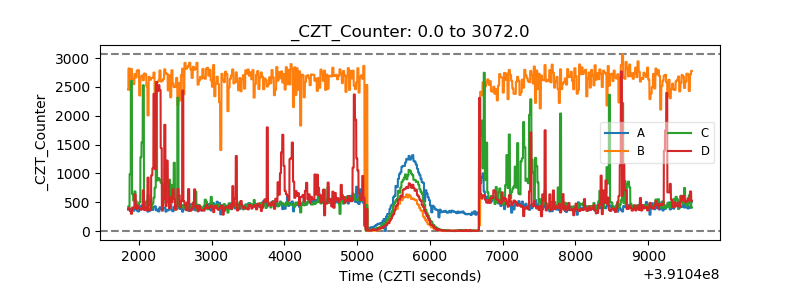 |
| +2.5 Volts monitor | 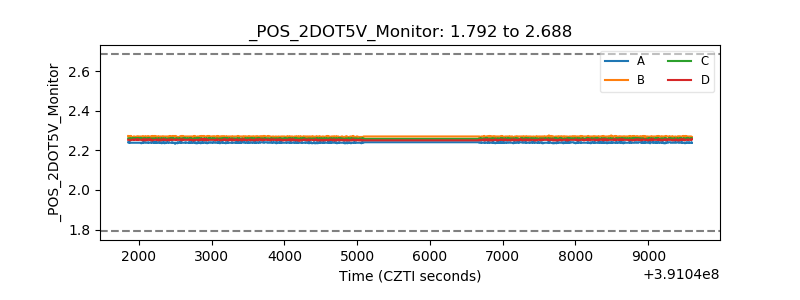 |
| +5 Volts monitor | 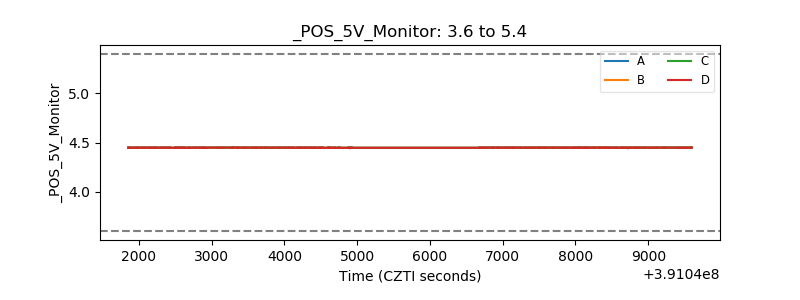 |
| _ROLL_ROT | 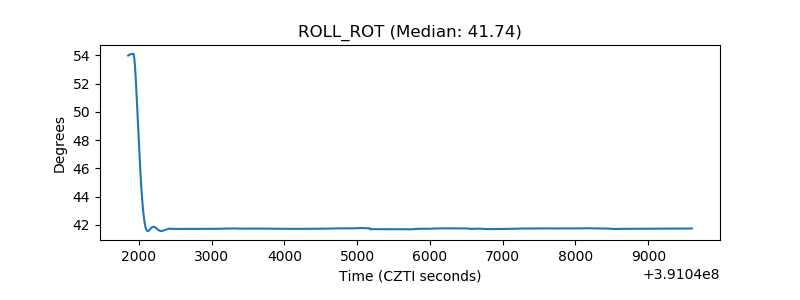 |
| _Roll_DEC | 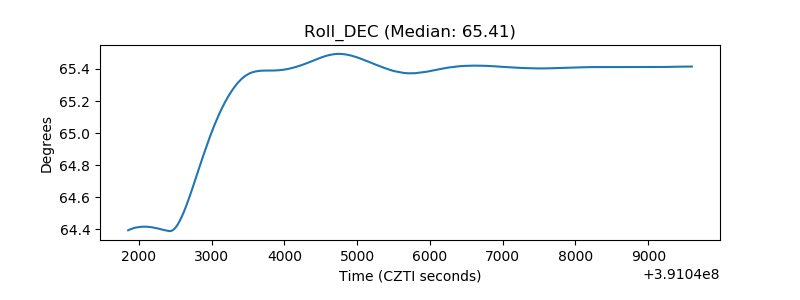 |
| _Roll_RA | 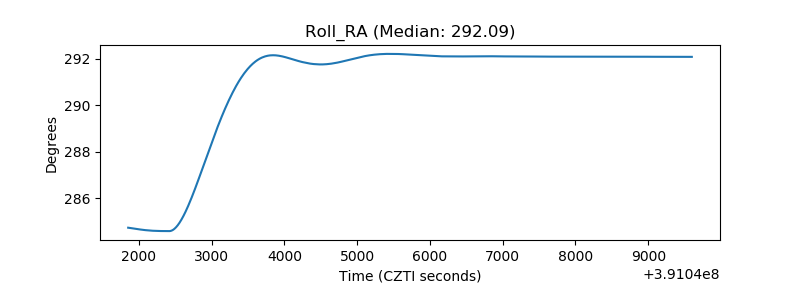 |
| Veto Counter | 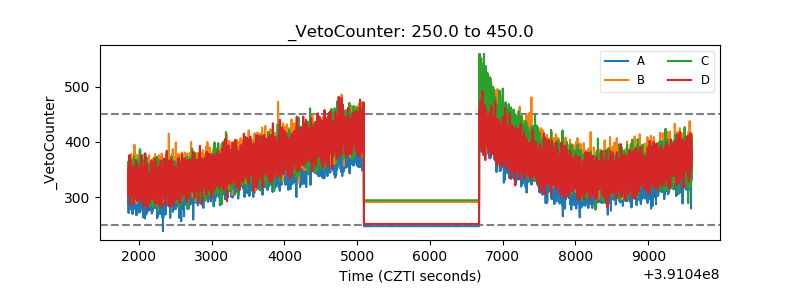 |