| Param | Original file | Final file |
|---|---|---|
| Filename | modeM0/AS1A11_080T01_9000005146_35958cztM0_level2.evt | modeM0/AS1A11_080T01_9000005146_35958cztM0_level2_quad_clean.evt |
| Size (bytes) | 2,609,484,480 | 188,985,600 |
| Size | 2.4 GB | 180.2 MB |
| Events in quadrant A | 11,132,786 | 1,327,684 |
| Events in quadrant B | 40,969,026 | 755,180 |
| Events in quadrant C | 15,011,669 | 1,196,407 |
| Events in quadrant D | 10,760,306 | 1,253,424 |
| Mode M9 | |||
|---|---|---|---|
| Quadrant | BADHDUFLAG | Total packets | Discarded packets |
| A | 0 | 82 | 0 |
| B | 0 | 82 | 0 |
| C | 0 | 82 | 0 |
| D | 0 | 82 | 0 |
| Mode SS | |||
|---|---|---|---|
| Quadrant | BADHDUFLAG | Total packets | Discarded packets |
| A | 0 | 352 | 0 |
| B | 0 | 352 | 0 |
| C | 0 | 352 | 0 |
| D | 0 | 352 | 0 |
| Mode M0 | |||
|---|---|---|---|
| Quadrant | BADHDUFLAG | Total packets | Discarded packets |
| A | 0 | 43372 | 5 |
| B | 0 | 133226 | 4 |
| C | 0 | 55637 | 4 |
| D | 0 | 42902 | 4 |
| Quadrant | Total seconds | Saturated seconds | Saturation percentage |
|---|---|---|---|
| A | 17210 | 620 | 3.602557% |
| B | 17210 | 16260 | 94.479954% |
| C | 17210 | 1842 | 10.703080% |
| D | 17210 | 297 | 1.725741% |
Noise dominated data is calculated using 1-second bins in cleaned event files. If a bin has >2000 counts, and if more than 50% of those come from <1% of pixels, then it is considered to be noise-dominated and hence unusable.
| Quadrant | # 1 sec bins | Bins with >0 counts | Bins with >2000 counts | High rate bins dominated by noise | Noise dominated (total time) | Noise dominated (detector-on time) | Marked lightcurve |
|---|---|---|---|---|---|---|---|
| A | 25433 | 17214 | 489 | 489 | 1.92% | 2.84% | 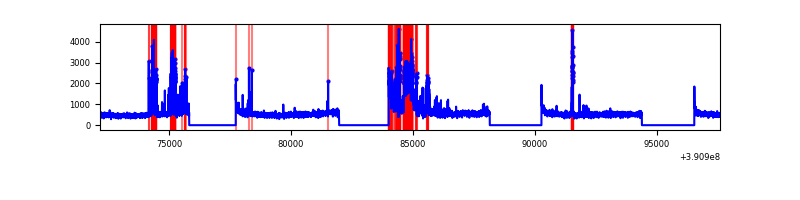 |
| B | 25433 | 17214 | 15298 | 15298 | 60.15% | 88.87% | 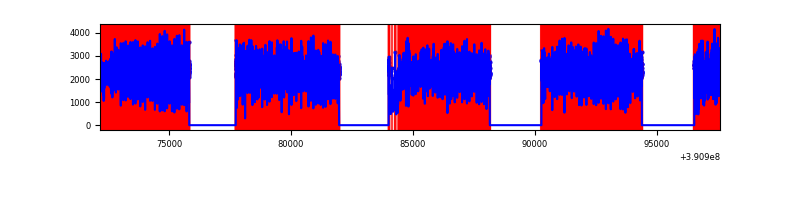 |
| C | 25433 | 17214 | 1492 | 1492 | 5.87% | 8.67% | 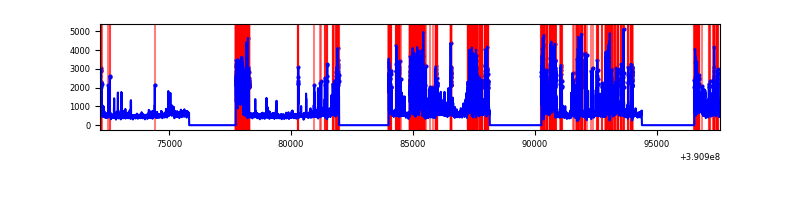 |
| D | 25433 | 17214 | 233 | 233 | 0.92% | 1.35% | 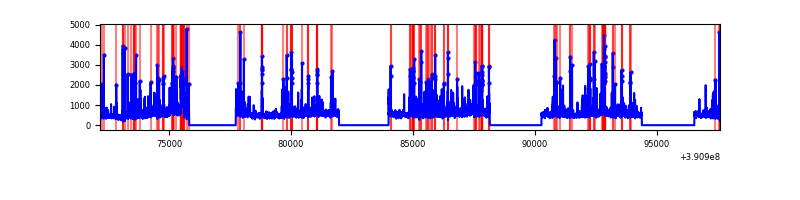 |
Top three noisy pixels from each quadrant. If the there are fewer than three noisy pixels in the level2.evt file, extra rows are filled as -1
| Pixel properties | Quadrant properties | ||||||
|---|---|---|---|---|---|---|---|
| Quadrant | DetID | PixID | Counts | Sigma | Mean | Median | Sigma |
| A | 15 | 169 | 2237723 | 5172.3 | 2176 | 2145 | 432.2 |
| A | 10 | 83 | 428153 | 985.63 | 2176 | 2145 | 432.2 |
| A | 13 | 6 | 31310 | 67.48 | 2176 | 2145 | 432.2 |
| B | 5 | 31 | 10676294 | 47019.59 | 1207 | 1182 | 227.0 |
| B | 5 | 15 | 10639996 | 46859.72 | 1207 | 1182 | 227.0 |
| B | 5 | 14 | 10579062 | 46591.33 | 1207 | 1182 | 227.0 |
| C | 9 | 187 | 5663259 | 12424.34 | 1990 | 2012 | 455.7 |
| C | 15 | 214 | 682480 | 1493.38 | 1990 | 2012 | 455.7 |
| C | 0 | 207 | 445384 | 973.04 | 1990 | 2012 | 455.7 |
| D | 8 | 195 | 523772 | 1021.5 | 2103 | 2051 | 510.7 |
| D | 2 | 250 | 458086 | 892.89 | 2103 | 2051 | 510.7 |
| D | 13 | 249 | 314608 | 611.97 | 2103 | 2051 | 510.7 |
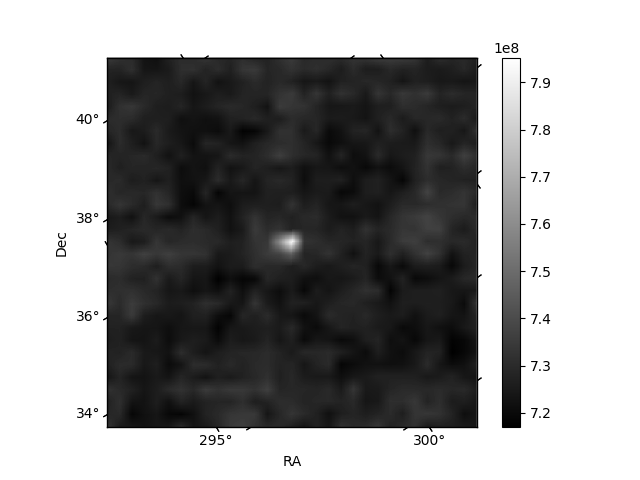
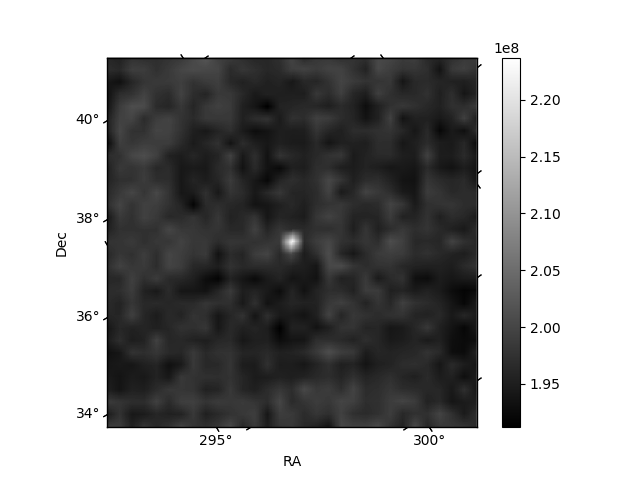
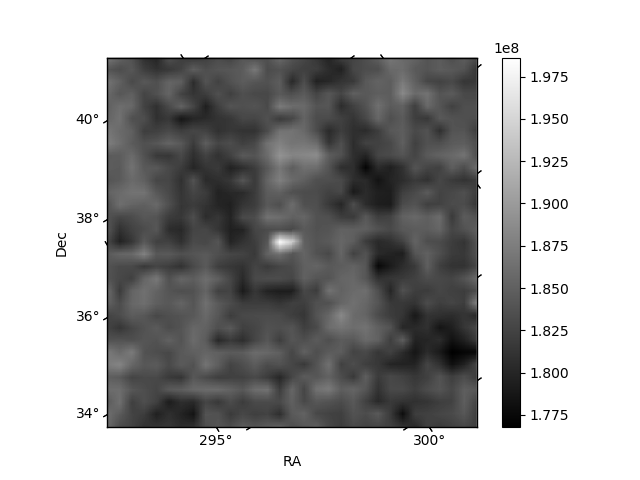
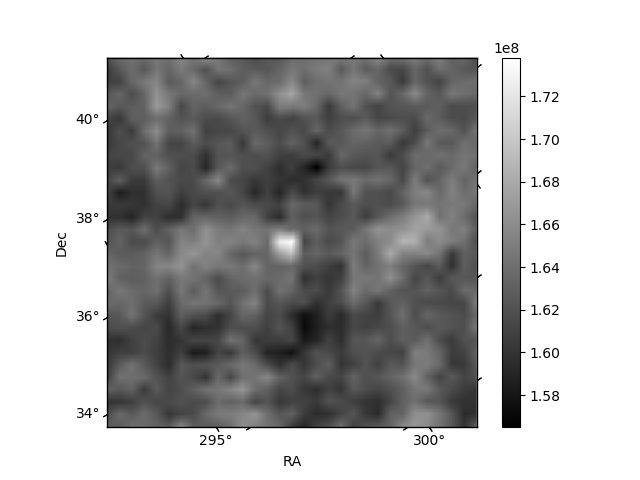
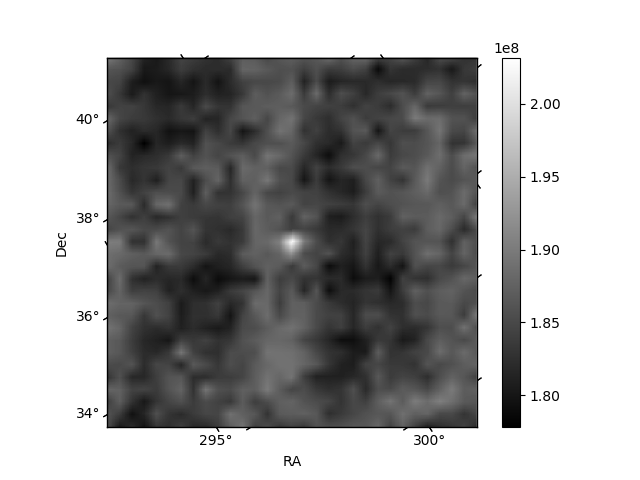
Histogram calculated using DETX and DETY for each event in the final _common_clean file
| Quadrant A | 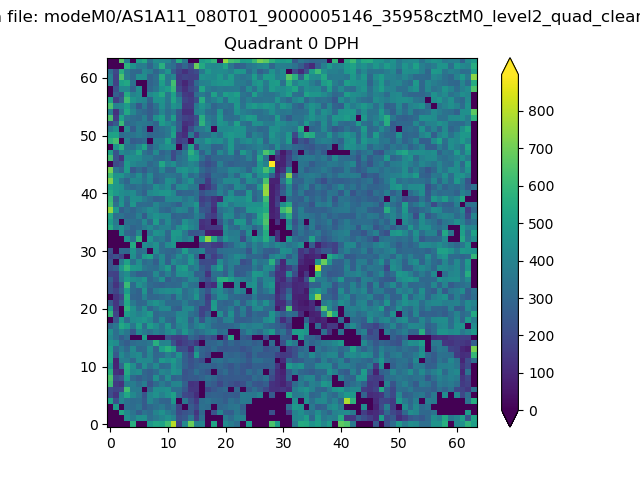 |
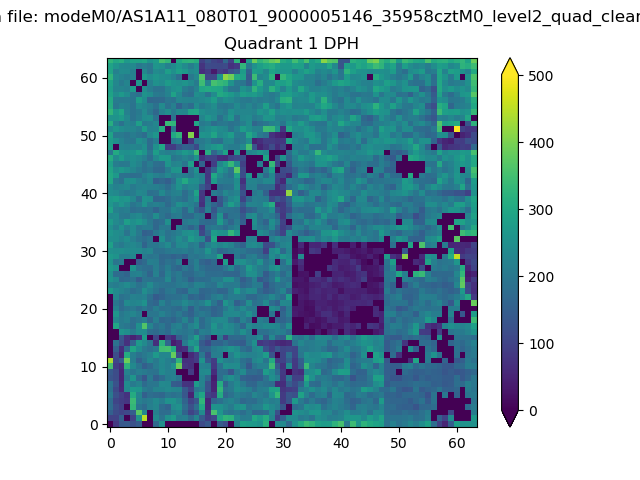 |
Quadrant B |
|---|---|---|---|
| Quadrant D | 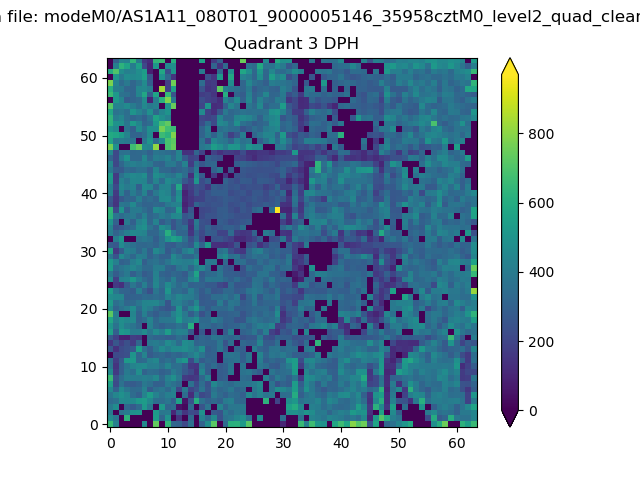 |
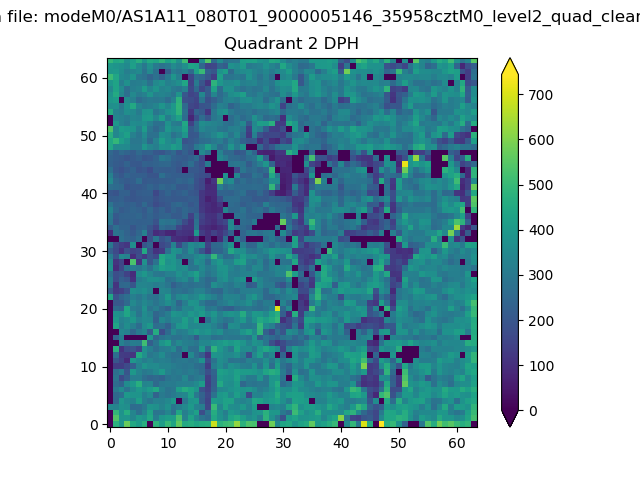 |
Quadrant C |
| Plot type | Count rate plots | Images |
|---|---|---|
| Comparison with Poisson distribution Blue bars denote a histogram of data divided into 1 sec bins. Red curve is a Poisson curve with rate = median count rate of data. |
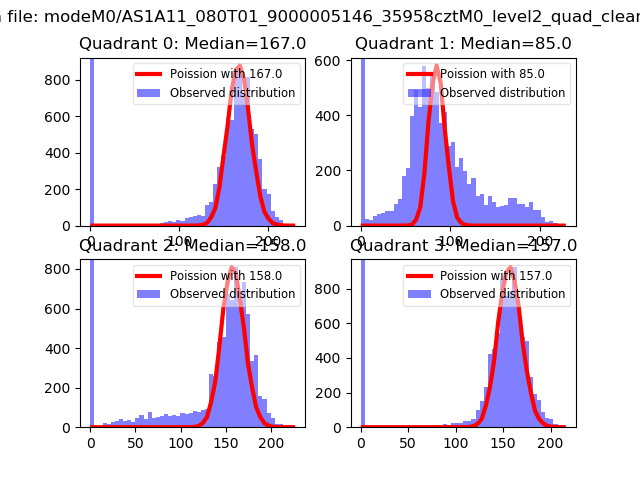 |
 |
| Quadrant-wise count rates Data is divided into 100 sec bins |
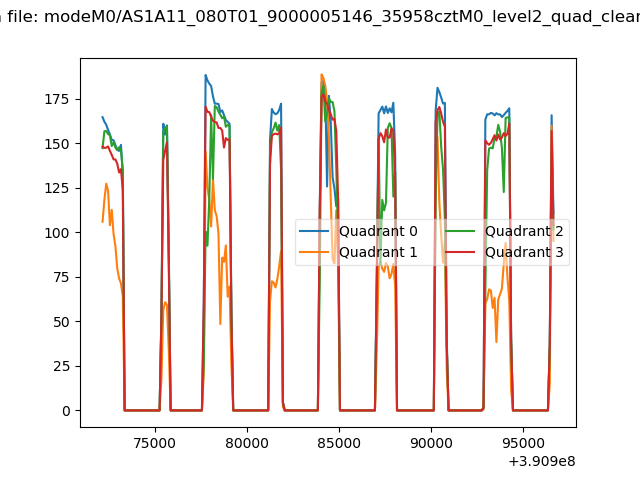 |
|
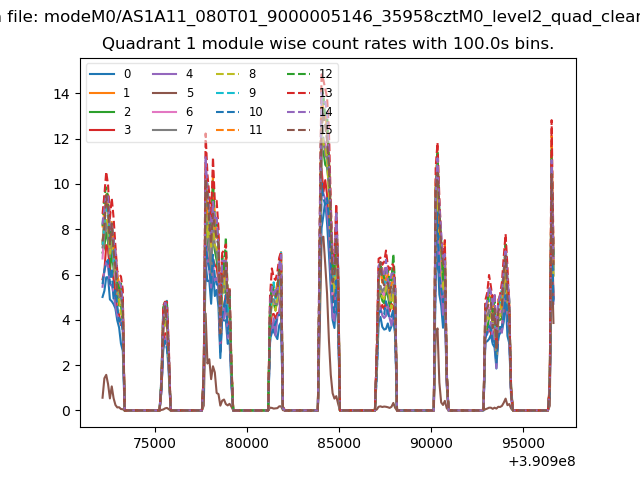
| Module-wise count rates for Quadrant A Data is divided into 100 sec bins |
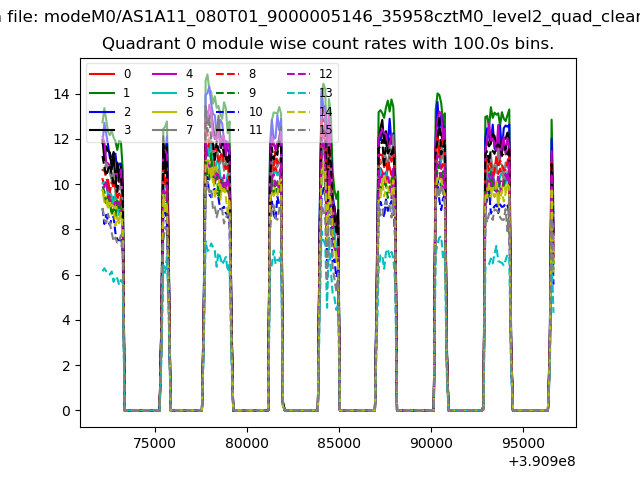 |
 |
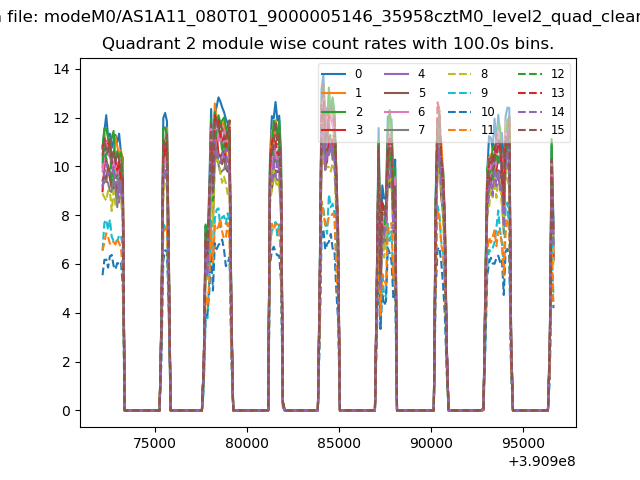
| Module-wise count rates for Quadrant B Data is divided into 100 sec bins |
 |
 |
| Module-wise count rates for Quadrant C Data is divided into 100 sec bins |
 |
 |
| Module-wise count rates for Quadrant D Data is divided into 100 sec bins |
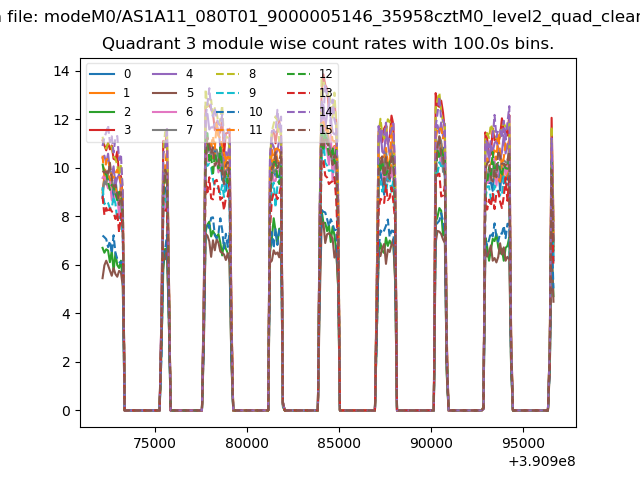 |
 |
| Parameter | Plot |
|---|---|
| CZT HV Monitor | 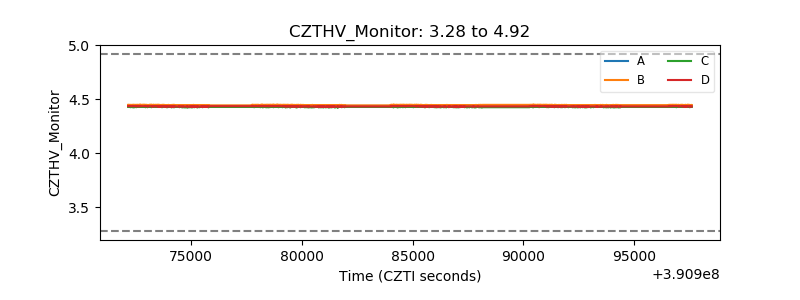 |
| D_VDD | 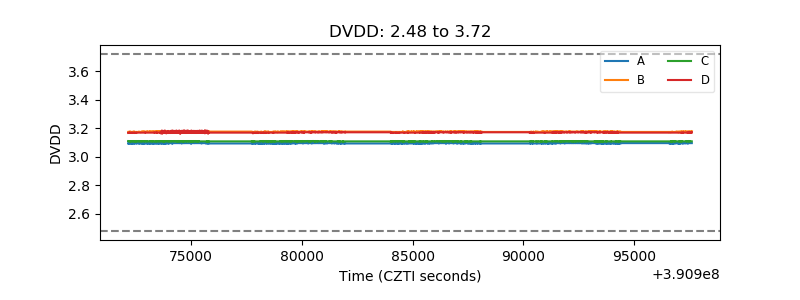 |
| Temperature 1 | 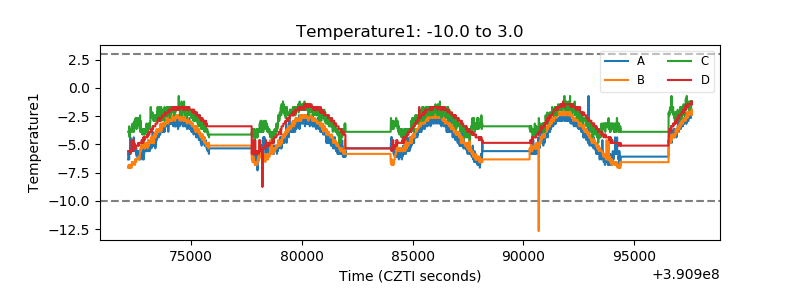 |
| Veto HV Monitor | 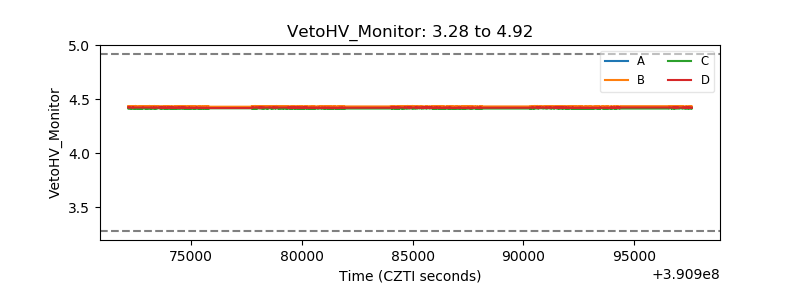 |
| Veto LLD | 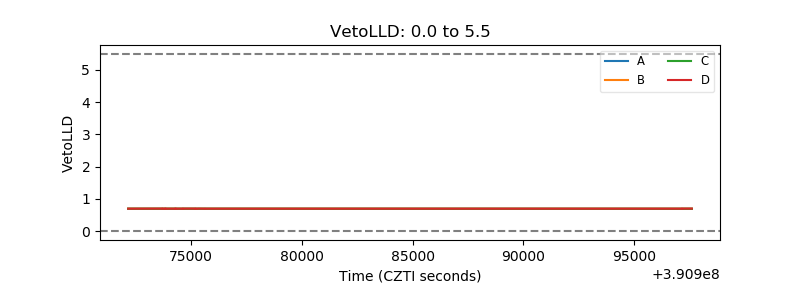 |
| Alpha Counter | 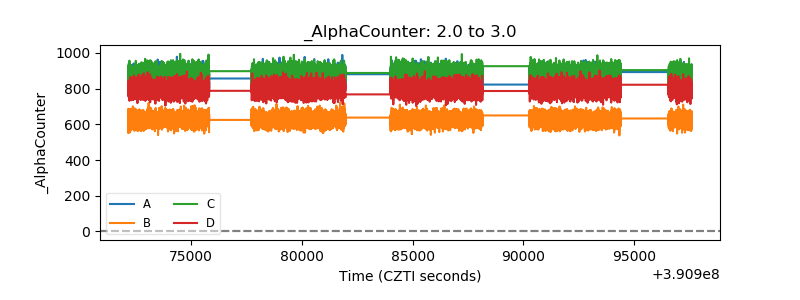 |
| _CPM_Rate | 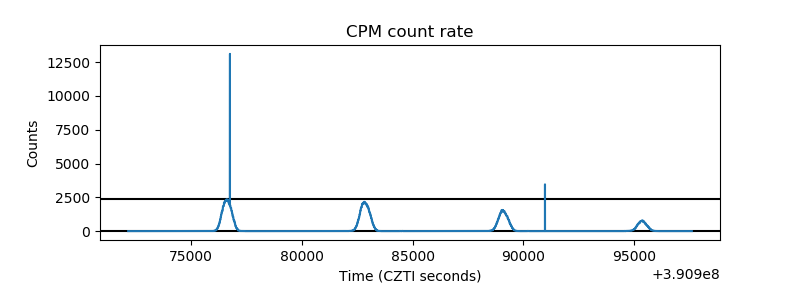 |
| CZT Counter | 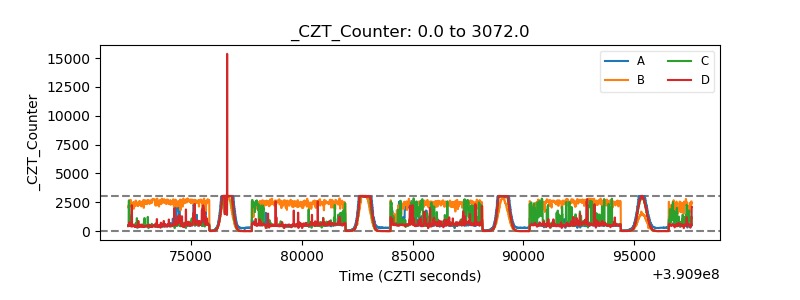 |
| +2.5 Volts monitor | 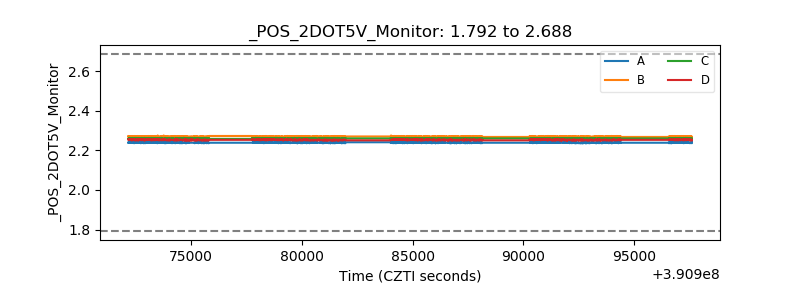 |
| +5 Volts monitor | 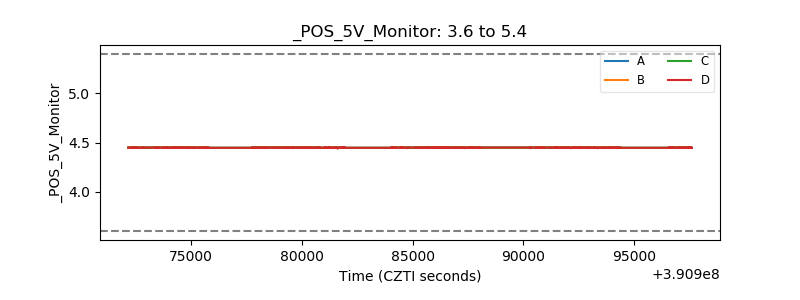 |
| _ROLL_ROT | 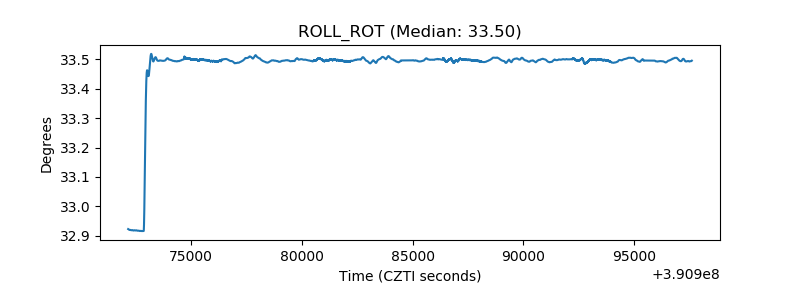 |
| _Roll_DEC | 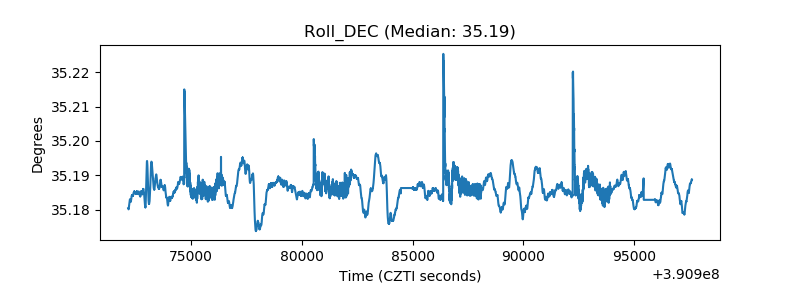 |
| _Roll_RA | 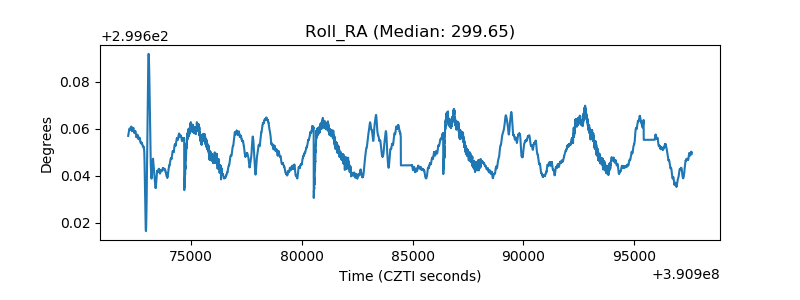 |
| Veto Counter | 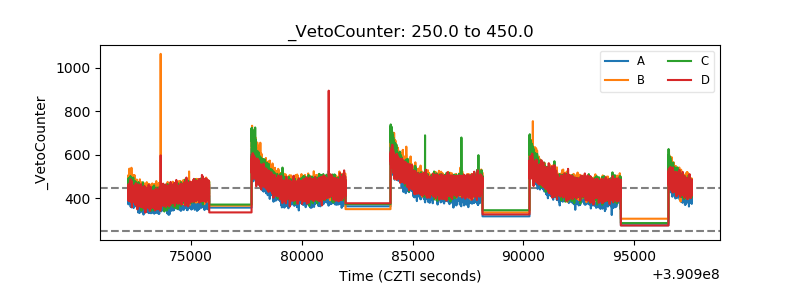 |