| Param | Original file | Final file |
|---|---|---|
| Filename | modeM0/AS1A11_080T01_9000005146_35954cztM0_level2.evt | modeM0/AS1A11_080T01_9000005146_35954cztM0_level2_quad_clean.evt |
| Size (bytes) | 799,197,120 | 74,687,040 |
| Size | 762.2 MB | 71.2 MB |
| Events in quadrant A | 3,642,415 | 514,476 |
| Events in quadrant B | 13,421,676 | 338,725 |
| Events in quadrant C | 3,359,729 | 521,375 |
| Events in quadrant D | 3,403,500 | 496,140 |
| Mode M9 | |||
|---|---|---|---|
| Quadrant | BADHDUFLAG | Total packets | Discarded packets |
| A | 0 | 22 | 0 |
| B | 0 | 22 | 0 |
| C | 0 | 22 | 0 |
| D | 0 | 23 | 0 |
| Mode SS | |||
|---|---|---|---|
| Quadrant | BADHDUFLAG | Total packets | Discarded packets |
| A | 0 | 114 | 0 |
| B | 0 | 114 | 0 |
| C | 0 | 114 | 0 |
| D | 0 | 114 | 0 |
| Mode M0 | |||
|---|---|---|---|
| Quadrant | BADHDUFLAG | Total packets | Discarded packets |
| A | 0 | 14248 | 3 |
| B | 0 | 43562 | 2 |
| C | 0 | 13398 | 2 |
| D | 0 | 13754 | 2 |
| Quadrant | Total seconds | Saturated seconds | Saturation percentage |
|---|---|---|---|
| A | 5557 | 354 | 6.370344% |
| B | 5557 | 5421 | 97.552636% |
| C | 5557 | 171 | 3.077200% |
| D | 5557 | 105 | 1.889509% |
Noise dominated data is calculated using 1-second bins in cleaned event files. If a bin has >2000 counts, and if more than 50% of those come from <1% of pixels, then it is considered to be noise-dominated and hence unusable.
| Quadrant | # 1 sec bins | Bins with >0 counts | Bins with >2000 counts | High rate bins dominated by noise | Noise dominated (total time) | Noise dominated (detector-on time) | Marked lightcurve |
|---|---|---|---|---|---|---|---|
| A | 7351 | 5558 | 277 | 277 | 3.77% | 4.98% | 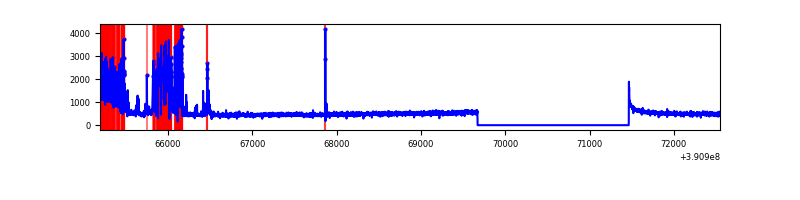 |
| B | 7351 | 5558 | 5159 | 5159 | 70.18% | 92.82% | 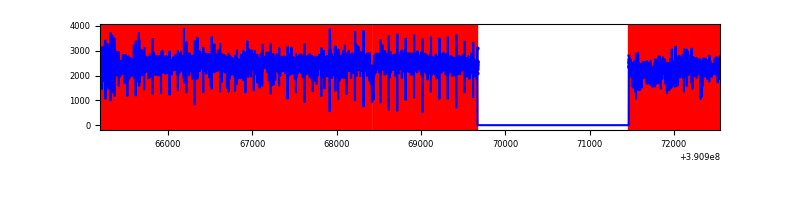 |
| C | 7351 | 5558 | 42 | 42 | 0.57% | 0.76% | 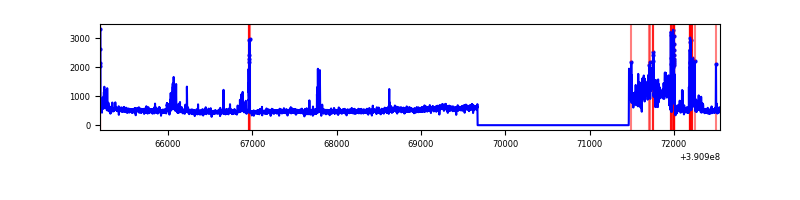 |
| D | 7351 | 5558 | 96 | 96 | 1.31% | 1.73% | 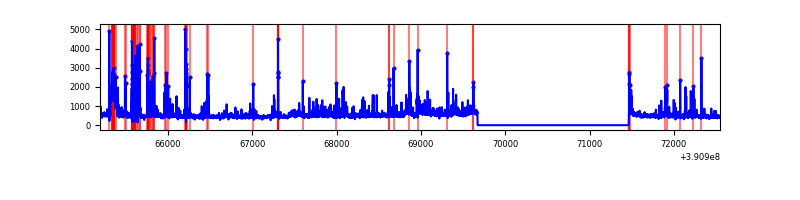 |
Top three noisy pixels from each quadrant. If the there are fewer than three noisy pixels in the level2.evt file, extra rows are filled as -1
| Pixel properties | Quadrant properties | ||||||
|---|---|---|---|---|---|---|---|
| Quadrant | DetID | PixID | Counts | Sigma | Mean | Median | Sigma |
| A | 15 | 169 | 958221 | 7294.5 | 646 | 636 | 131.3 |
| A | 10 | 83 | 162785 | 1235.19 | 646 | 636 | 131.3 |
| A | 13 | 6 | 10375 | 74.19 | 646 | 636 | 131.3 |
| B | 5 | 14 | 3748272 | 48990.98 | 393 | 385 | 76.5 |
| B | 5 | 31 | 3718824 | 48606.04 | 393 | 385 | 76.5 |
| B | 5 | 15 | 3711240 | 48506.91 | 393 | 385 | 76.5 |
| C | 9 | 187 | 583357 | 3934.16 | 634 | 640 | 148.1 |
| C | 15 | 214 | 233238 | 1570.36 | 634 | 640 | 148.1 |
| C | 0 | 10 | 52530 | 350.33 | 634 | 640 | 148.1 |
| D | 7 | 223 | 416110 | 2657.43 | 632 | 617 | 156.4 |
| D | 13 | 249 | 158254 | 1008.22 | 632 | 617 | 156.4 |
| D | 8 | 195 | 135660 | 863.71 | 632 | 617 | 156.4 |
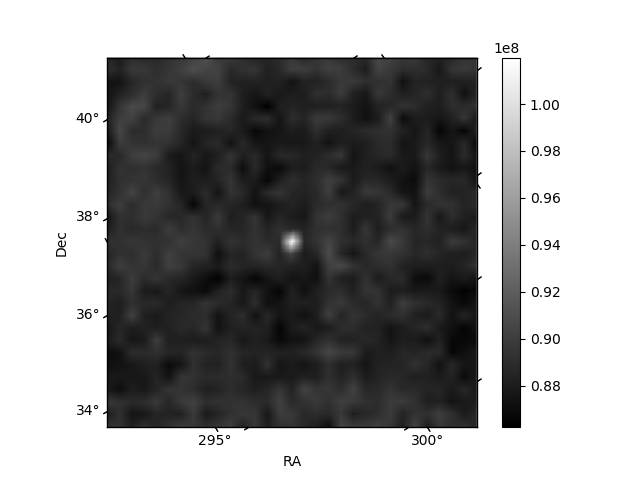
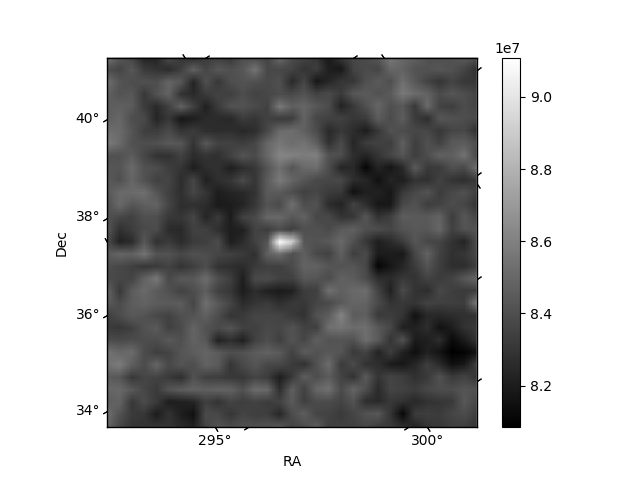
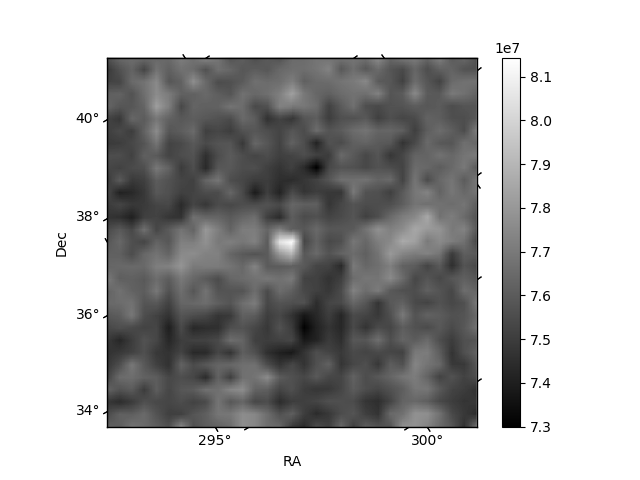
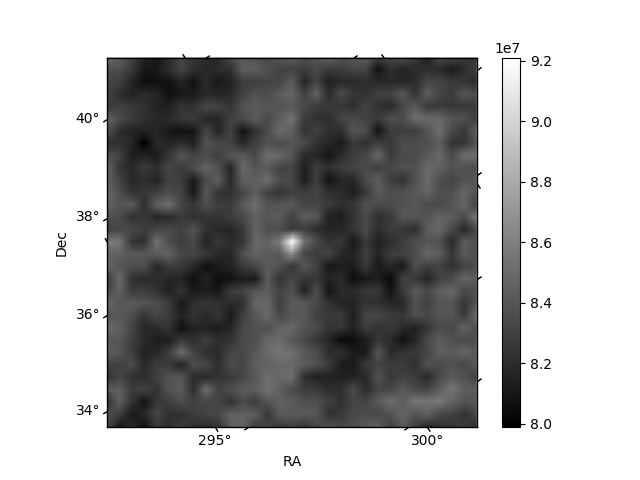
Histogram calculated using DETX and DETY for each event in the final _common_clean file
| Quadrant A | 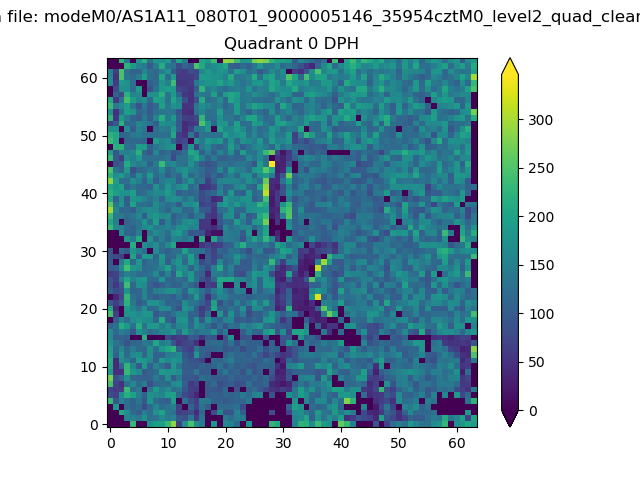 |
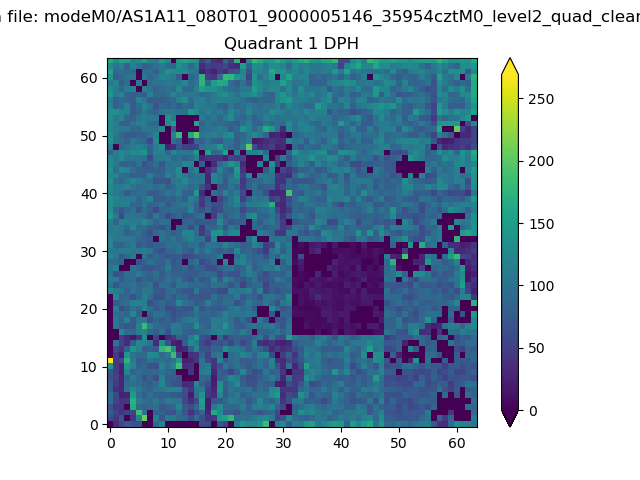 |
Quadrant B |
|---|---|---|---|
| Quadrant D | 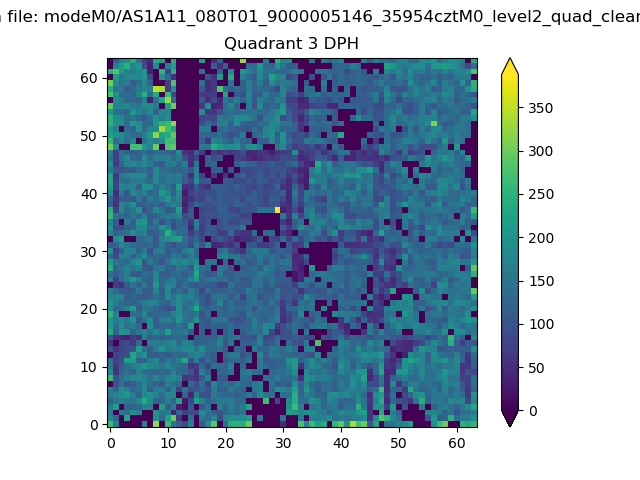 |
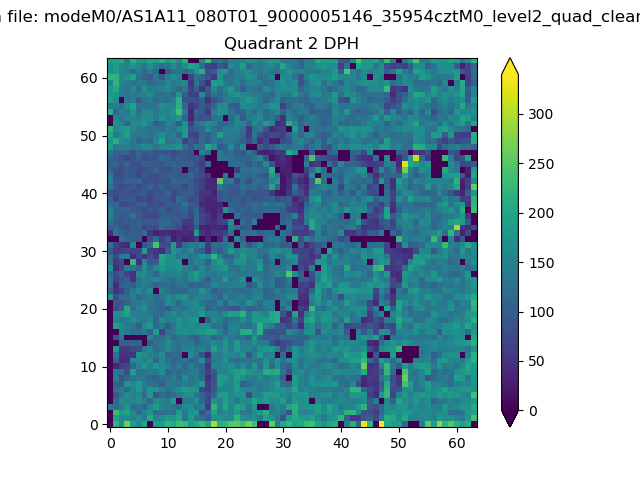 |
Quadrant C |
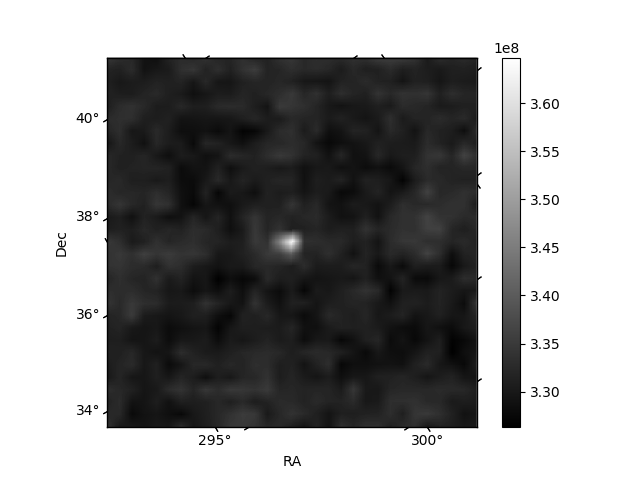
| Plot type | Count rate plots | Images |
|---|---|---|
| Comparison with Poisson distribution Blue bars denote a histogram of data divided into 1 sec bins. Red curve is a Poisson curve with rate = median count rate of data. |
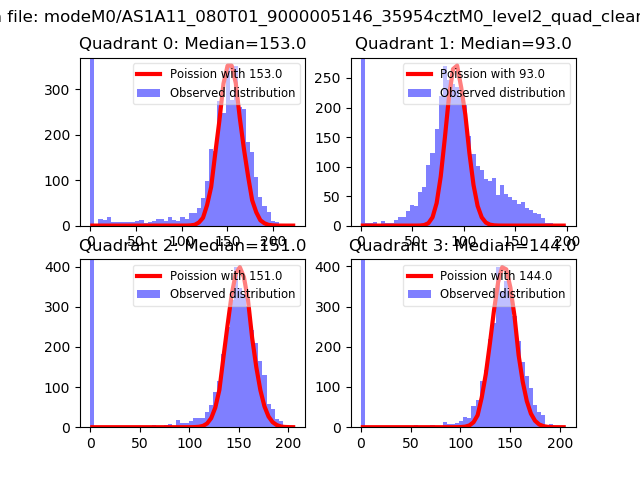 |
 |
| Quadrant-wise count rates Data is divided into 100 sec bins |
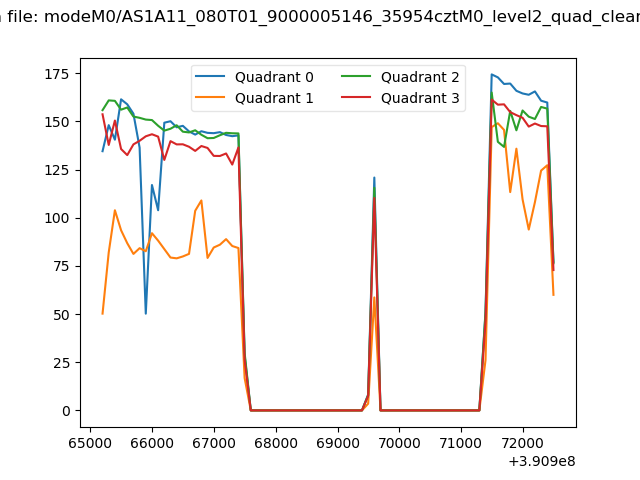 |
|
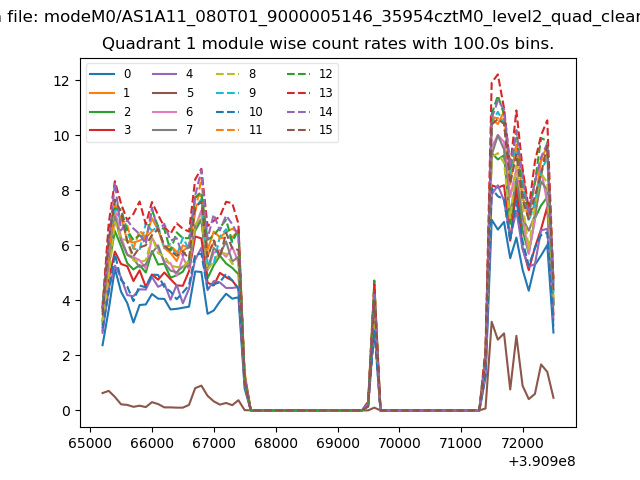
| Module-wise count rates for Quadrant A Data is divided into 100 sec bins |
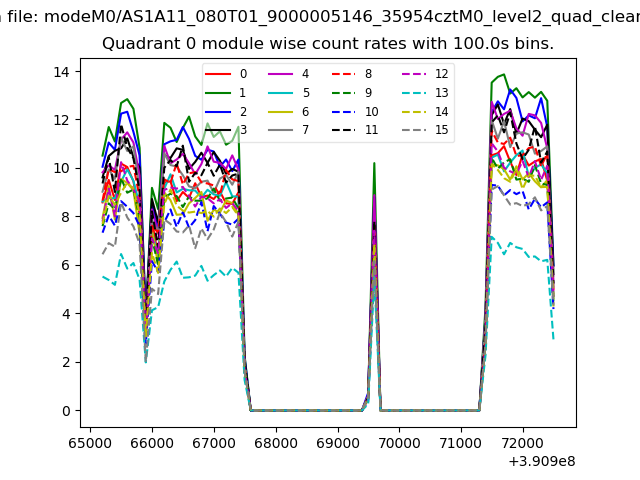 |
 |
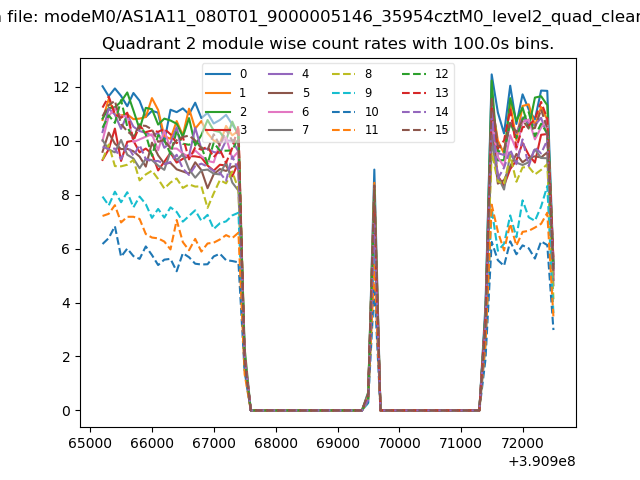
| Module-wise count rates for Quadrant B Data is divided into 100 sec bins |
 |
 |
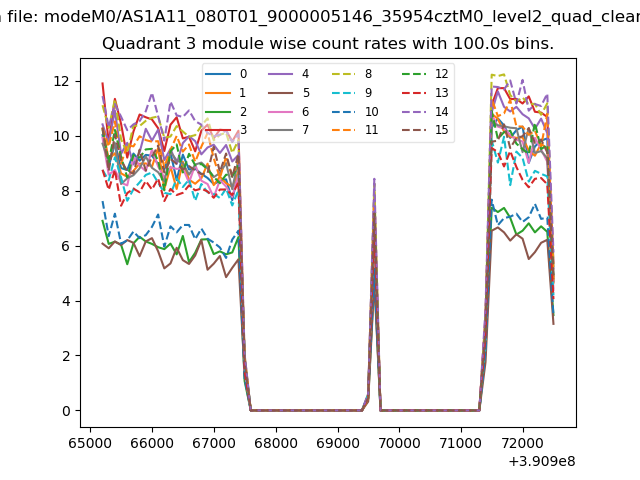
| Module-wise count rates for Quadrant C Data is divided into 100 sec bins |
 |
 |
| Module-wise count rates for Quadrant D Data is divided into 100 sec bins |
 |
 |
| Parameter | Plot |
|---|---|
| CZT HV Monitor | 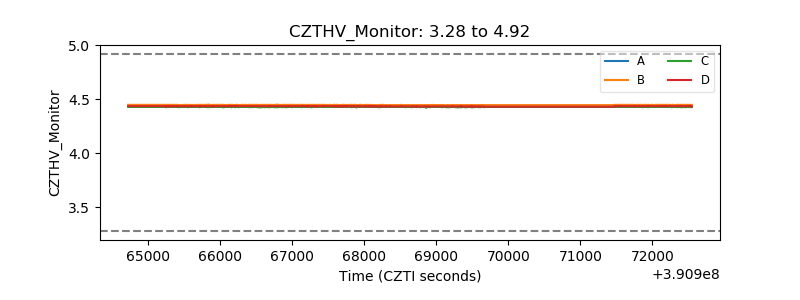 |
| D_VDD | 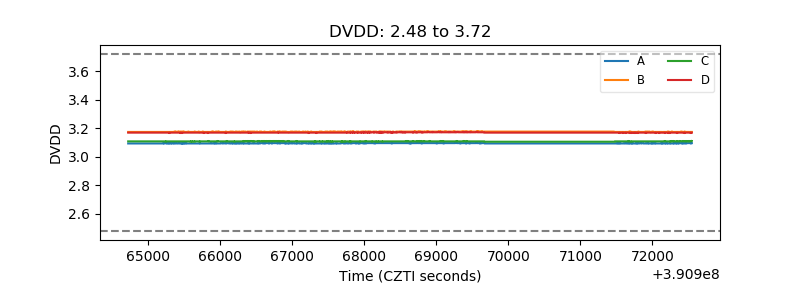 |
| Temperature 1 | 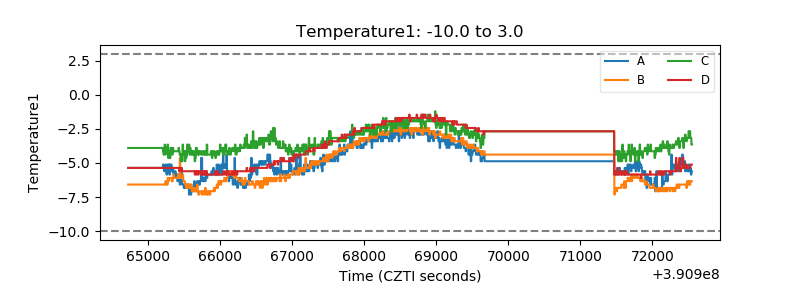 |
| Veto HV Monitor | 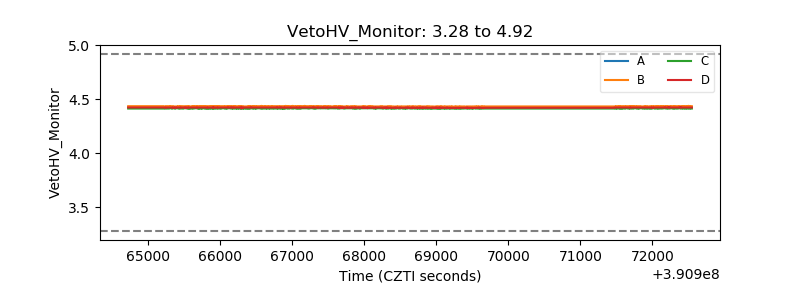 |
| Veto LLD | 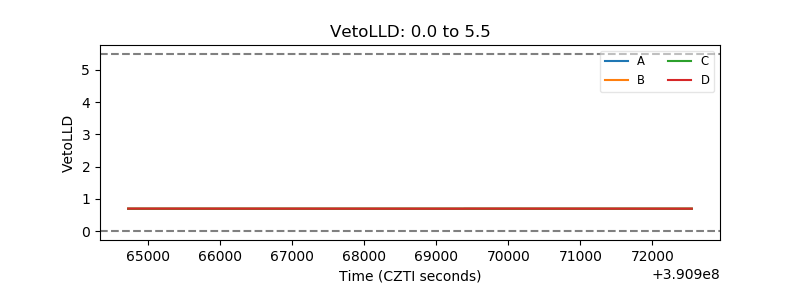 |
| Alpha Counter | 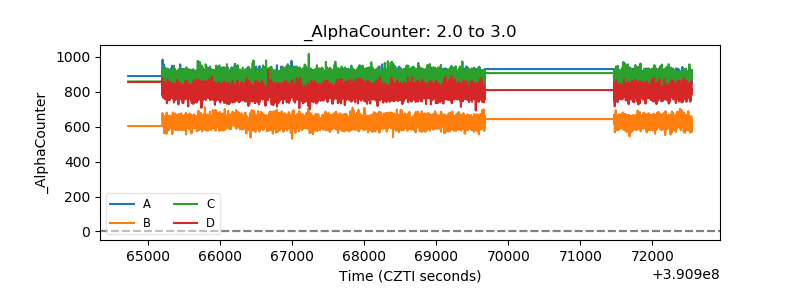 |
| _CPM_Rate | 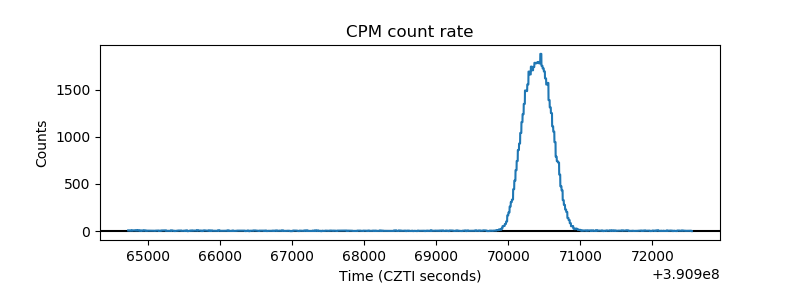 |
| CZT Counter | 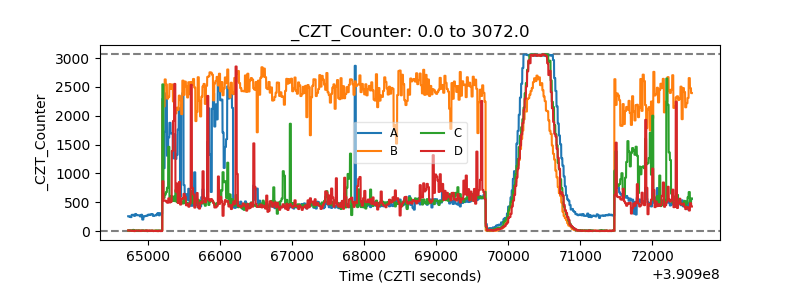 |
| +2.5 Volts monitor | 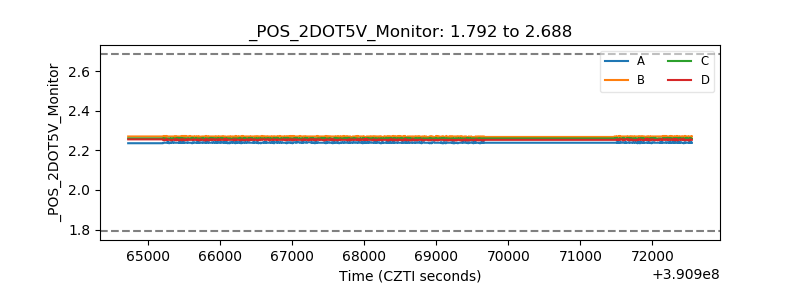 |
| +5 Volts monitor | 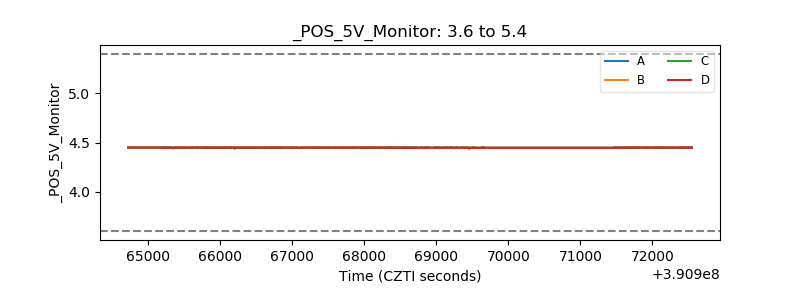 |
| _ROLL_ROT | 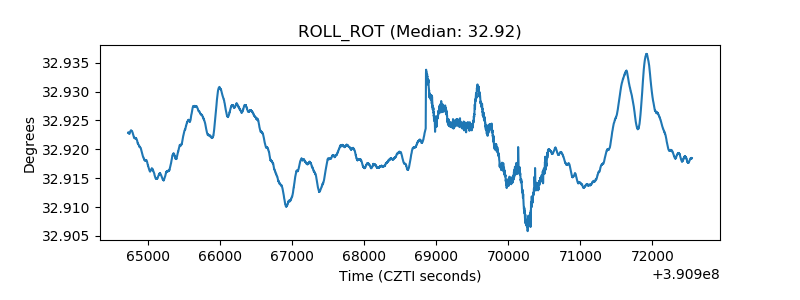 |
| _Roll_DEC | 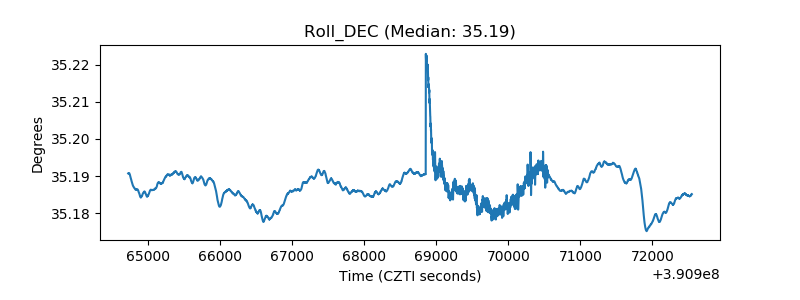 |
| _Roll_RA | 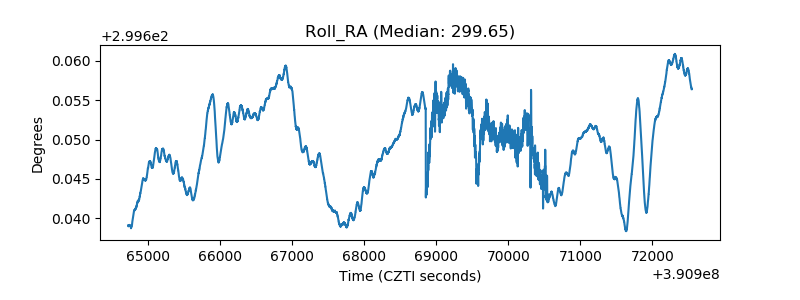 |
| Veto Counter | 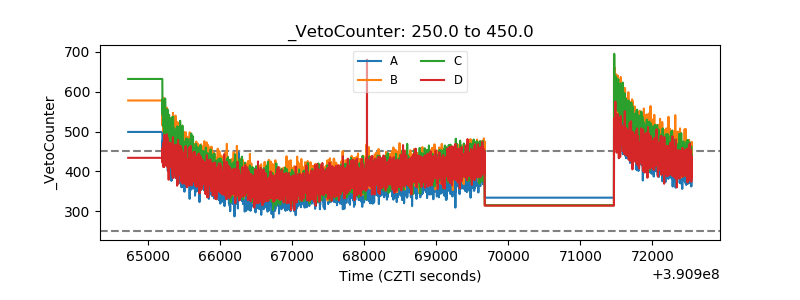 |