| Param | Original file | Final file |
|---|---|---|
| Filename | modeM0/AS1A11_080T01_9000005146_35952cztM0_level2.evt | modeM0/AS1A11_080T01_9000005146_35952cztM0_level2_quad_clean.evt |
| Size (bytes) | 946,232,640 | 71,553,600 |
| Size | 902.4 MB | 68.2 MB |
| Events in quadrant A | 5,767,859 | 497,623 |
| Events in quadrant B | 12,854,620 | 306,786 |
| Events in quadrant C | 5,731,088 | 501,431 |
| Events in quadrant D | 3,940,242 | 481,971 |
| Mode M9 | |||
|---|---|---|---|
| Quadrant | BADHDUFLAG | Total packets | Discarded packets |
| A | 0 | 16 | 0 |
| B | 0 | 16 | 0 |
| C | 0 | 16 | 0 |
| D | 0 | 16 | 0 |
| Mode SS | |||
|---|---|---|---|
| Quadrant | BADHDUFLAG | Total packets | Discarded packets |
| A | 0 | 112 | 0 |
| B | 0 | 112 | 0 |
| C | 0 | 112 | 0 |
| D | 0 | 112 | 0 |
| Mode M0 | |||
|---|---|---|---|
| Quadrant | BADHDUFLAG | Total packets | Discarded packets |
| A | 0 | 20816 | 3 |
| B | 0 | 41770 | 2 |
| C | 0 | 20475 | 2 |
| D | 0 | 15540 | 2 |
| Quadrant | Total seconds | Saturated seconds | Saturation percentage |
|---|---|---|---|
| A | 5379 | 1484 | 27.588771% |
| B | 5379 | 5200 | 96.672244% |
| C | 5379 | 1682 | 31.269753% |
| D | 5379 | 262 | 4.870794% |
Noise dominated data is calculated using 1-second bins in cleaned event files. If a bin has >2000 counts, and if more than 50% of those come from <1% of pixels, then it is considered to be noise-dominated and hence unusable.
| Quadrant | # 1 sec bins | Bins with >0 counts | Bins with >2000 counts | High rate bins dominated by noise | Noise dominated (total time) | Noise dominated (detector-on time) | Marked lightcurve |
|---|---|---|---|---|---|---|---|
| A | 7052 | 5380 | 993 | 993 | 14.08% | 18.46% | 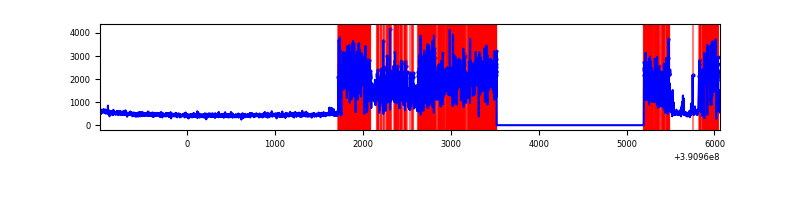 |
| B | 7052 | 5380 | 4855 | 4855 | 68.85% | 90.24% | 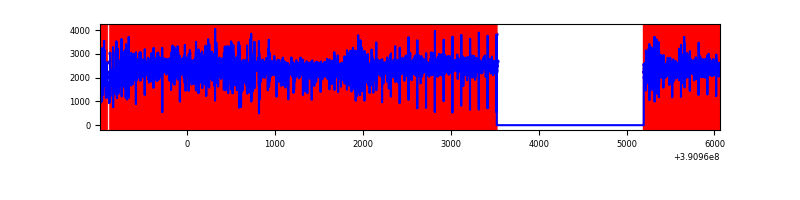 |
| C | 7052 | 5380 | 887 | 887 | 12.58% | 16.49% | 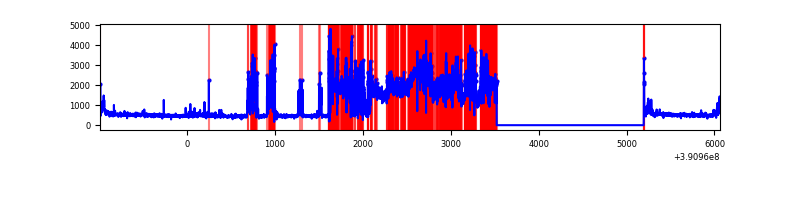 |
| D | 7052 | 5380 | 208 | 208 | 2.95% | 3.87% | 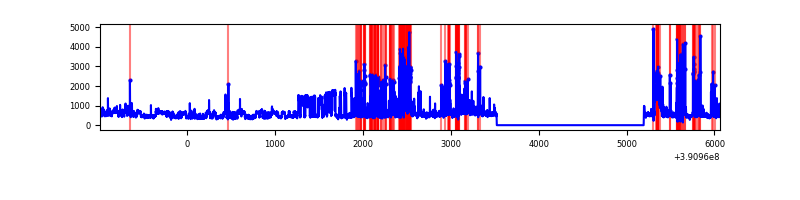 |
Top three noisy pixels from each quadrant. If the there are fewer than three noisy pixels in the level2.evt file, extra rows are filled as -1
| Pixel properties | Quadrant properties | ||||||
|---|---|---|---|---|---|---|---|
| Quadrant | DetID | PixID | Counts | Sigma | Mean | Median | Sigma |
| A | 15 | 169 | 3477599 | 30401.78 | 557 | 549 | 114.4 |
| A | 10 | 83 | 126264 | 1099.2 | 557 | 549 | 114.4 |
| A | 13 | 6 | 8514 | 69.64 | 557 | 549 | 114.4 |
| B | 5 | 14 | 3291165 | 46014.09 | 366 | 357 | 71.5 |
| B | 5 | 31 | 3241005 | 45312.72 | 366 | 357 | 71.5 |
| B | 5 | 15 | 3232576 | 45194.86 | 366 | 357 | 71.5 |
| C | 9 | 187 | 3657633 | 33278.7 | 466 | 469 | 109.9 |
| C | 15 | 214 | 178335 | 1618.51 | 466 | 469 | 109.9 |
| C | 0 | 10 | 34452 | 309.23 | 466 | 469 | 109.9 |
| D | 2 | 31 | 605527 | 4155.97 | 592 | 576 | 145.6 |
| D | 7 | 223 | 525232 | 3604.35 | 592 | 576 | 145.6 |
| D | 1 | 52 | 125639 | 859.17 | 592 | 576 | 145.6 |
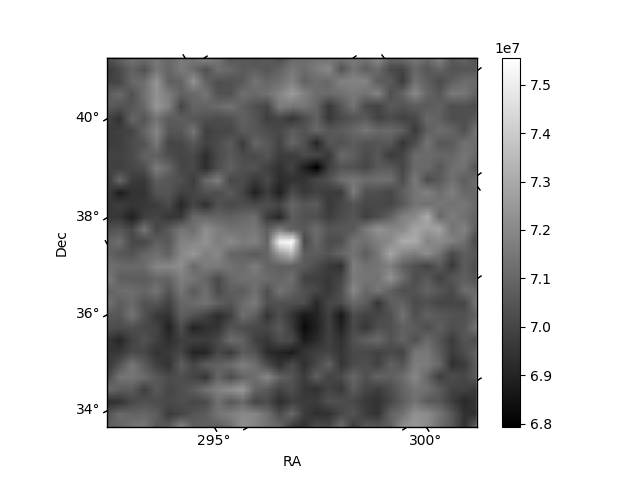
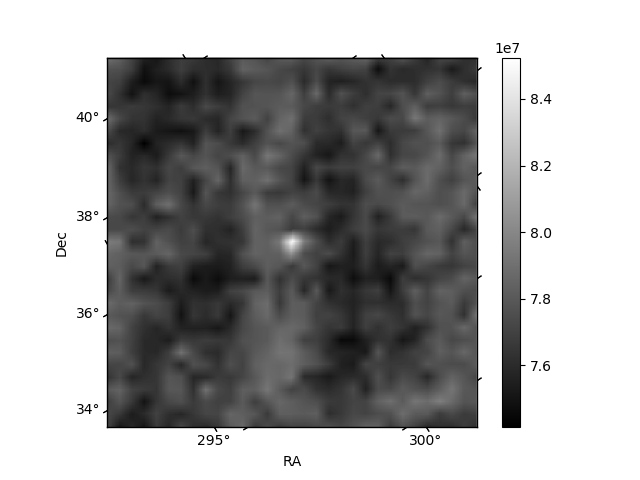
Histogram calculated using DETX and DETY for each event in the final _common_clean file
| Quadrant A | 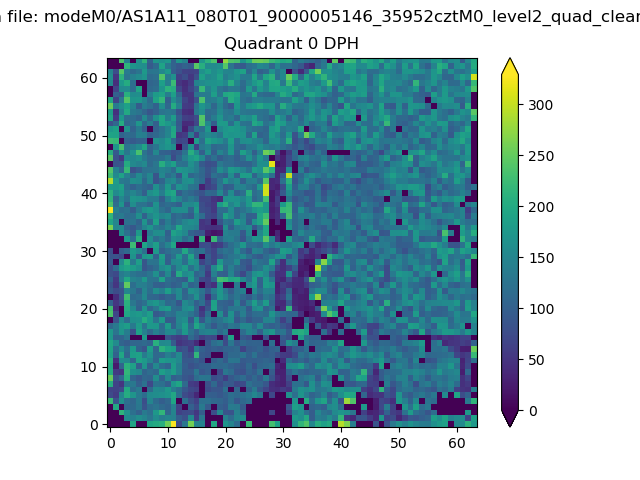 |
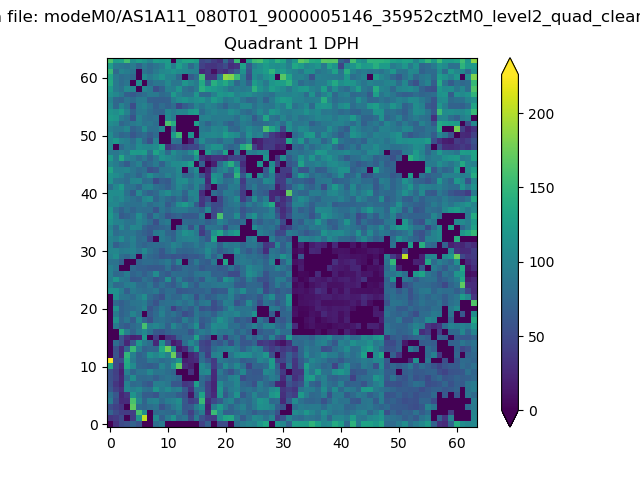 |
Quadrant B |
|---|---|---|---|
| Quadrant D | 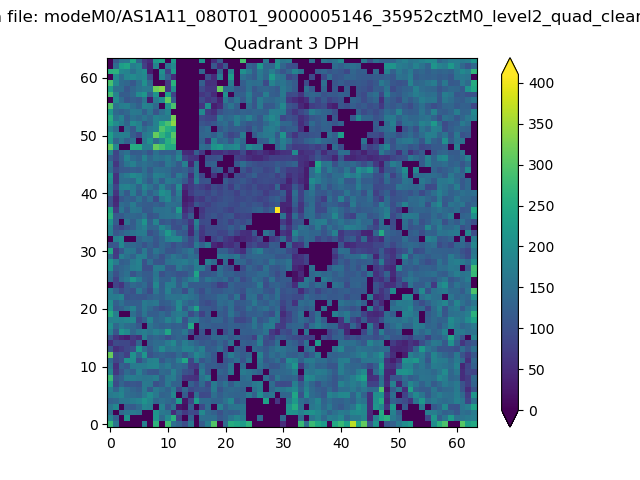 |
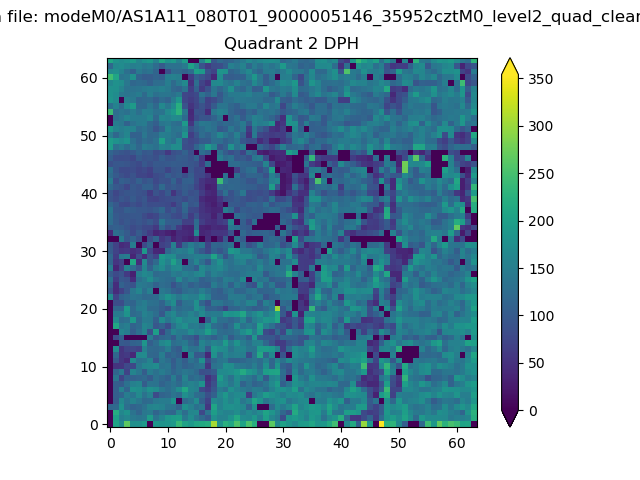 |
Quadrant C |
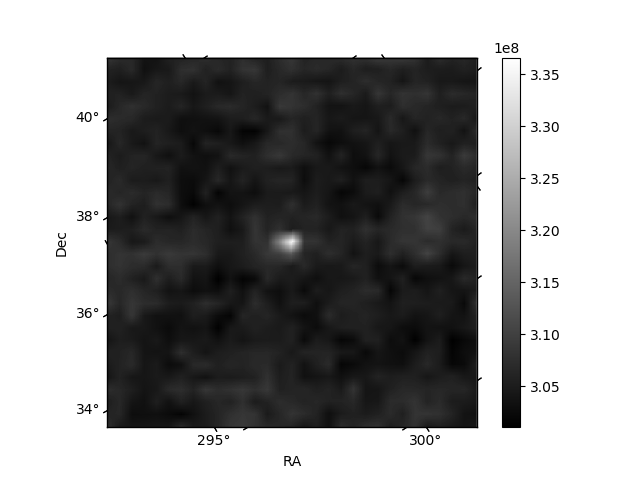
| Plot type | Count rate plots | Images |
|---|---|---|
| Comparison with Poisson distribution Blue bars denote a histogram of data divided into 1 sec bins. Red curve is a Poisson curve with rate = median count rate of data. |
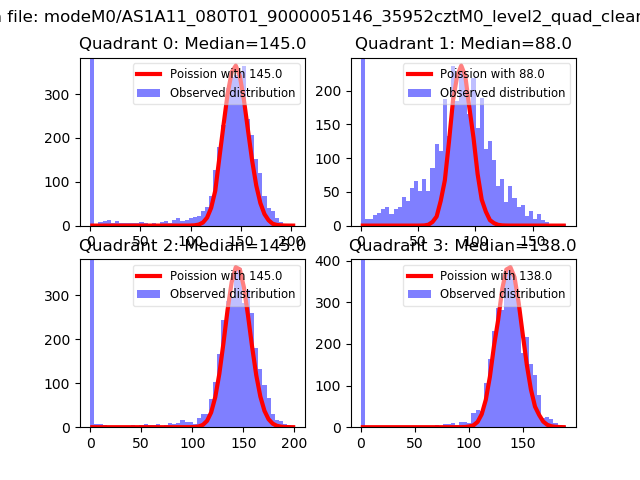 |
 |
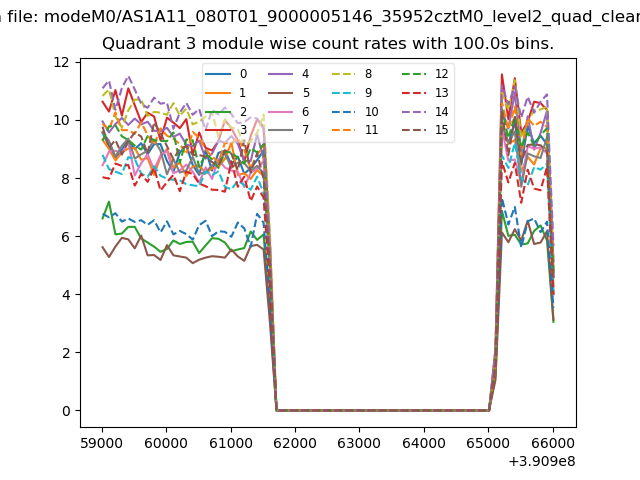
| Quadrant-wise count rates Data is divided into 100 sec bins |
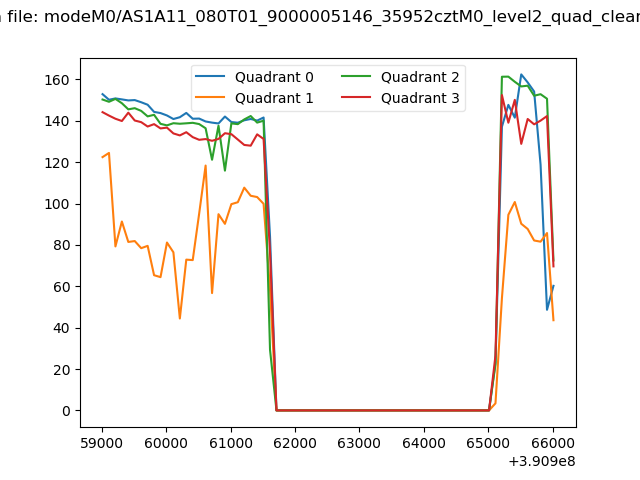 |
|
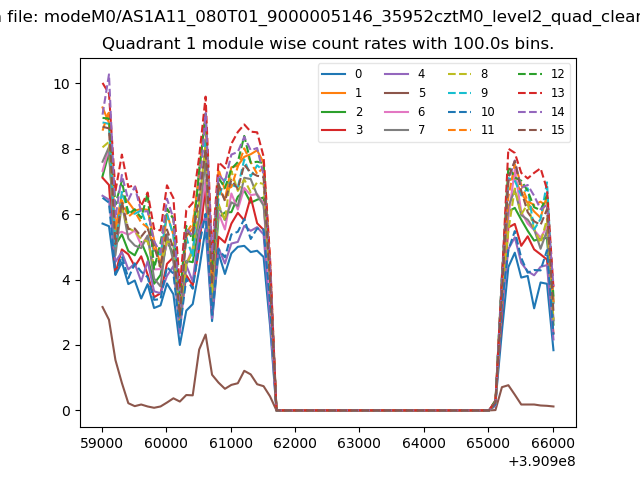
| Module-wise count rates for Quadrant A Data is divided into 100 sec bins |
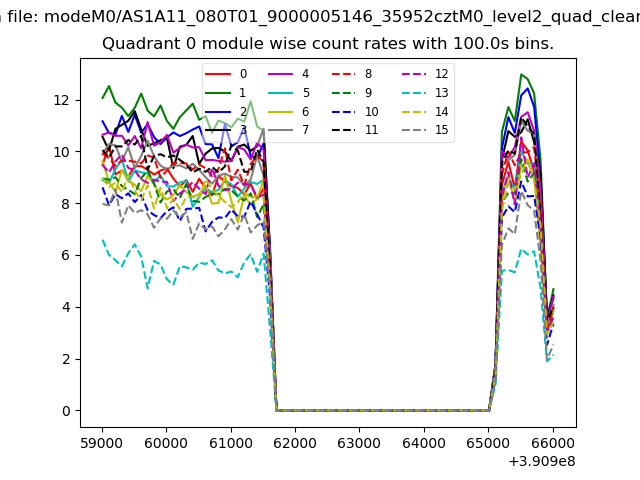 |
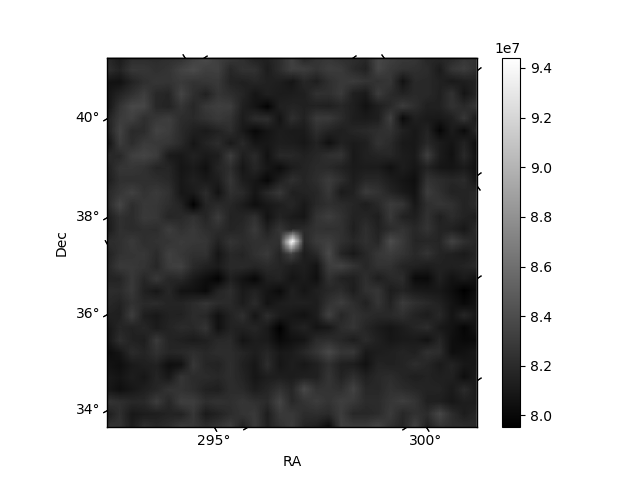 |
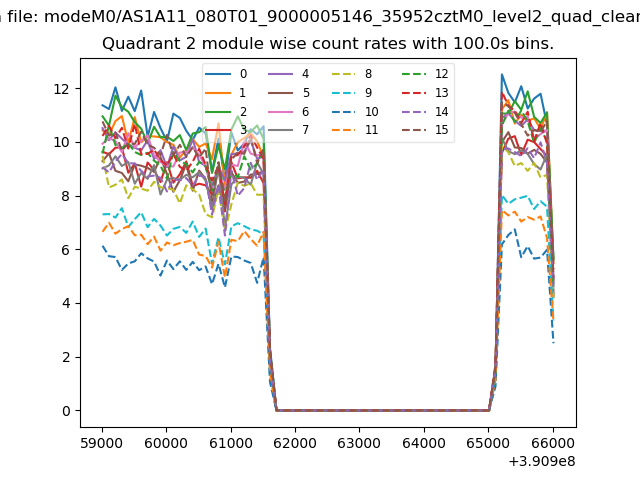
| Module-wise count rates for Quadrant B Data is divided into 100 sec bins |
 |
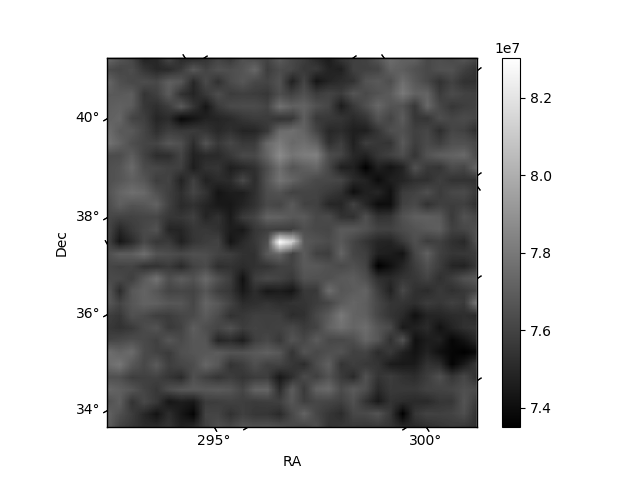 |
| Module-wise count rates for Quadrant C Data is divided into 100 sec bins |
 |
 |
| Module-wise count rates for Quadrant D Data is divided into 100 sec bins |
 |
 |
| Parameter | Plot |
|---|---|
| CZT HV Monitor | 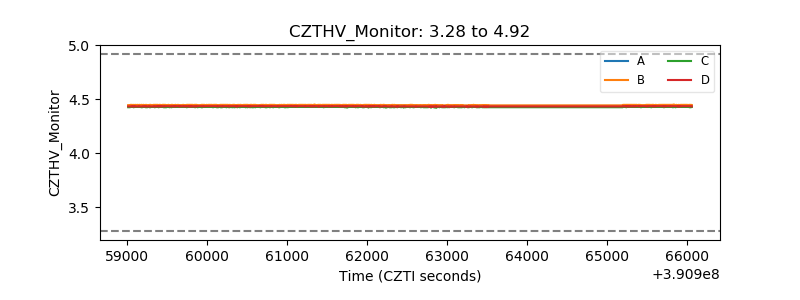 |
| D_VDD | 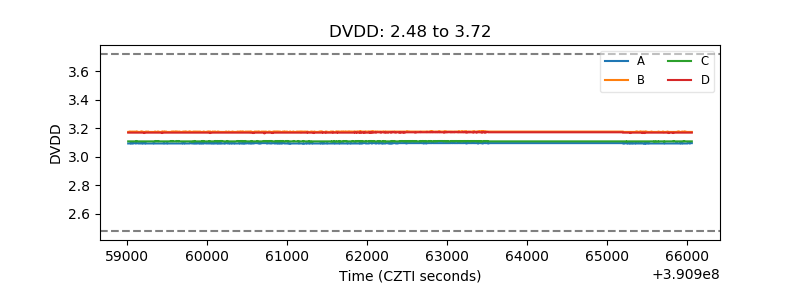 |
| Temperature 1 | 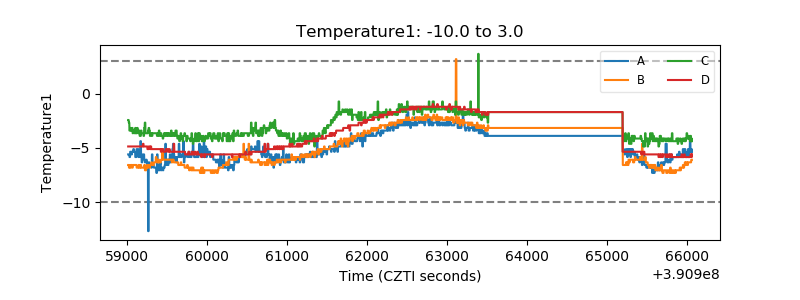 |
| Veto HV Monitor | 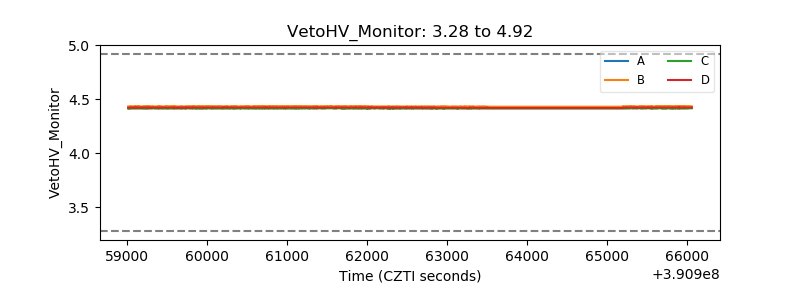 |
| Veto LLD | 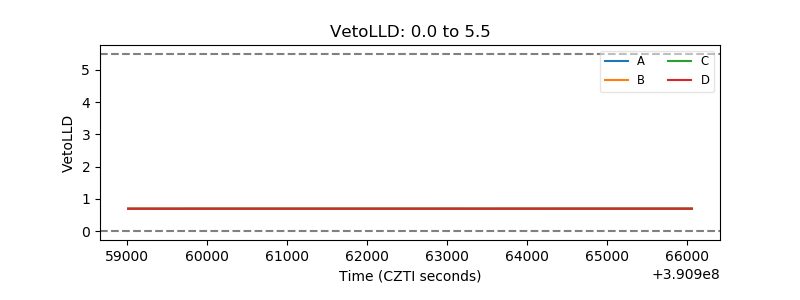 |
| Alpha Counter | 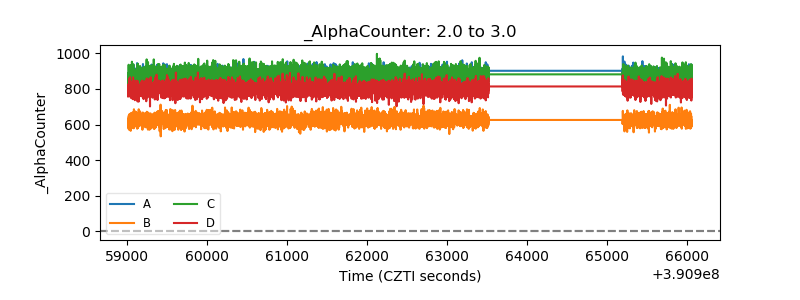 |
| _CPM_Rate | 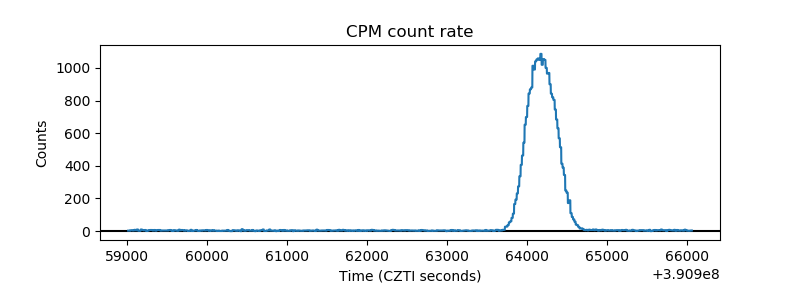 |
| CZT Counter | 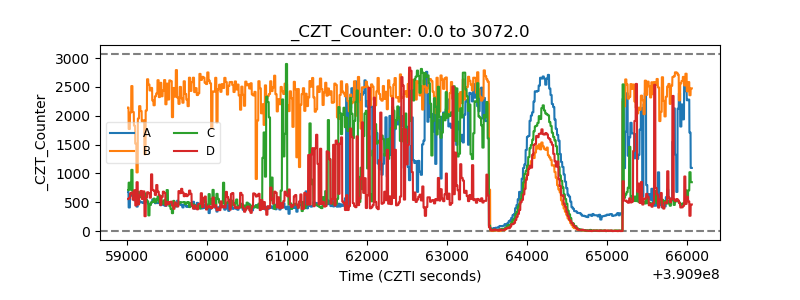 |
| +2.5 Volts monitor | 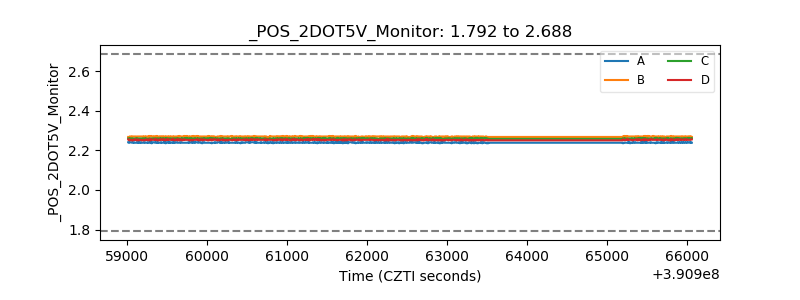 |
| +5 Volts monitor | 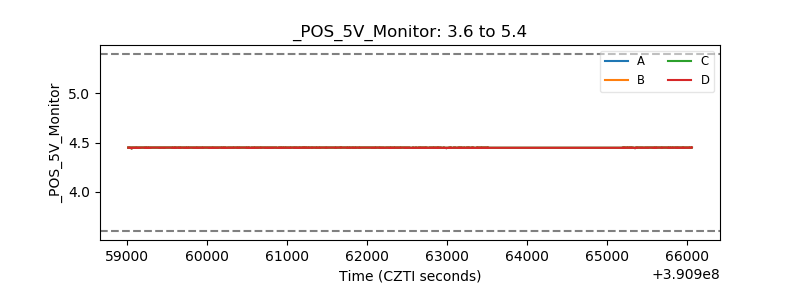 |
| _ROLL_ROT | 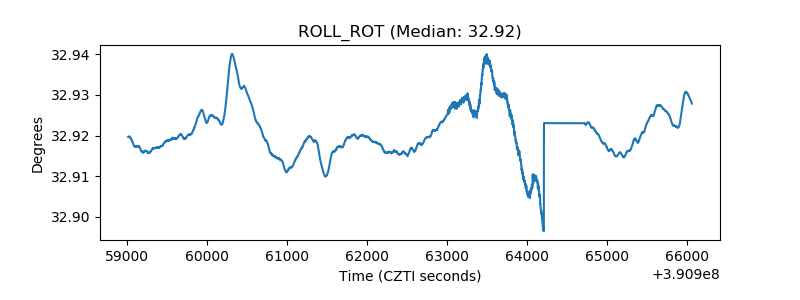 |
| _Roll_DEC | 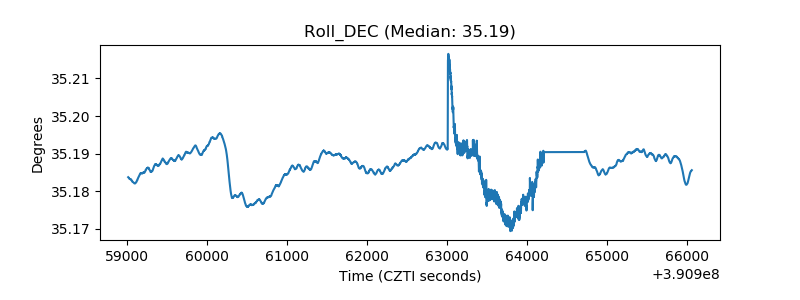 |
| _Roll_RA | 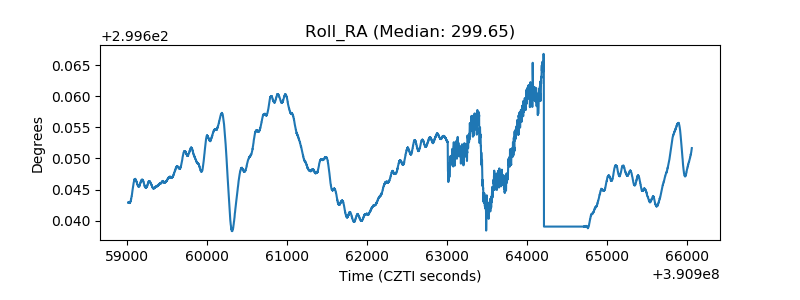 |
| Veto Counter | 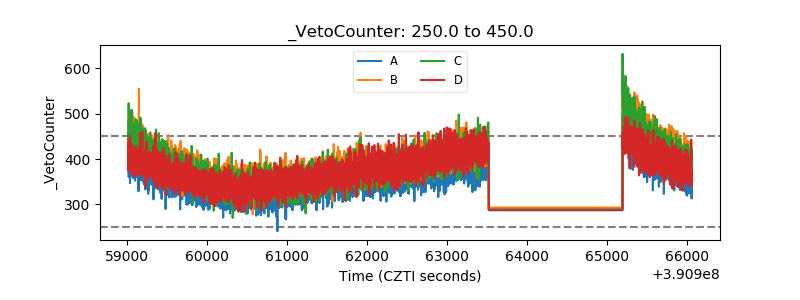 |