| Param | Original file | Final file |
|---|---|---|
| Filename | modeM0/AS1A11_080T01_9000005146_35943cztM0_level2.evt | modeM0/AS1A11_080T01_9000005146_35943cztM0_level2_quad_clean.evt |
| Size (bytes) | 432,434,880 | 62,130,240 |
| Size | 412.4 MB | 59.3 MB |
| Events in quadrant A | 2,618,532 | 405,529 |
| Events in quadrant B | 4,372,192 | 380,314 |
| Events in quadrant C | 2,863,001 | 381,191 |
| Events in quadrant D | 2,915,148 | 375,801 |
| Mode M9 | |||
|---|---|---|---|
| Quadrant | BADHDUFLAG | Total packets | Discarded packets |
| A | 0 | 28 | 0 |
| B | 0 | 28 | 0 |
| C | 0 | 28 | 0 |
| D | 0 | 29 | 0 |
| Mode SS | |||
|---|---|---|---|
| Quadrant | BADHDUFLAG | Total packets | Discarded packets |
| A | 0 | 100 | 0 |
| B | 0 | 100 | 0 |
| C | 0 | 100 | 0 |
| D | 0 | 100 | 0 |
| Mode M0 | |||
|---|---|---|---|
| Quadrant | BADHDUFLAG | Total packets | Discarded packets |
| A | 0 | 10430 | 3 |
| B | 0 | 16059 | 2 |
| C | 0 | 11128 | 2 |
| D | 0 | 11495 | 2 |
| Quadrant | Total seconds | Saturated seconds | Saturation percentage |
|---|---|---|---|
| A | 4814 | 6 | 0.124636% |
| B | 4814 | 677 | 14.063149% |
| C | 4814 | 109 | 2.264229% |
| D | 4814 | 74 | 1.537183% |
Noise dominated data is calculated using 1-second bins in cleaned event files. If a bin has >2000 counts, and if more than 50% of those come from <1% of pixels, then it is considered to be noise-dominated and hence unusable.
| Quadrant | # 1 sec bins | Bins with >0 counts | Bins with >2000 counts | High rate bins dominated by noise | Noise dominated (total time) | Noise dominated (detector-on time) | Marked lightcurve |
|---|---|---|---|---|---|---|---|
| A | 6966 | 4815 | 0 | 0 | 0.00% | 0.00% | 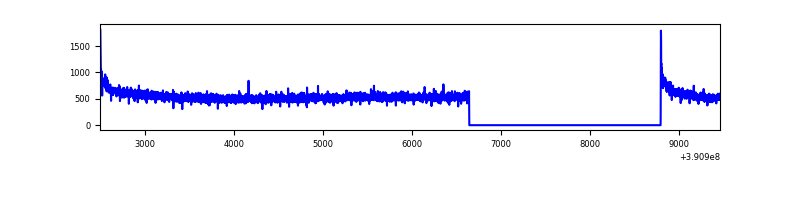 |
| B | 6966 | 4815 | 439 | 439 | 6.30% | 9.12% | 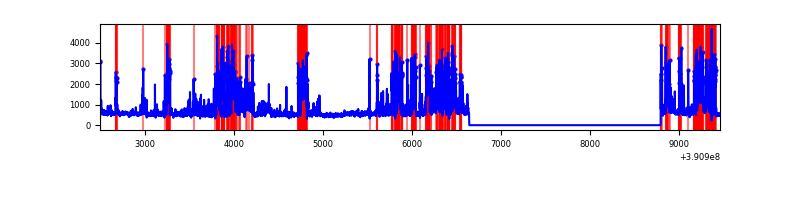 |
| C | 6966 | 4815 | 83 | 83 | 1.19% | 1.72% | 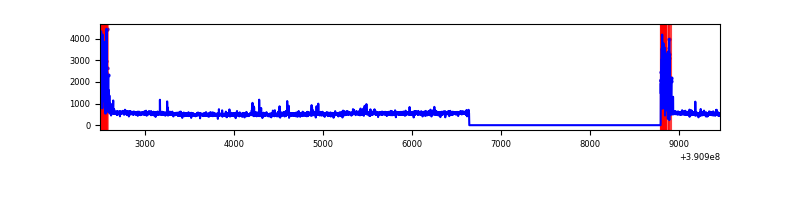 |
| D | 6966 | 4815 | 50 | 50 | 0.72% | 1.04% | 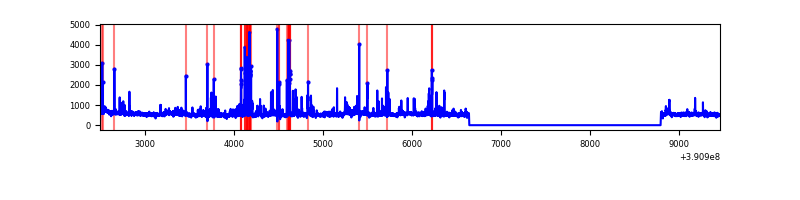 |
Top three noisy pixels from each quadrant. If the there are fewer than three noisy pixels in the level2.evt file, extra rows are filled as -1
| Pixel properties | Quadrant properties | ||||||
|---|---|---|---|---|---|---|---|
| Quadrant | DetID | PixID | Counts | Sigma | Mean | Median | Sigma |
| A | 10 | 83 | 161210 | 1269.07 | 629 | 618 | 126.5 |
| A | 15 | 169 | 15516 | 117.73 | 629 | 618 | 126.5 |
| A | 13 | 254 | 8098 | 59.11 | 629 | 618 | 126.5 |
| B | 5 | 172 | 1578062 | 14374.84 | 582 | 571 | 109.7 |
| B | 0 | 213 | 240388 | 2185.33 | 582 | 571 | 109.7 |
| B | 4 | 171 | 192588 | 1749.75 | 582 | 571 | 109.7 |
| C | 0 | 10 | 341578 | 2545.18 | 588 | 595 | 134.0 |
| C | 15 | 214 | 203038 | 1511.08 | 588 | 595 | 134.0 |
| C | 14 | 128 | 13575 | 96.89 | 588 | 595 | 134.0 |
| D | 8 | 195 | 136094 | 931.17 | 600 | 585 | 145.5 |
| D | 13 | 249 | 133778 | 915.25 | 600 | 585 | 145.5 |
| D | 2 | 250 | 99238 | 677.91 | 600 | 585 | 145.5 |
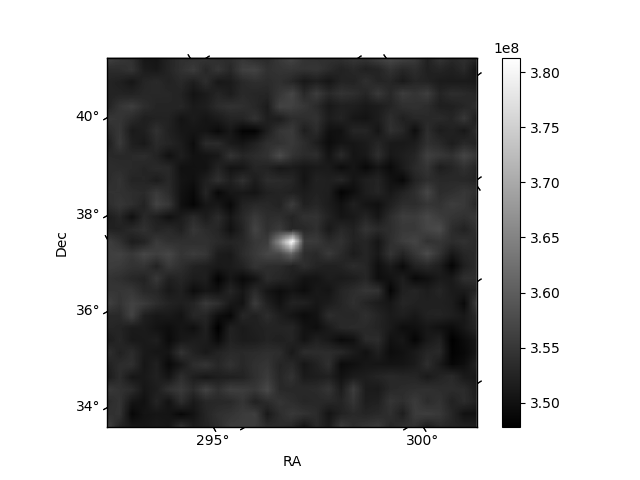
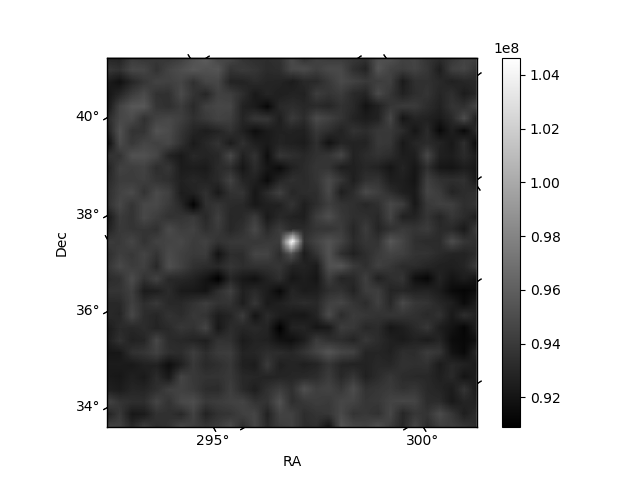
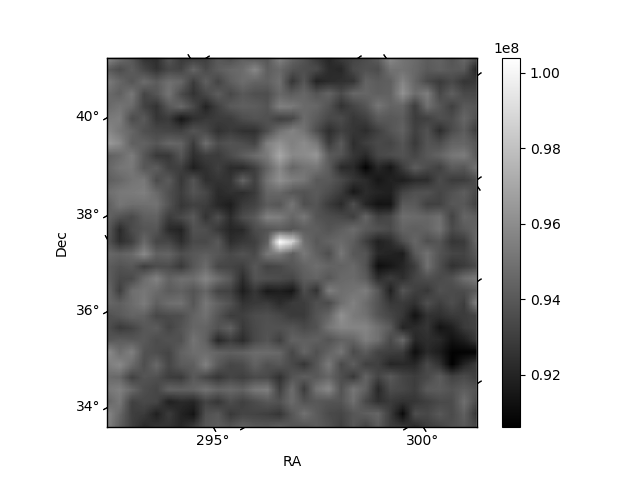
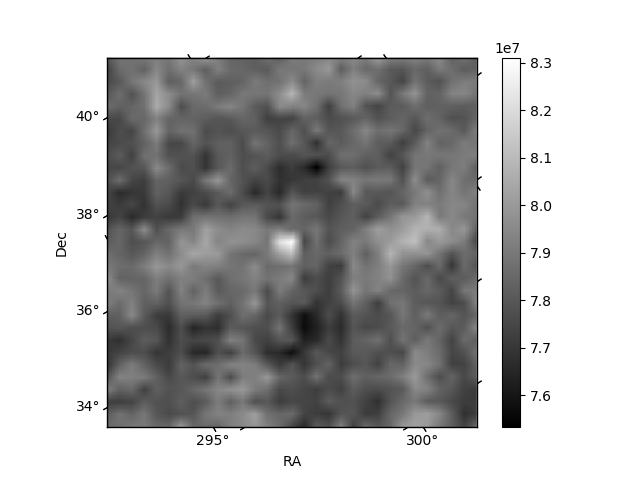
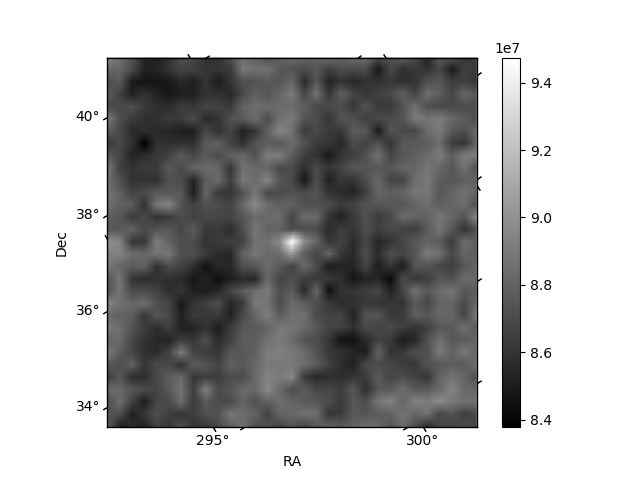
Histogram calculated using DETX and DETY for each event in the final _common_clean file
| Quadrant A | 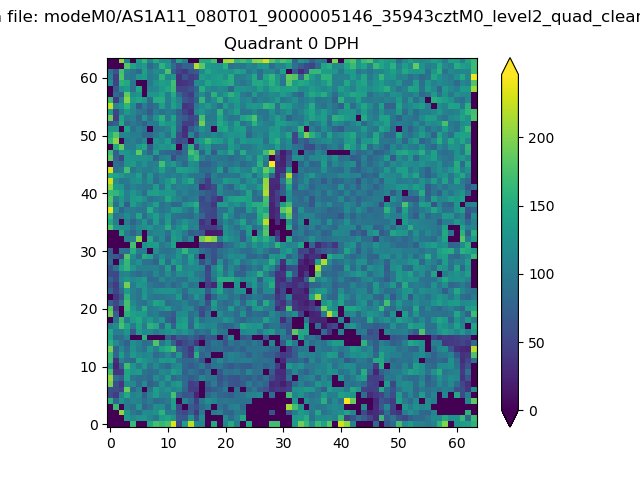 |
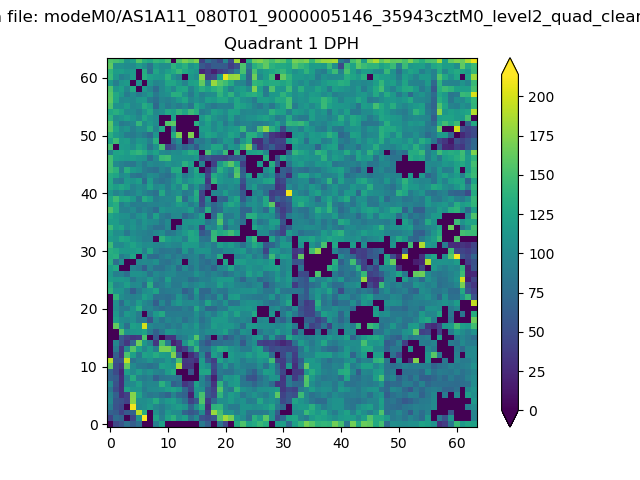 |
Quadrant B |
|---|---|---|---|
| Quadrant D | 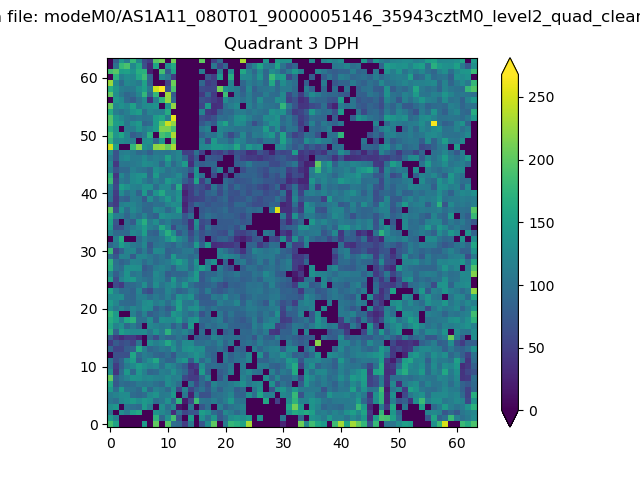 |
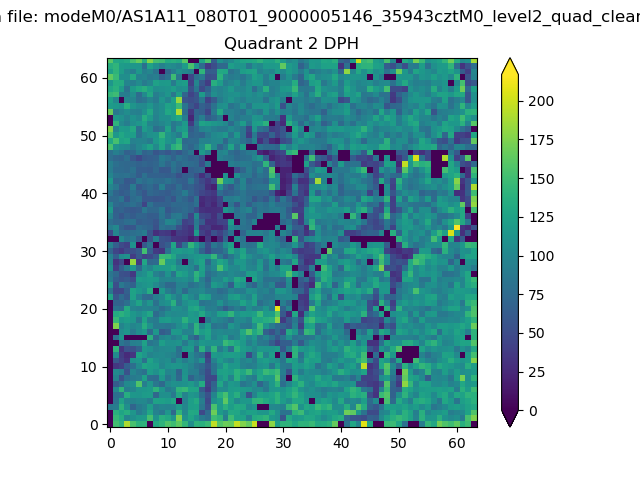 |
Quadrant C |
| Plot type | Count rate plots | Images |
|---|---|---|
| Comparison with Poisson distribution Blue bars denote a histogram of data divided into 1 sec bins. Red curve is a Poisson curve with rate = median count rate of data. |
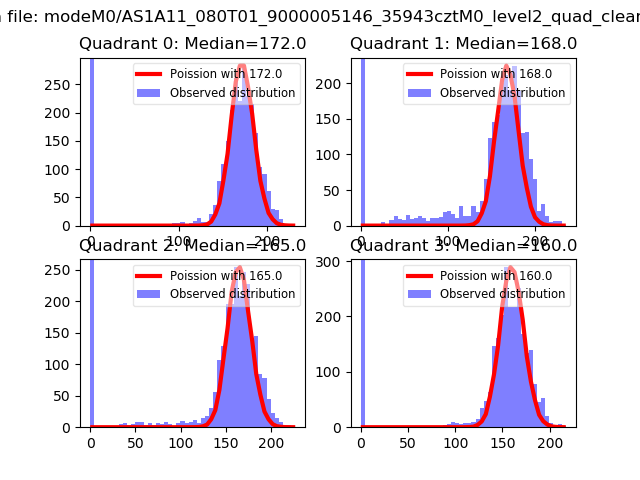 |
 |
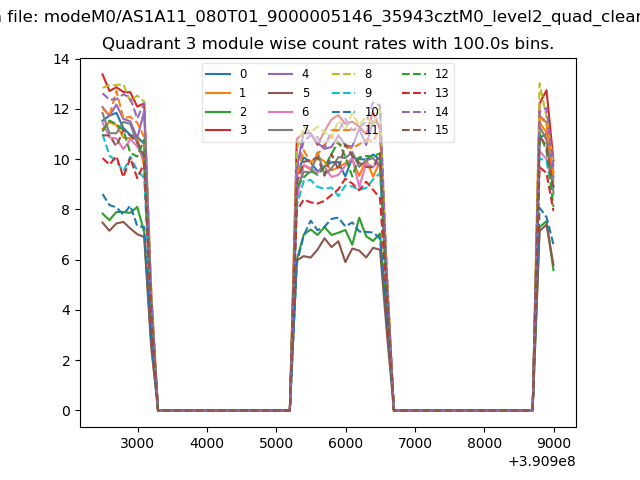
| Quadrant-wise count rates Data is divided into 100 sec bins |
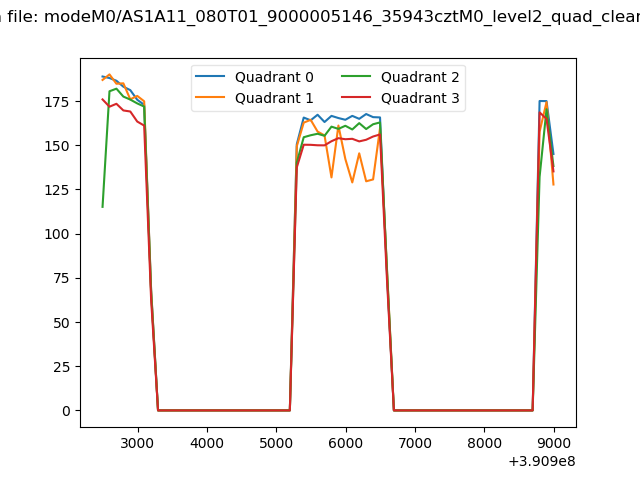 |
|
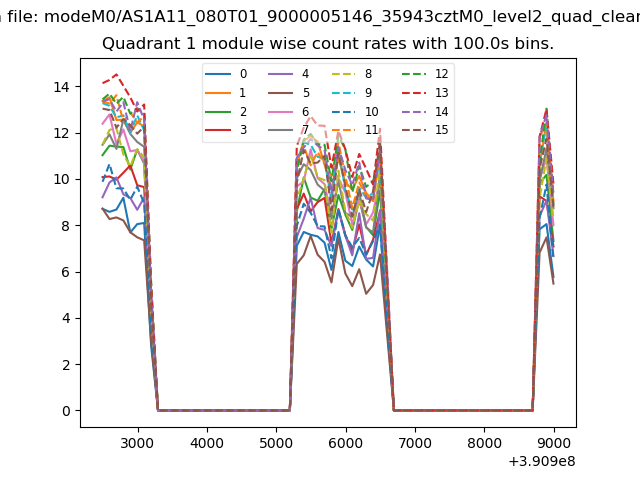
| Module-wise count rates for Quadrant A Data is divided into 100 sec bins |
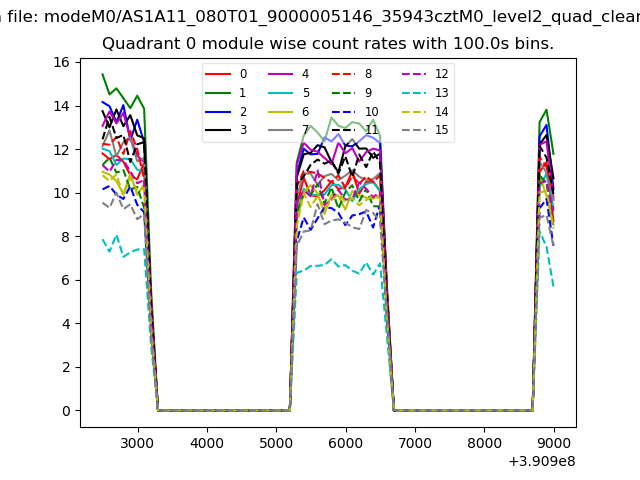 |
 |
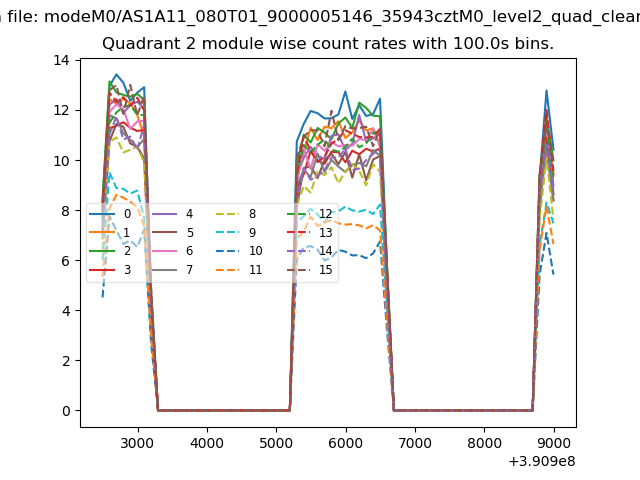
| Module-wise count rates for Quadrant B Data is divided into 100 sec bins |
 |
 |
| Module-wise count rates for Quadrant C Data is divided into 100 sec bins |
 |
 |
| Module-wise count rates for Quadrant D Data is divided into 100 sec bins |
 |
 |
| Parameter | Plot |
|---|---|
| CZT HV Monitor | 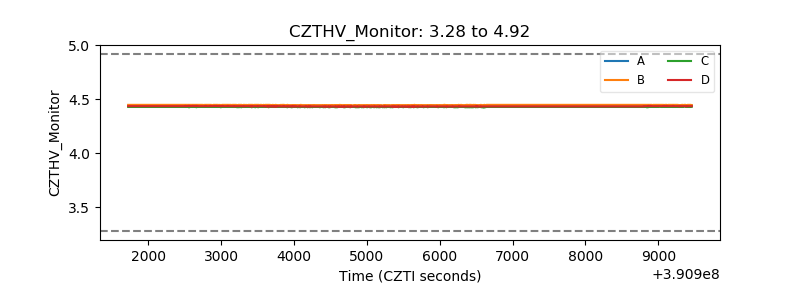 |
| D_VDD | 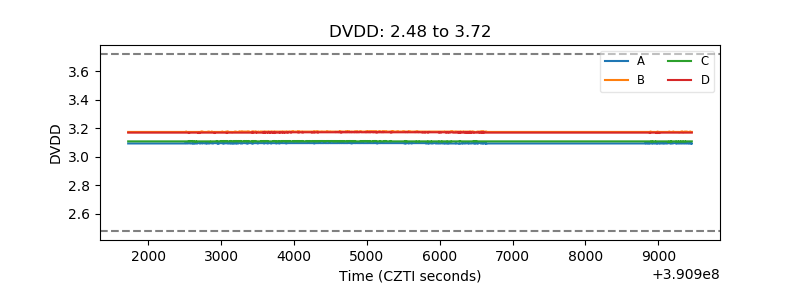 |
| Temperature 1 | 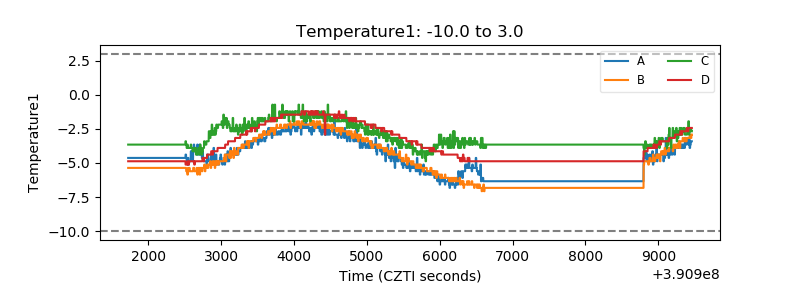 |
| Veto HV Monitor | 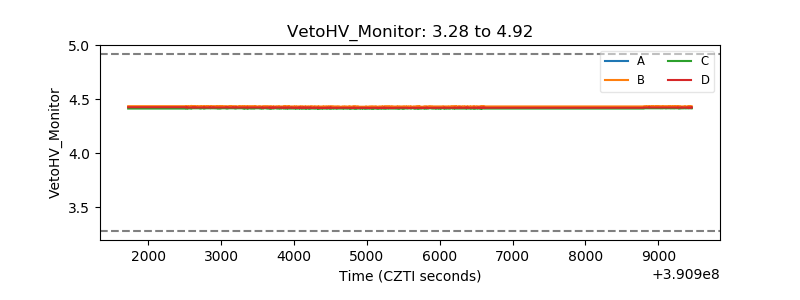 |
| Veto LLD | 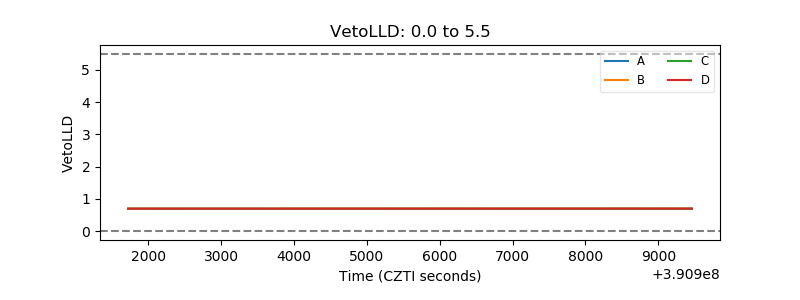 |
| Alpha Counter | 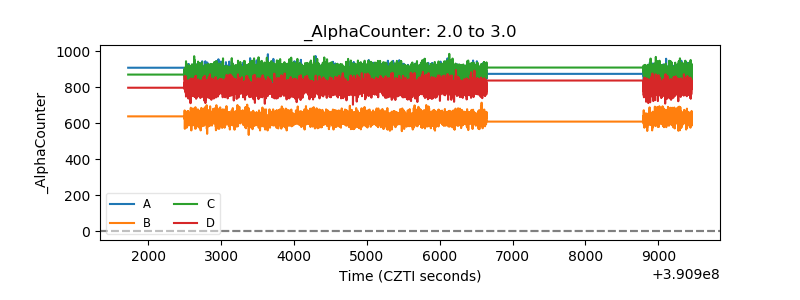 |
| _CPM_Rate | 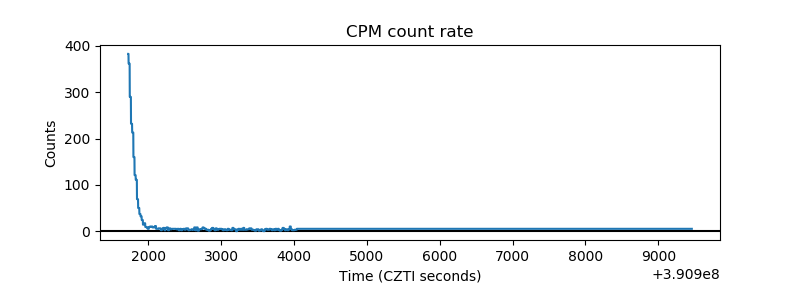 |
| CZT Counter | 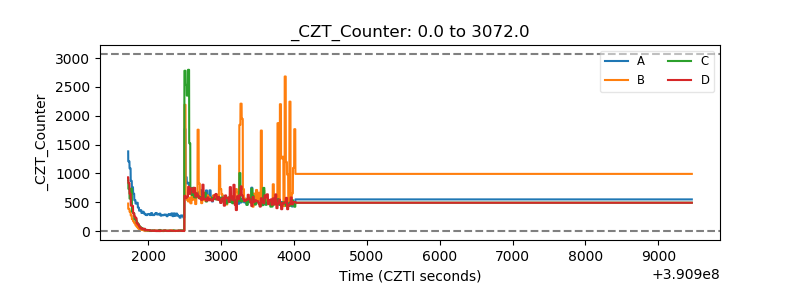 |
| +2.5 Volts monitor | 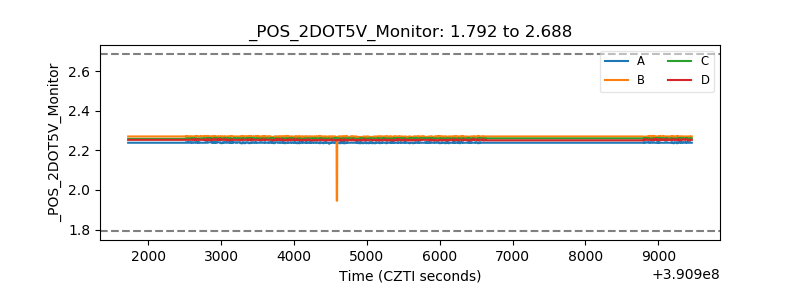 |
| +5 Volts monitor | 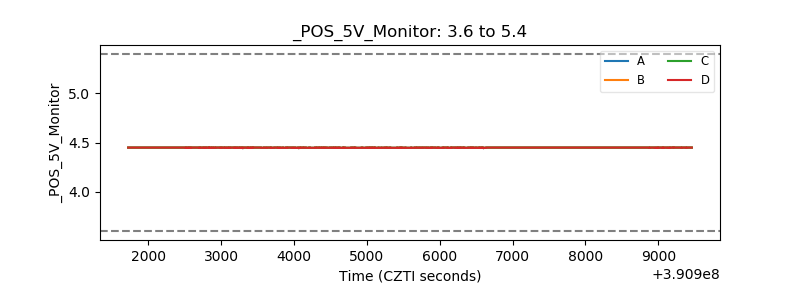 |
| _ROLL_ROT | 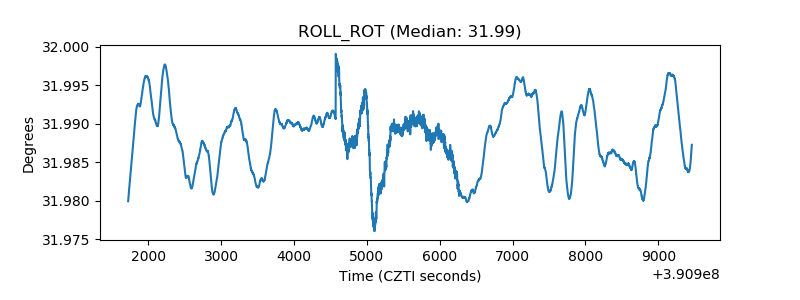 |
| _Roll_DEC | 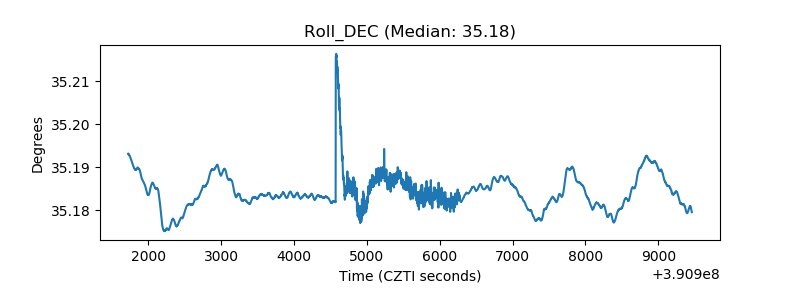 |
| _Roll_RA | 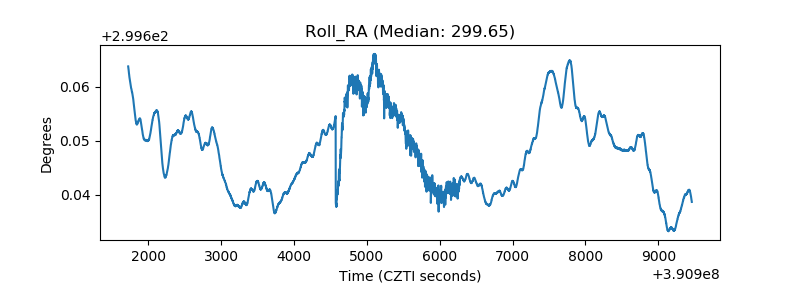 |
| Veto Counter | 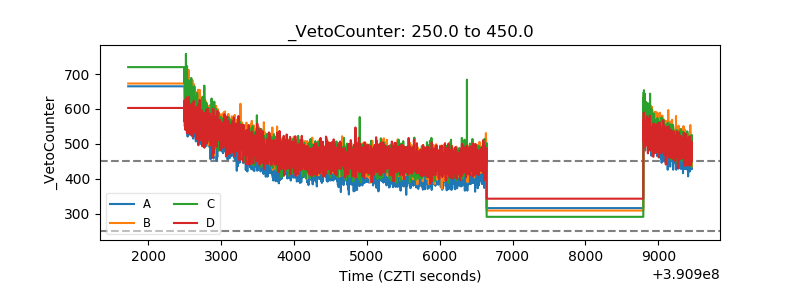 |