| Param | Original file | Final file |
|---|---|---|
| Filename | modeM0/AS1A11_080T01_9000005146_35941cztM0_level2.evt | modeM0/AS1A11_080T01_9000005146_35941cztM0_level2_quad_clean.evt |
| Size (bytes) | 432,702,720 | 80,547,840 |
| Size | 412.7 MB | 76.8 MB |
| Events in quadrant A | 2,841,637 | 533,202 |
| Events in quadrant B | 3,496,294 | 532,837 |
| Events in quadrant C | 3,017,806 | 514,228 |
| Events in quadrant D | 3,393,508 | 492,549 |
| Mode M9 | |||
|---|---|---|---|
| Quadrant | BADHDUFLAG | Total packets | Discarded packets |
| A | 0 | 30 | 0 |
| B | 0 | 31 | 0 |
| C | 0 | 31 | 0 |
| D | 0 | 31 | 0 |
| Mode SS | |||
|---|---|---|---|
| Quadrant | BADHDUFLAG | Total packets | Discarded packets |
| A | 0 | 106 | 0 |
| B | 0 | 106 | 0 |
| C | 0 | 105 | 0 |
| D | 0 | 105 | 1 |
| Mode M0 | |||
|---|---|---|---|
| Quadrant | BADHDUFLAG | Total packets | Discarded packets |
| A | 0 | 11570 | 113 |
| B | 0 | 13748 | 79 |
| C | 0 | 12103 | 131 |
| D | 0 | 13497 | 108 |
| Quadrant | Total seconds | Saturated seconds | Saturation percentage |
|---|---|---|---|
| A | 5231 | 12 | 0.229402% |
| B | 5243 | 196 | 3.738318% |
| C | 5232 | 80 | 1.529052% |
| D | 5239 | 117 | 2.233251% |
Noise dominated data is calculated using 1-second bins in cleaned event files. If a bin has >2000 counts, and if more than 50% of those come from <1% of pixels, then it is considered to be noise-dominated and hence unusable.
| Quadrant | # 1 sec bins | Bins with >0 counts | Bins with >2000 counts | High rate bins dominated by noise | Noise dominated (total time) | Noise dominated (detector-on time) | Marked lightcurve |
|---|---|---|---|---|---|---|---|
| A | 7264 | 5264 | 7 | 7 | 0.10% | 0.13% | 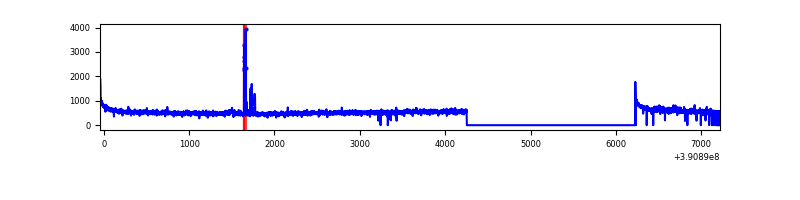 |
| B | 7262 | 5274 | 122 | 122 | 1.68% | 2.31% | 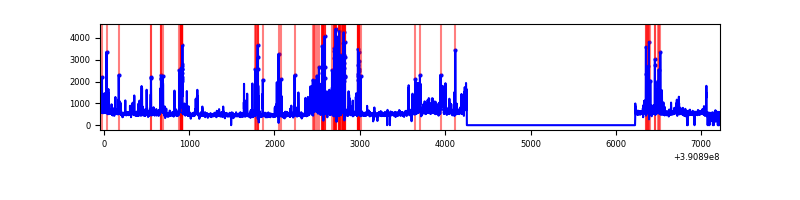 |
| C | 7264 | 5268 | 48 | 48 | 0.66% | 0.91% | 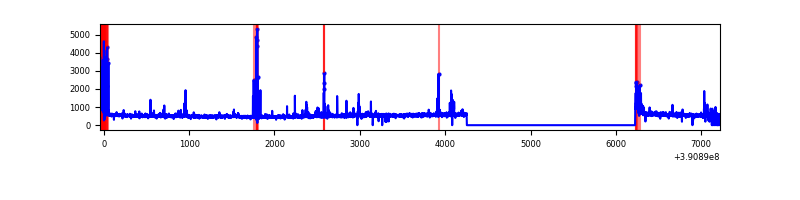 |
| D | 7263 | 5271 | 88 | 88 | 1.21% | 1.67% | 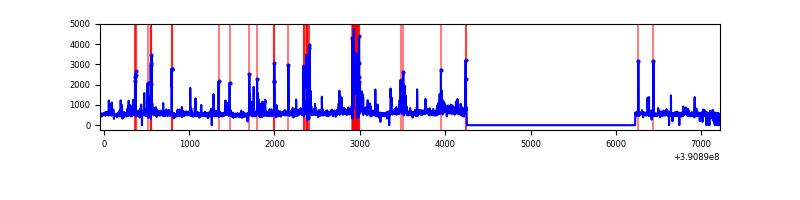 |
Top three noisy pixels from each quadrant. If the there are fewer than three noisy pixels in the level2.evt file, extra rows are filled as -1
| Pixel properties | Quadrant properties | ||||||
|---|---|---|---|---|---|---|---|
| Quadrant | DetID | PixID | Counts | Sigma | Mean | Median | Sigma |
| A | 10 | 83 | 160735 | 1202.94 | 664 | 656 | 133.1 |
| A | 15 | 169 | 55115 | 409.24 | 664 | 656 | 133.1 |
| A | 9 | 143 | 45250 | 335.11 | 664 | 656 | 133.1 |
| B | 5 | 172 | 440780 | 3545.94 | 647 | 633 | 124.1 |
| B | 4 | 171 | 258770 | 2079.62 | 647 | 633 | 124.1 |
| B | 0 | 213 | 150756 | 1209.43 | 647 | 633 | 124.1 |
| C | 15 | 214 | 219716 | 1509.76 | 627 | 634 | 145.1 |
| C | 0 | 10 | 186319 | 1279.61 | 627 | 634 | 145.1 |
| C | 0 | 207 | 153662 | 1054.56 | 627 | 634 | 145.1 |
| D | 8 | 195 | 411664 | 2716.17 | 627 | 611 | 151.3 |
| D | 13 | 249 | 210158 | 1384.65 | 627 | 611 | 151.3 |
| D | 7 | 223 | 141815 | 933.05 | 627 | 611 | 151.3 |
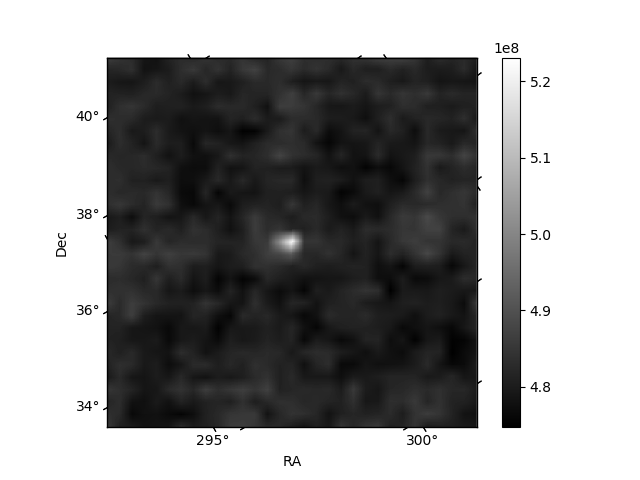
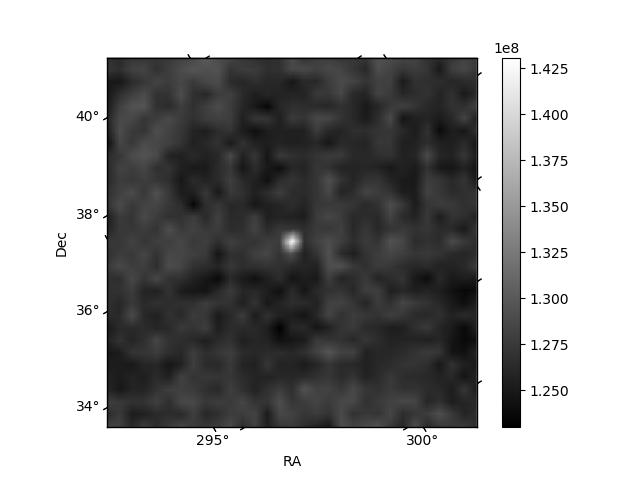
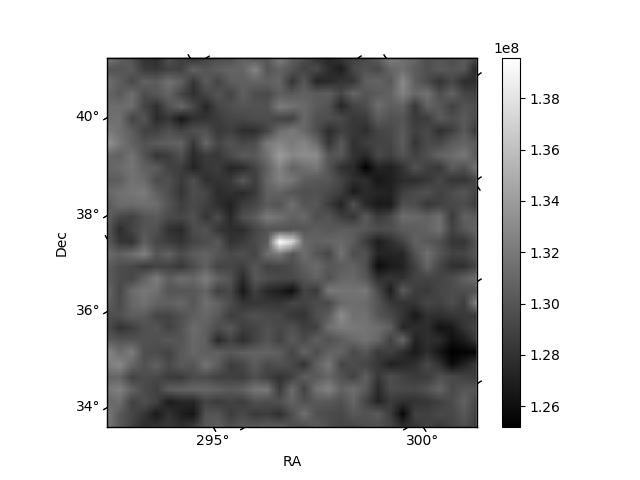
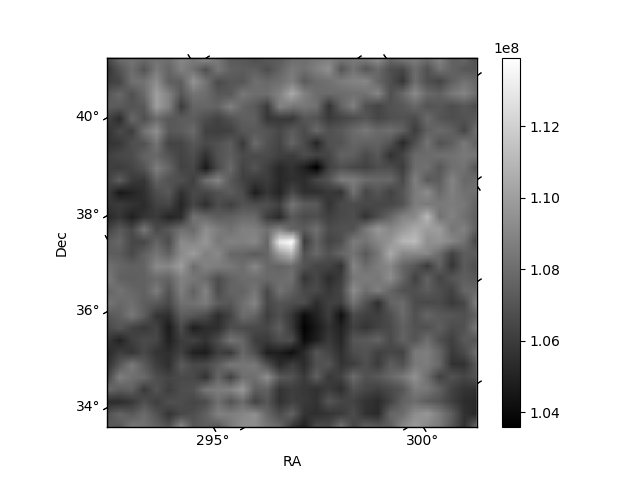
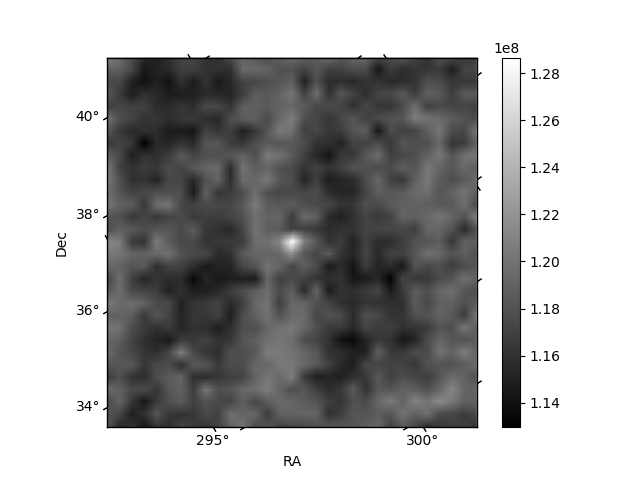
Histogram calculated using DETX and DETY for each event in the final _common_clean file
| Quadrant A | 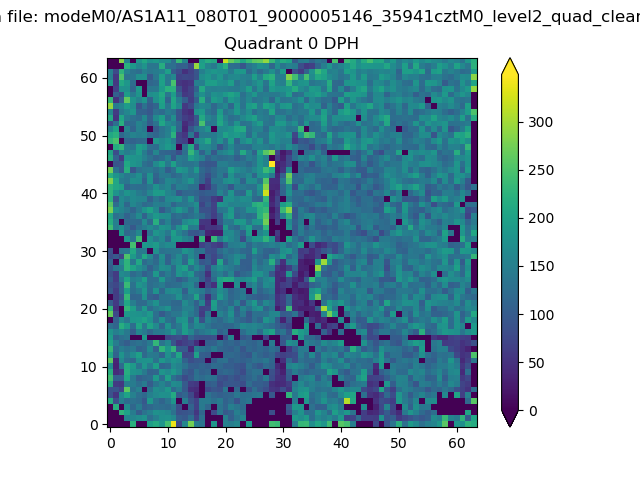 |
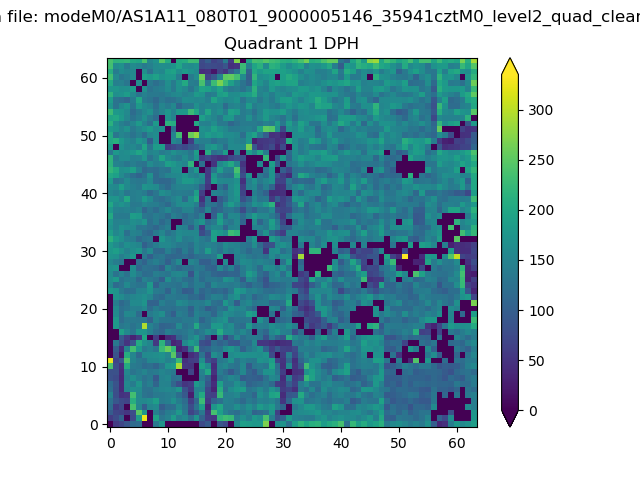 |
Quadrant B |
|---|---|---|---|
| Quadrant D | 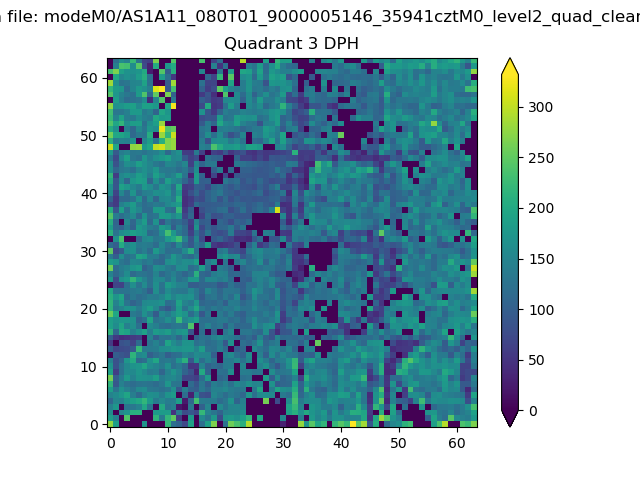 |
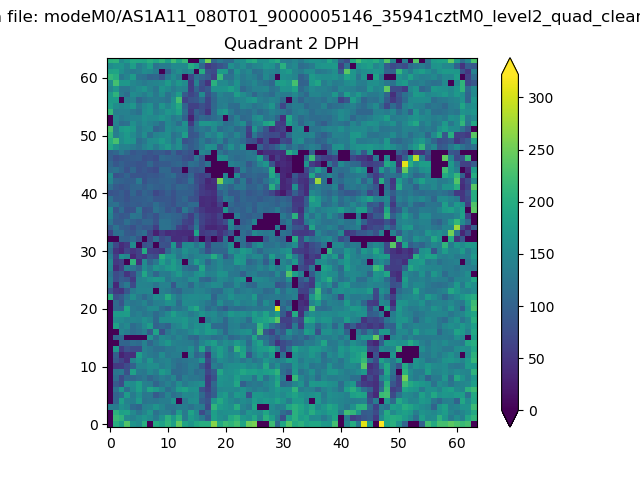 |
Quadrant C |
| Plot type | Count rate plots | Images |
|---|---|---|
| Comparison with Poisson distribution Blue bars denote a histogram of data divided into 1 sec bins. Red curve is a Poisson curve with rate = median count rate of data. |
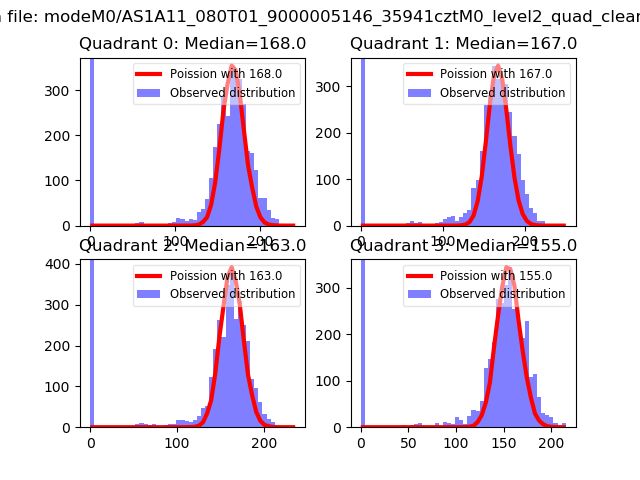 |
 |
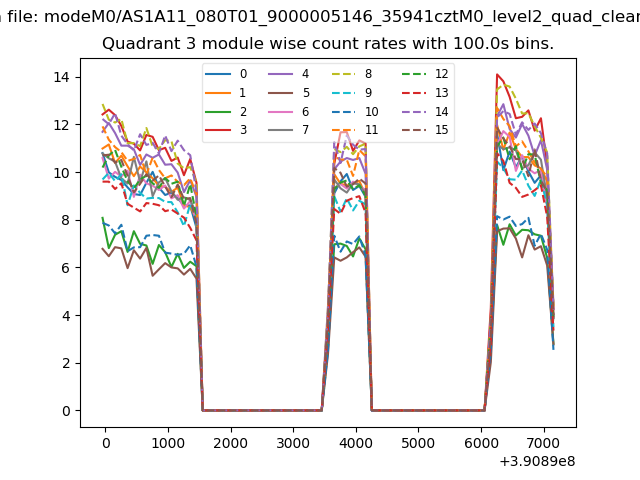
| Quadrant-wise count rates Data is divided into 100 sec bins |
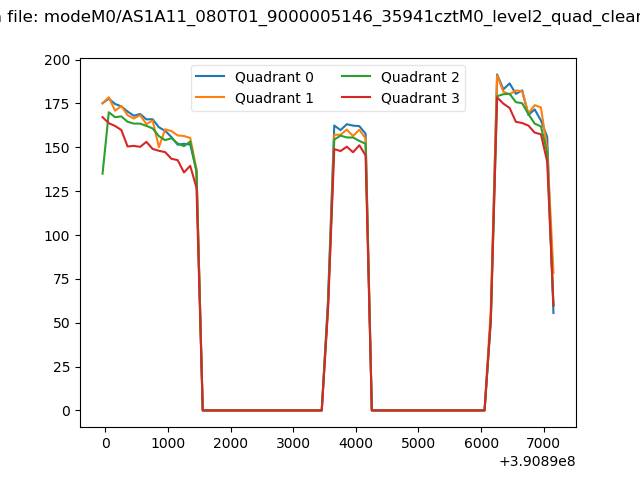 |
|
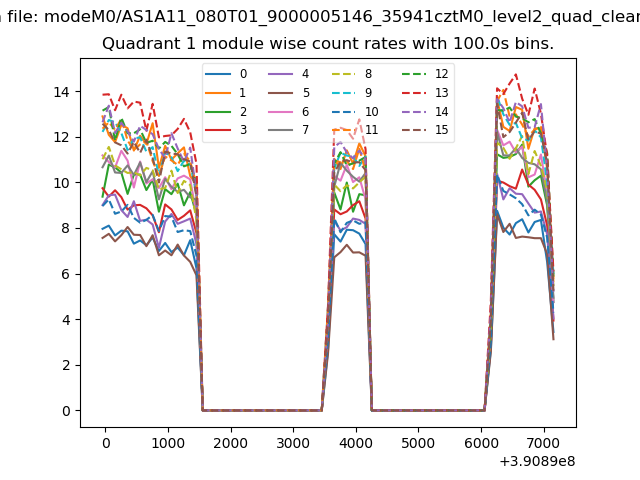
| Module-wise count rates for Quadrant A Data is divided into 100 sec bins |
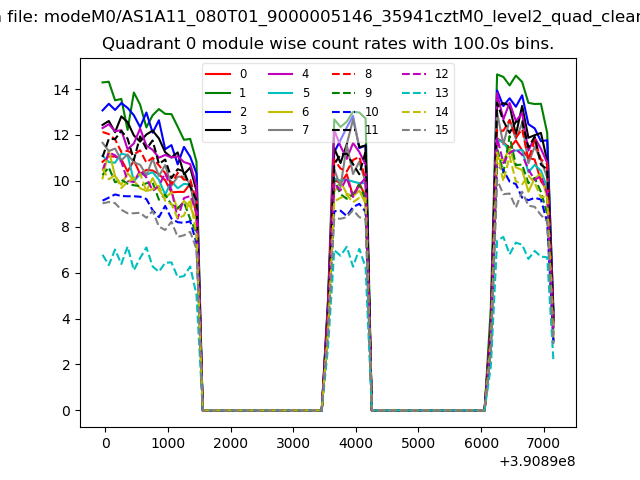 |
 |
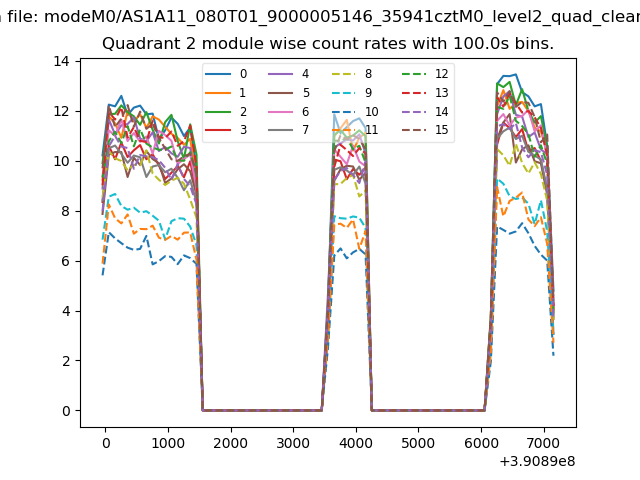
| Module-wise count rates for Quadrant B Data is divided into 100 sec bins |
 |
 |
| Module-wise count rates for Quadrant C Data is divided into 100 sec bins |
 |
 |
| Module-wise count rates for Quadrant D Data is divided into 100 sec bins |
 |
 |
| Parameter | Plot |
|---|---|
| CZT HV Monitor | 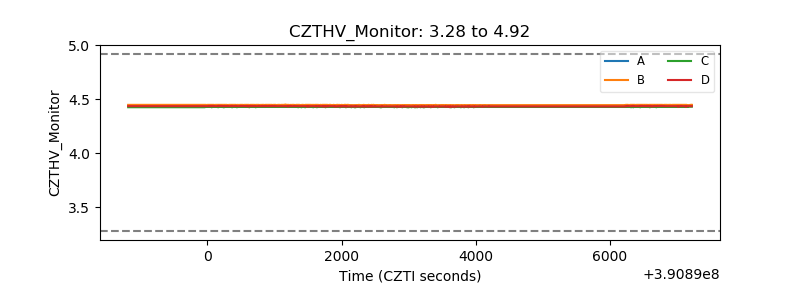 |
| D_VDD | 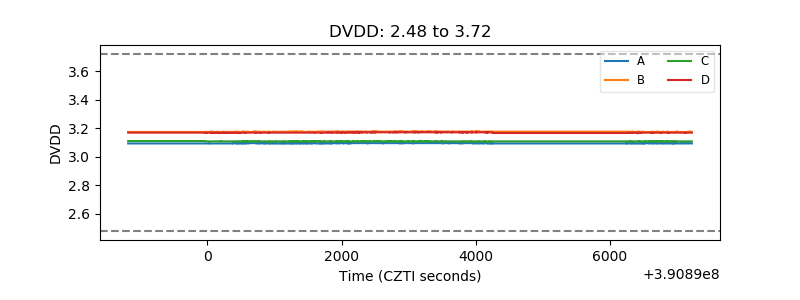 |
| Temperature 1 | 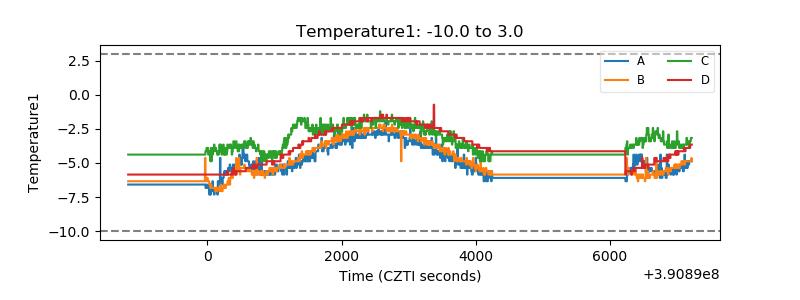 |
| Veto HV Monitor | 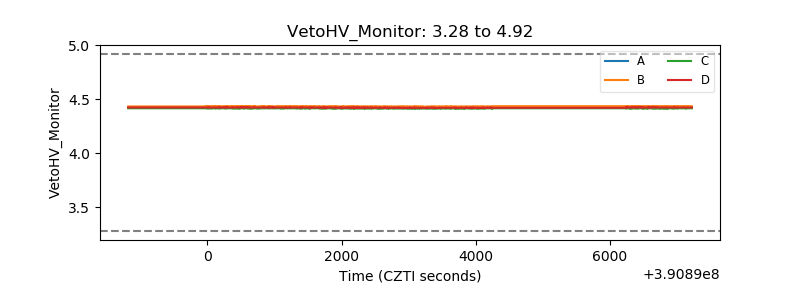 |
| Veto LLD | 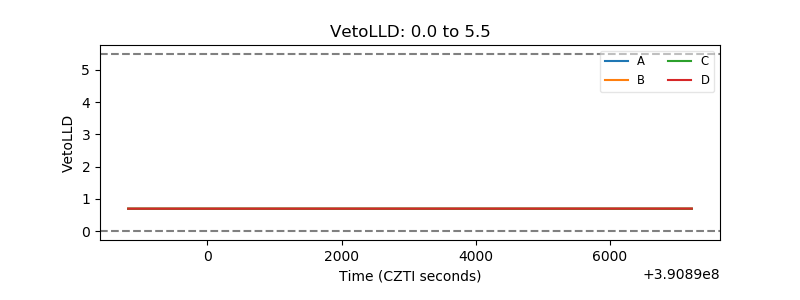 |
| Alpha Counter | 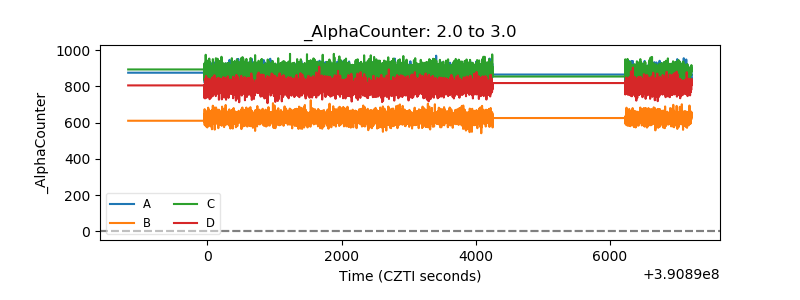 |
| _CPM_Rate | 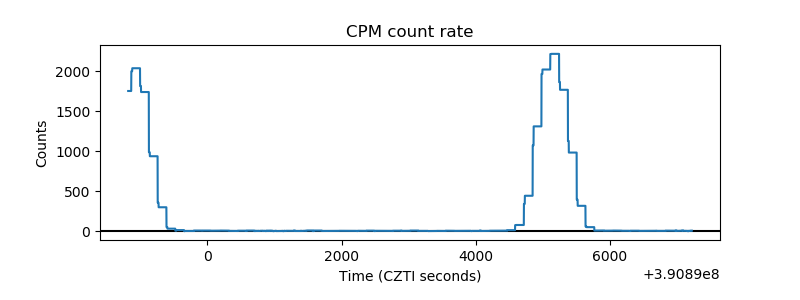 |
| CZT Counter | 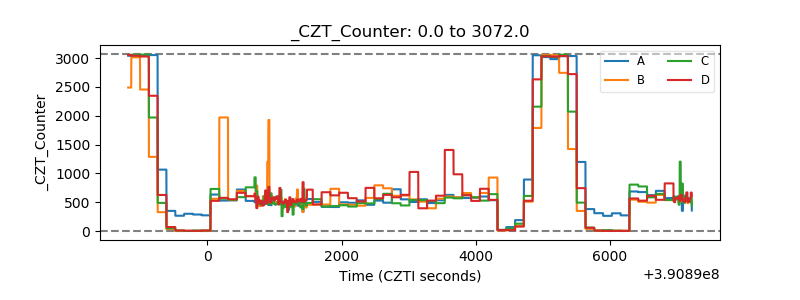 |
| +2.5 Volts monitor | 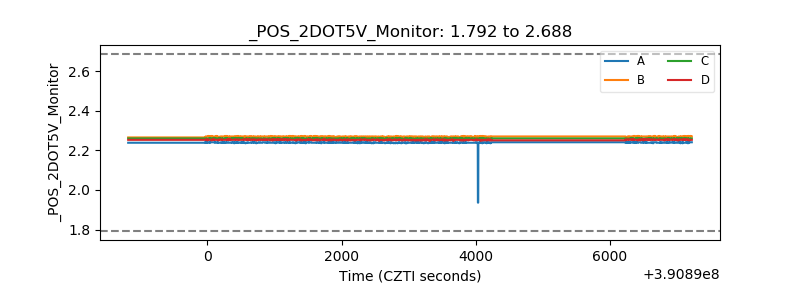 |
| +5 Volts monitor | 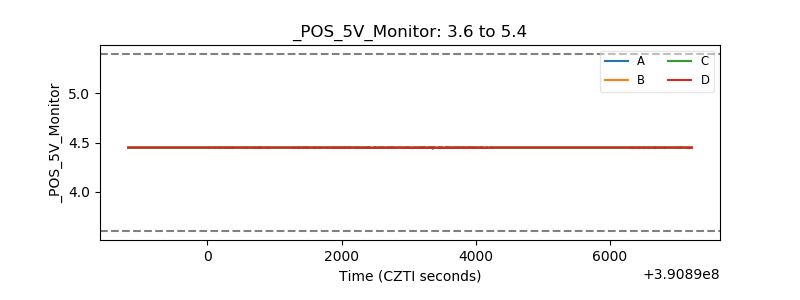 |
| _ROLL_ROT | 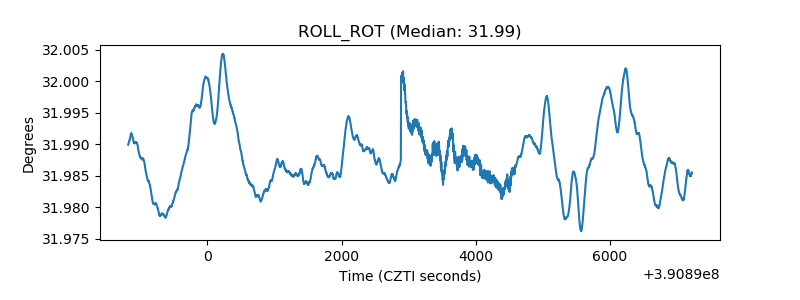 |
| _Roll_DEC | 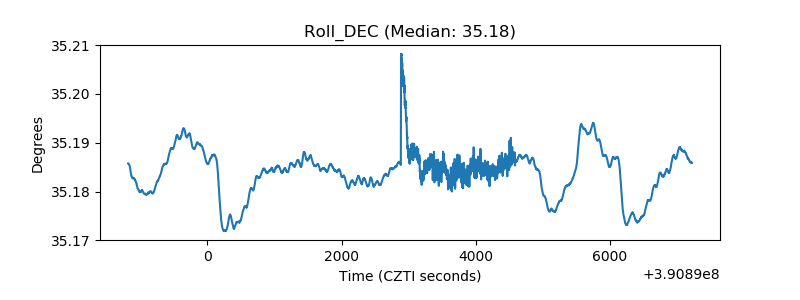 |
| _Roll_RA | 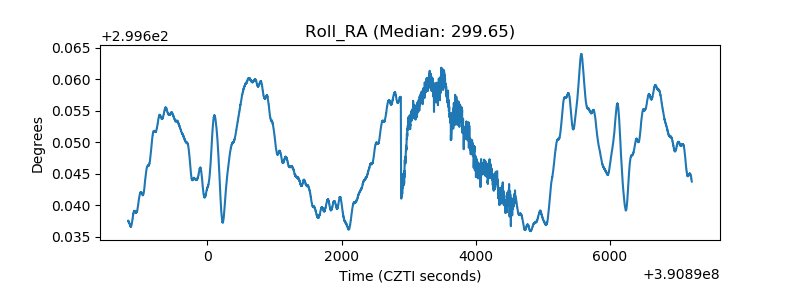 |
| Veto Counter | 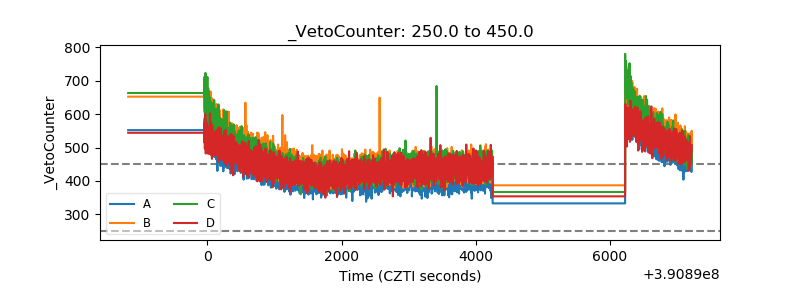 |