| Param | Original file | Final file |
|---|---|---|
| Filename | modeM0/AS1A11_080T01_9000005146_35940cztM0_level2.evt | modeM0/AS1A11_080T01_9000005146_35940cztM0_level2_quad_clean.evt |
| Size (bytes) | 454,518,720 | 78,137,280 |
| Size | 433.5 MB | 74.5 MB |
| Events in quadrant A | 2,696,830 | 517,743 |
| Events in quadrant B | 4,372,612 | 490,587 |
| Events in quadrant C | 3,192,940 | 499,466 |
| Events in quadrant D | 3,138,009 | 482,157 |
| Mode M9 | |||
|---|---|---|---|
| Quadrant | BADHDUFLAG | Total packets | Discarded packets |
| A | 0 | 31 | 0 |
| B | 0 | 31 | 0 |
| C | 0 | 31 | 0 |
| D | 0 | 32 | 0 |
| Mode SS | |||
|---|---|---|---|
| Quadrant | BADHDUFLAG | Total packets | Discarded packets |
| A | 0 | 110 | 0 |
| B | 0 | 110 | 0 |
| C | 0 | 110 | 0 |
| D | 0 | 110 | 0 |
| Mode M0 | |||
|---|---|---|---|
| Quadrant | BADHDUFLAG | Total packets | Discarded packets |
| A | 0 | 11212 | 3 |
| B | 0 | 16395 | 2 |
| C | 0 | 12657 | 2 |
| D | 0 | 12745 | 2 |
| Quadrant | Total seconds | Saturated seconds | Saturation percentage |
|---|---|---|---|
| A | 5368 | 13 | 0.242176% |
| B | 5368 | 567 | 10.562593% |
| C | 5368 | 129 | 2.403130% |
| D | 5368 | 61 | 1.136364% |
Noise dominated data is calculated using 1-second bins in cleaned event files. If a bin has >2000 counts, and if more than 50% of those come from <1% of pixels, then it is considered to be noise-dominated and hence unusable.
| Quadrant | # 1 sec bins | Bins with >0 counts | Bins with >2000 counts | High rate bins dominated by noise | Noise dominated (total time) | Noise dominated (detector-on time) | Marked lightcurve |
|---|---|---|---|---|---|---|---|
| A | 7221 | 5369 | 1 | 1 | 0.01% | 0.02% | 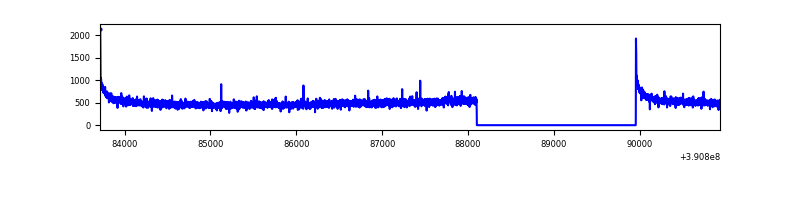 |
| B | 7221 | 5369 | 422 | 422 | 5.84% | 7.86% | 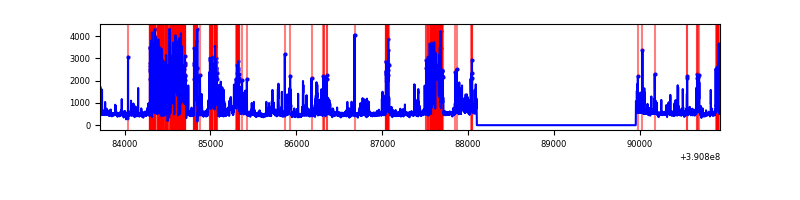 |
| C | 7221 | 5369 | 101 | 101 | 1.40% | 1.88% | 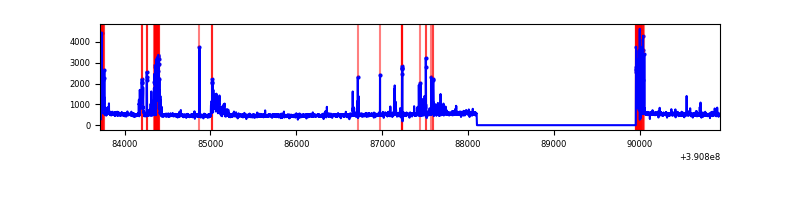 |
| D | 7221 | 5369 | 38 | 38 | 0.53% | 0.71% | 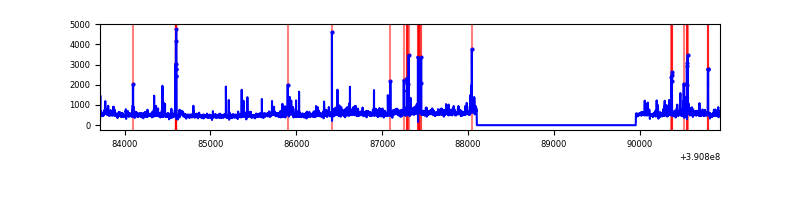 |
Top three noisy pixels from each quadrant. If the there are fewer than three noisy pixels in the level2.evt file, extra rows are filled as -1
| Pixel properties | Quadrant properties | ||||||
|---|---|---|---|---|---|---|---|
| Quadrant | DetID | PixID | Counts | Sigma | Mean | Median | Sigma |
| A | 10 | 83 | 164132 | 1235.51 | 650 | 640 | 132.3 |
| A | 13 | 6 | 12437 | 89.15 | 650 | 640 | 132.3 |
| A | 13 | 254 | 8410 | 58.72 | 650 | 640 | 132.3 |
| B | 5 | 172 | 1387412 | 11703.56 | 613 | 600 | 118.5 |
| B | 4 | 171 | 429619 | 3620.57 | 613 | 600 | 118.5 |
| B | 0 | 213 | 73438 | 614.69 | 613 | 600 | 118.5 |
| C | 0 | 207 | 280758 | 1944.61 | 616 | 623 | 144.1 |
| C | 15 | 214 | 224347 | 1553.02 | 616 | 623 | 144.1 |
| C | 0 | 10 | 197631 | 1367.57 | 616 | 623 | 144.1 |
| D | 8 | 195 | 337318 | 2242.25 | 619 | 603 | 150.2 |
| D | 13 | 249 | 206019 | 1367.9 | 619 | 603 | 150.2 |
| D | 1 | 52 | 116413 | 771.2 | 619 | 603 | 150.2 |
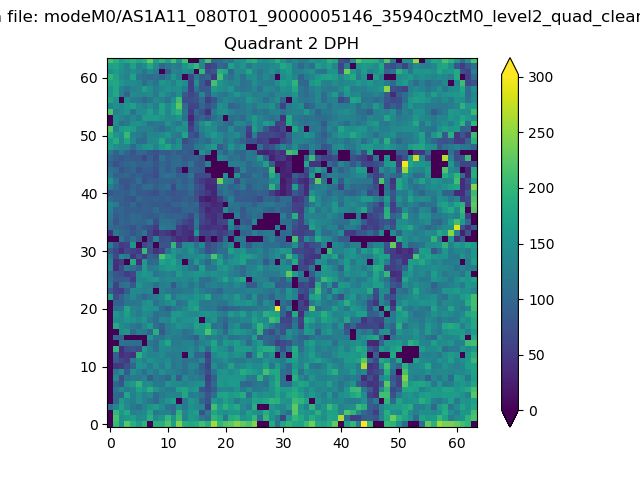
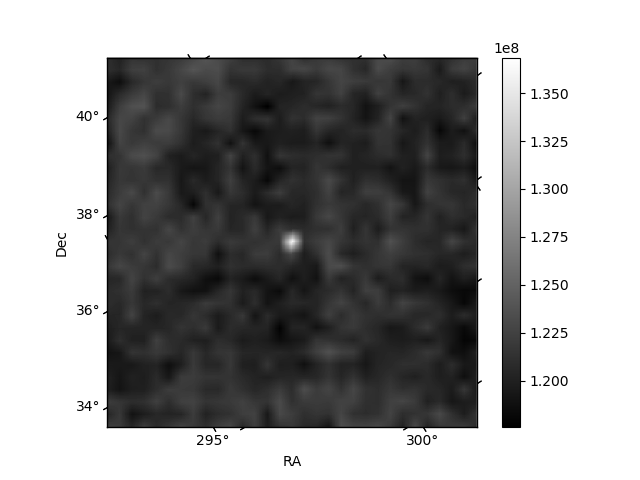
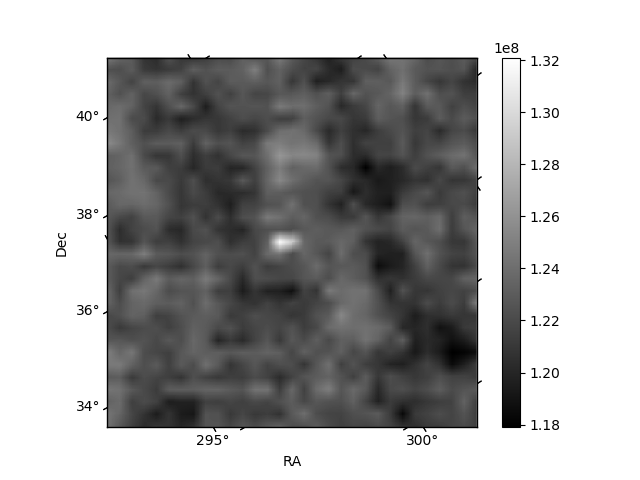
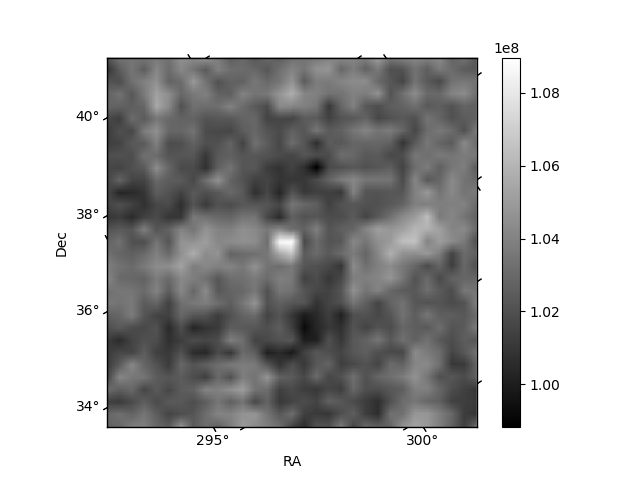
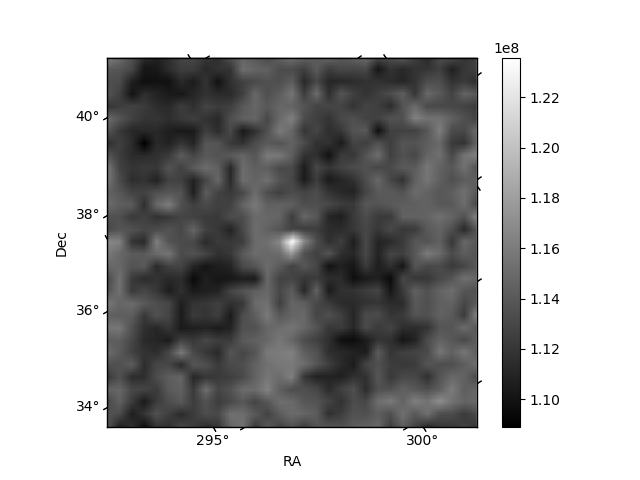
Histogram calculated using DETX and DETY for each event in the final _common_clean file
| Quadrant A | 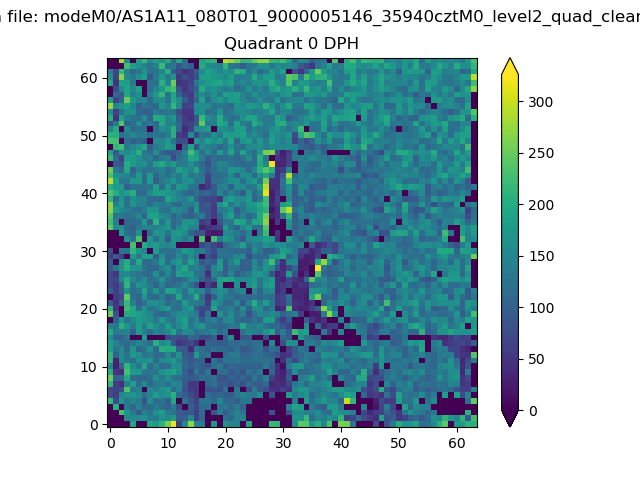 |
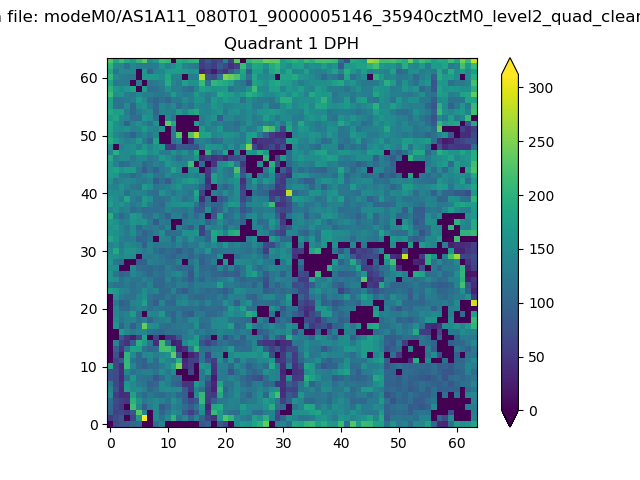 |
Quadrant B |
|---|---|---|---|
| Quadrant D | 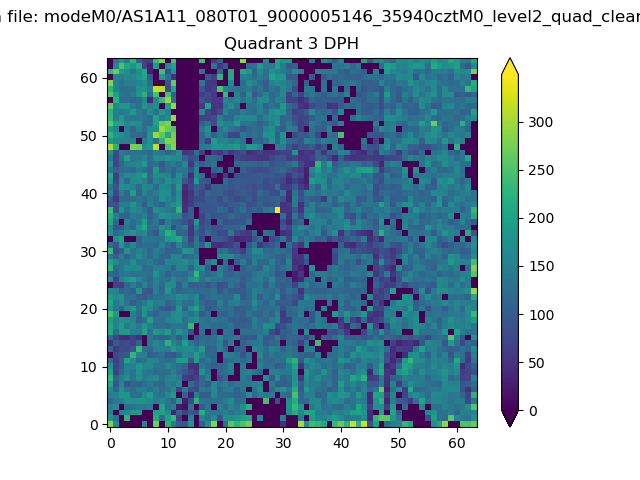 |
 |
Quadrant C |
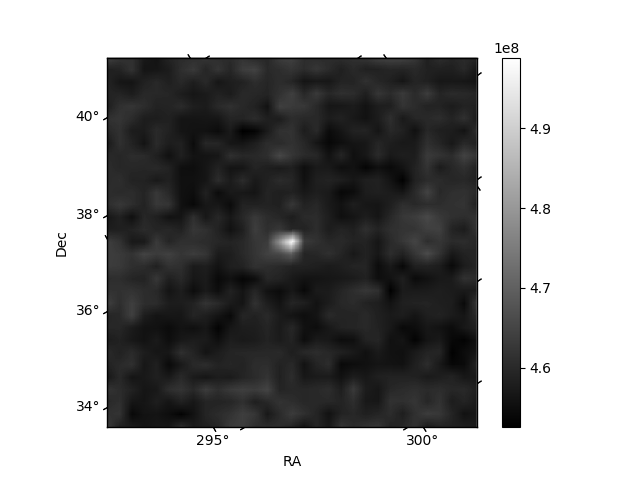
| Plot type | Count rate plots | Images |
|---|---|---|
| Comparison with Poisson distribution Blue bars denote a histogram of data divided into 1 sec bins. Red curve is a Poisson curve with rate = median count rate of data. |
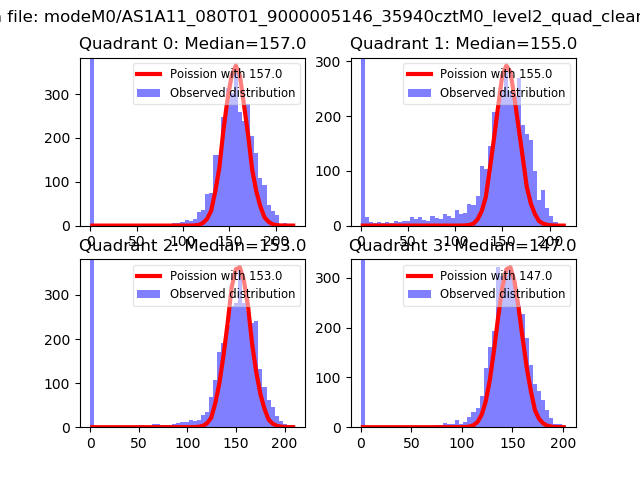 |
 |
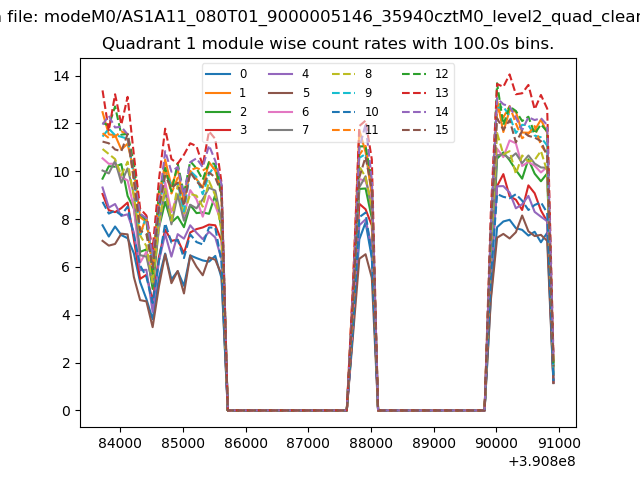
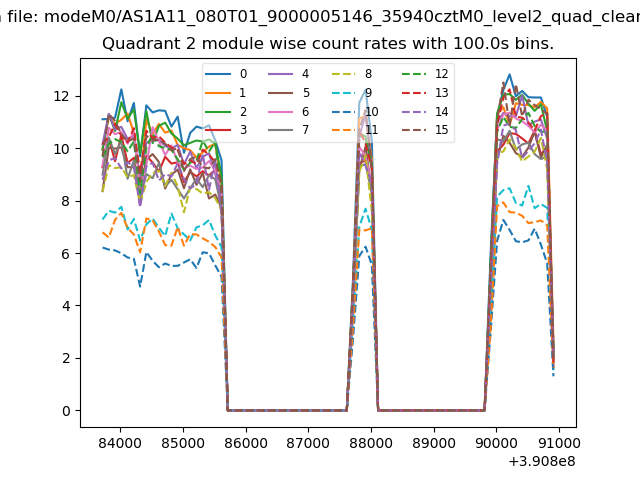
| Quadrant-wise count rates Data is divided into 100 sec bins |
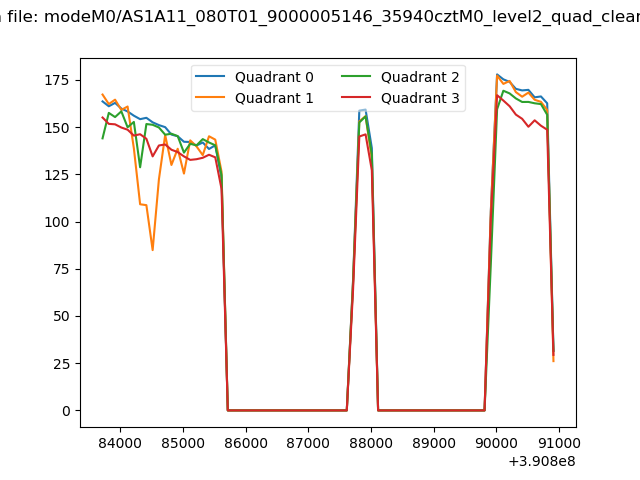 |
|
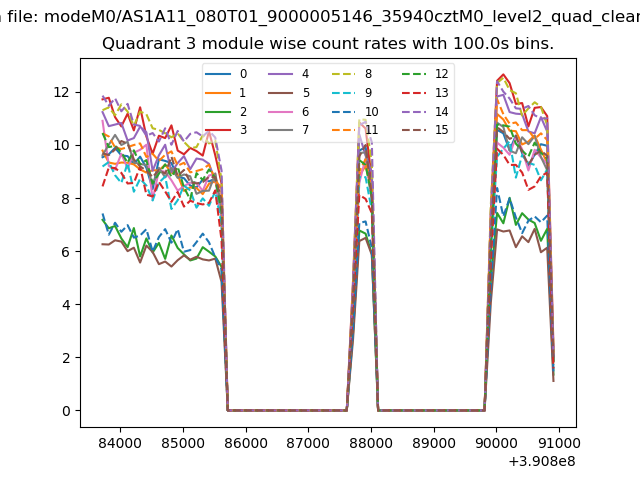
| Module-wise count rates for Quadrant A Data is divided into 100 sec bins |
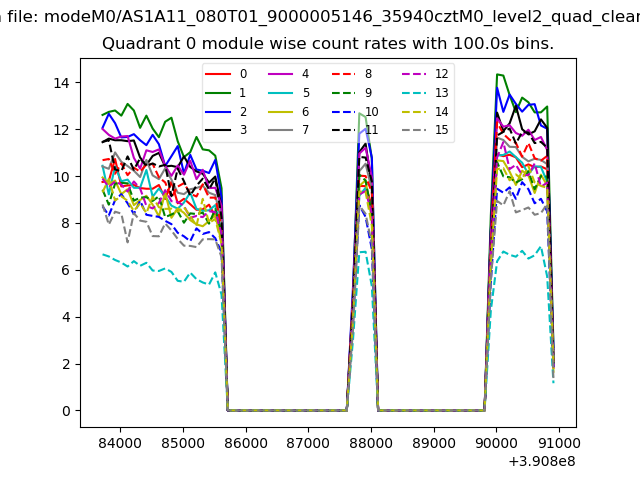 |
 |
| Module-wise count rates for Quadrant B Data is divided into 100 sec bins |
 |
 |
| Module-wise count rates for Quadrant C Data is divided into 100 sec bins |
 |
 |
| Module-wise count rates for Quadrant D Data is divided into 100 sec bins |
 |
 |
| Parameter | Plot |
|---|---|
| CZT HV Monitor | 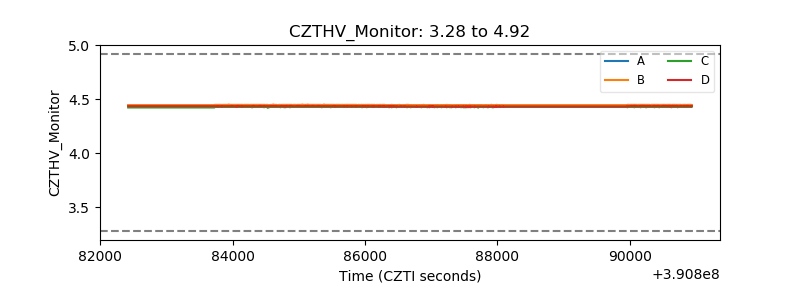 |
| D_VDD | 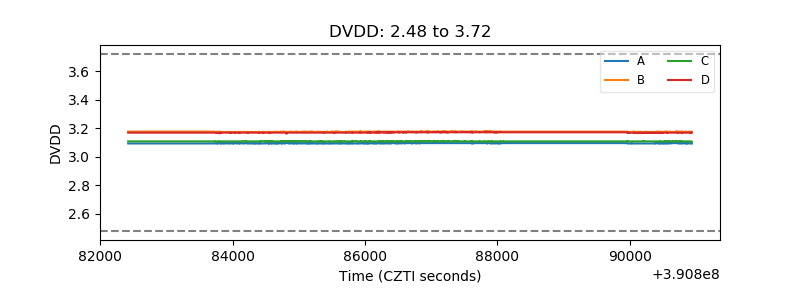 |
| Temperature 1 | 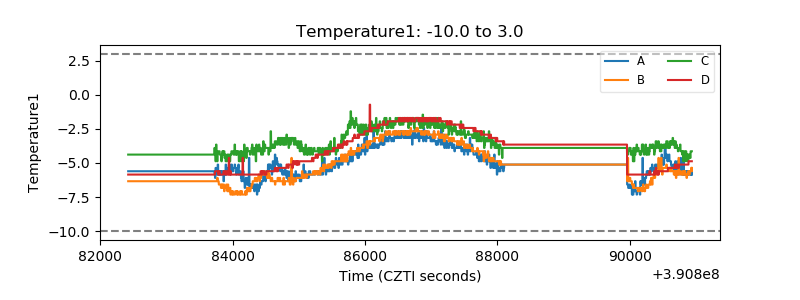 |
| Veto HV Monitor | 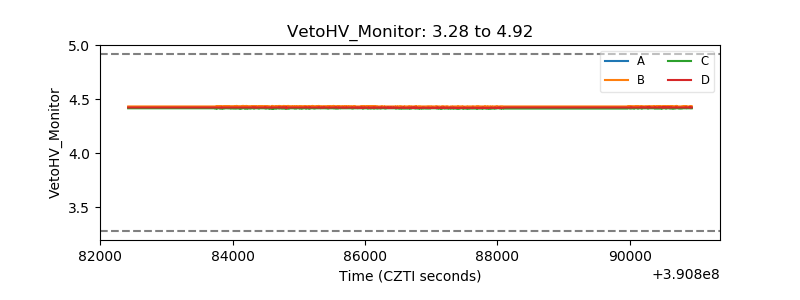 |
| Veto LLD | 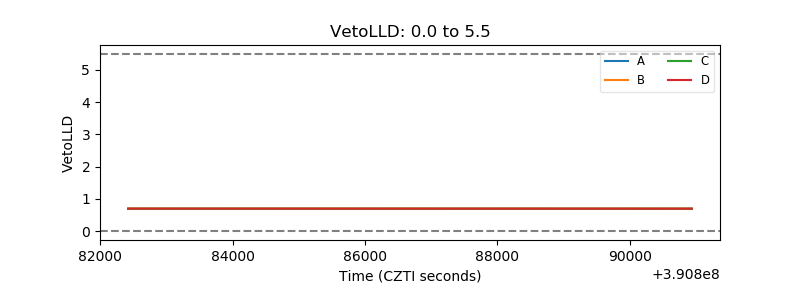 |
| Alpha Counter | 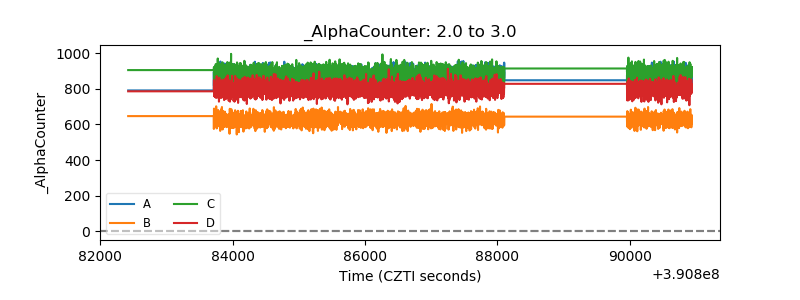 |
| _CPM_Rate | 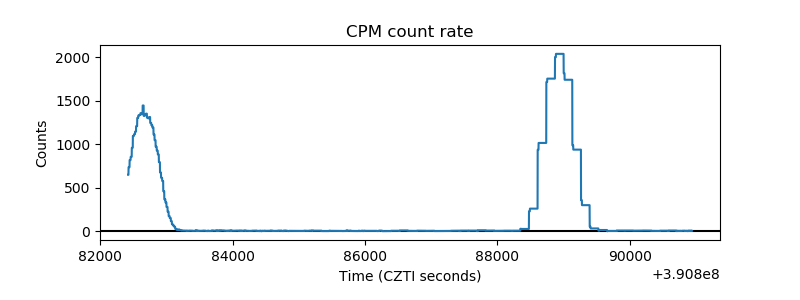 |
| CZT Counter | 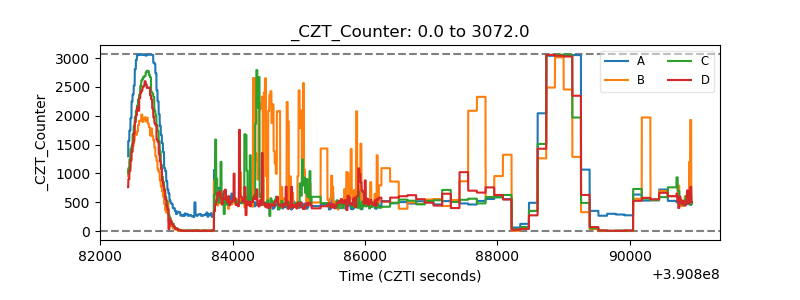 |
| +2.5 Volts monitor | 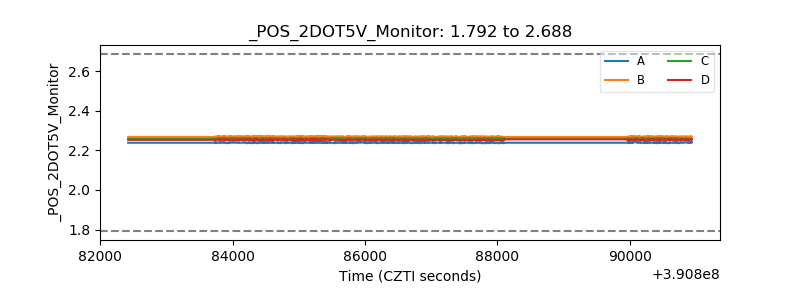 |
| +5 Volts monitor | 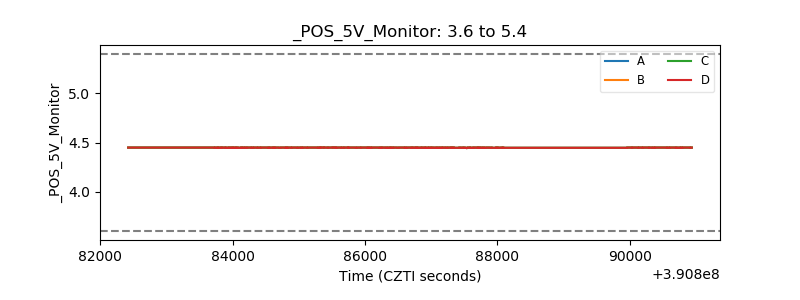 |
| _ROLL_ROT | 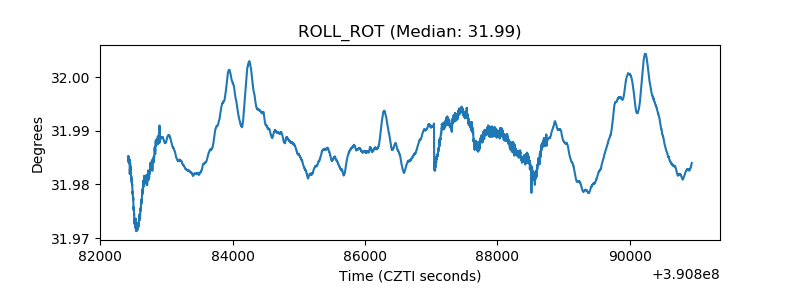 |
| _Roll_DEC | 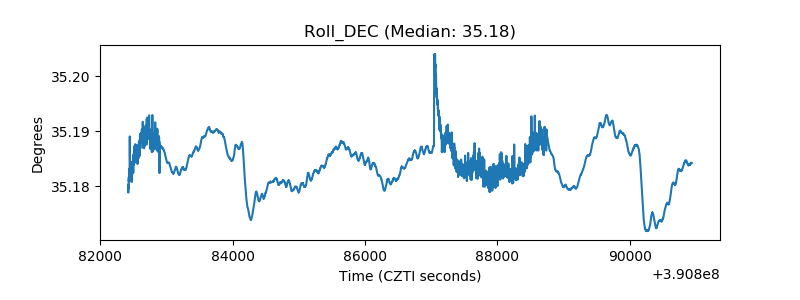 |
| _Roll_RA | 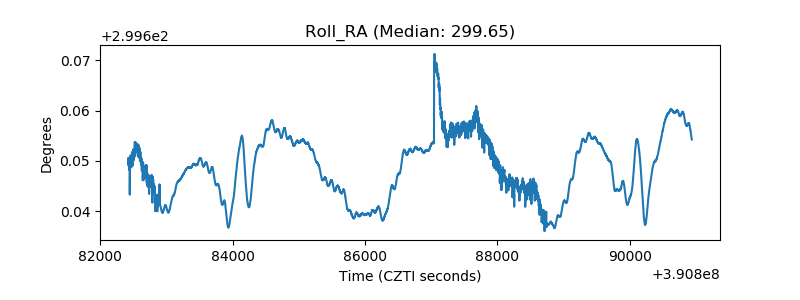 |
| Veto Counter | 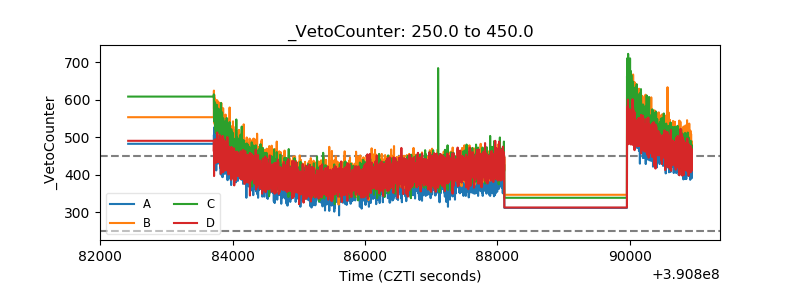 |