| Param | Original file | Final file |
|---|---|---|
| Filename | modeM0/AS1A11_080T01_9000005146_35914cztM0_level2.evt | modeM0/AS1A11_080T01_9000005146_35914cztM0_level2_quad_clean.evt |
| Size (bytes) | 1,709,429,760 | 218,949,120 |
| Size | 1.6 GB | 208.8 MB |
| Events in quadrant A | 10,550,164 | 1,420,547 |
| Events in quadrant B | 15,223,482 | 1,304,956 |
| Events in quadrant C | 10,391,284 | 1,370,043 |
| Events in quadrant D | 14,404,622 | 1,305,037 |
| Mode M9 | |||
|---|---|---|---|
| Quadrant | BADHDUFLAG | Total packets | Discarded packets |
| A | 0 | 81 | 0 |
| B | 0 | 81 | 0 |
| C | 0 | 81 | 0 |
| D | 0 | 81 | 0 |
| Mode SS | |||
|---|---|---|---|
| Quadrant | BADHDUFLAG | Total packets | Discarded packets |
| A | 0 | 364 | 0 |
| B | 0 | 364 | 0 |
| C | 0 | 364 | 0 |
| D | 0 | 364 | 0 |
| Mode M0 | |||
|---|---|---|---|
| Quadrant | BADHDUFLAG | Total packets | Discarded packets |
| A | 0 | 42401 | 5 |
| B | 0 | 56212 | 4 |
| C | 0 | 41054 | 4 |
| D | 0 | 55190 | 4 |
| Quadrant | Total seconds | Saturated seconds | Saturation percentage |
|---|---|---|---|
| A | 17851 | 54 | 0.302504% |
| B | 17851 | 2220 | 12.436278% |
| C | 17851 | 242 | 1.355666% |
| D | 17851 | 782 | 4.380707% |
Noise dominated data is calculated using 1-second bins in cleaned event files. If a bin has >2000 counts, and if more than 50% of those come from <1% of pixels, then it is considered to be noise-dominated and hence unusable.
| Quadrant | # 1 sec bins | Bins with >0 counts | Bins with >2000 counts | High rate bins dominated by noise | Noise dominated (total time) | Noise dominated (detector-on time) | Marked lightcurve |
|---|---|---|---|---|---|---|---|
| A | 25922 | 17855 | 20 | 20 | 0.08% | 0.11% | 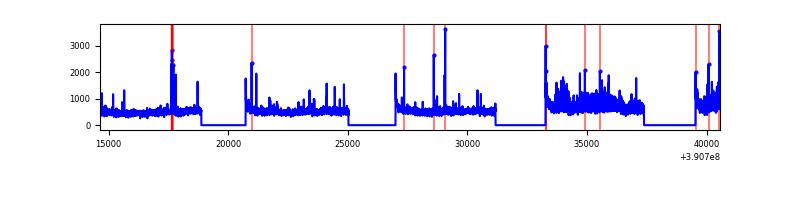 |
| B | 25922 | 17854 | 1609 | 1609 | 6.21% | 9.01% | 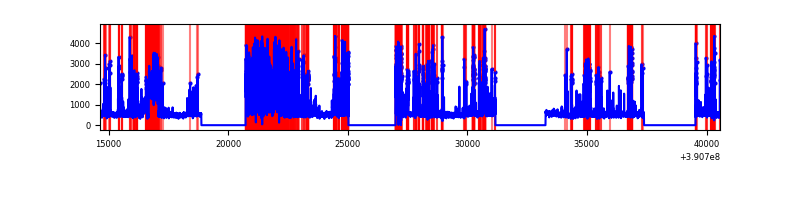 |
| C | 25922 | 17855 | 202 | 202 | 0.78% | 1.13% | 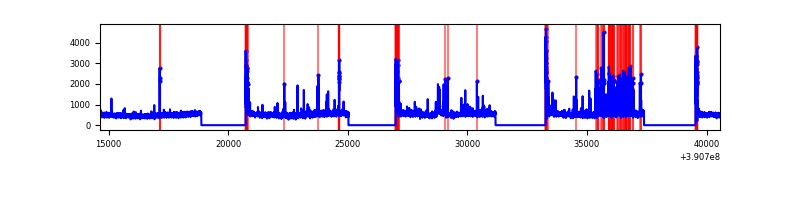 |
| D | 25922 | 17855 | 645 | 645 | 2.49% | 3.61% | 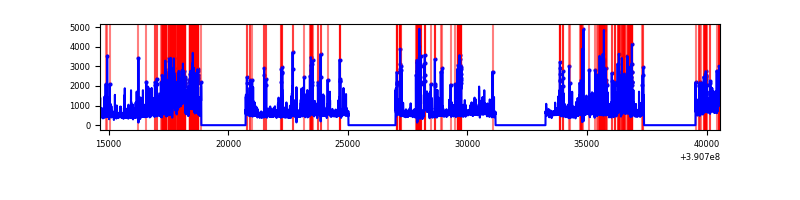 |
Top three noisy pixels from each quadrant. If the there are fewer than three noisy pixels in the level2.evt file, extra rows are filled as -1
| Pixel properties | Quadrant properties | ||||||
|---|---|---|---|---|---|---|---|
| Quadrant | DetID | PixID | Counts | Sigma | Mean | Median | Sigma |
| A | 15 | 169 | 1094312 | 2416.24 | 2273 | 2241 | 452.0 |
| A | 10 | 83 | 448015 | 986.29 | 2273 | 2241 | 452.0 |
| A | 9 | 143 | 187004 | 408.79 | 2273 | 2241 | 452.0 |
| B | 5 | 172 | 5462357 | 13946.03 | 2115 | 2071 | 391.5 |
| B | 5 | 63 | 997974 | 2543.62 | 2115 | 2071 | 391.5 |
| B | 5 | 255 | 248633 | 629.74 | 2115 | 2071 | 391.5 |
| C | 15 | 214 | 744296 | 1518.15 | 2147 | 2168 | 488.8 |
| C | 0 | 207 | 698973 | 1425.44 | 2147 | 2168 | 488.8 |
| C | 0 | 10 | 567010 | 1155.48 | 2147 | 2168 | 488.8 |
| D | 12 | 227 | 1828169 | 3492.07 | 2154 | 2104 | 522.9 |
| D | 8 | 195 | 1242734 | 2372.52 | 2154 | 2104 | 522.9 |
| D | 1 | 52 | 988468 | 1886.27 | 2154 | 2104 | 522.9 |
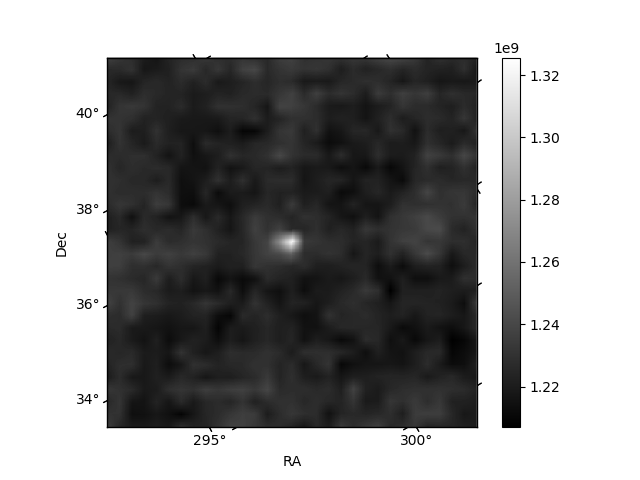
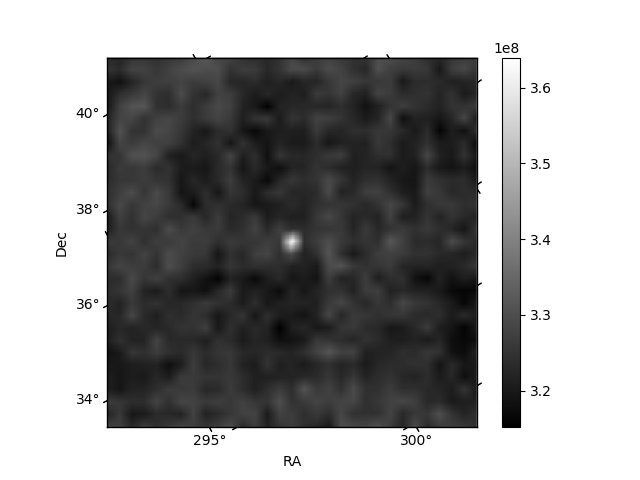
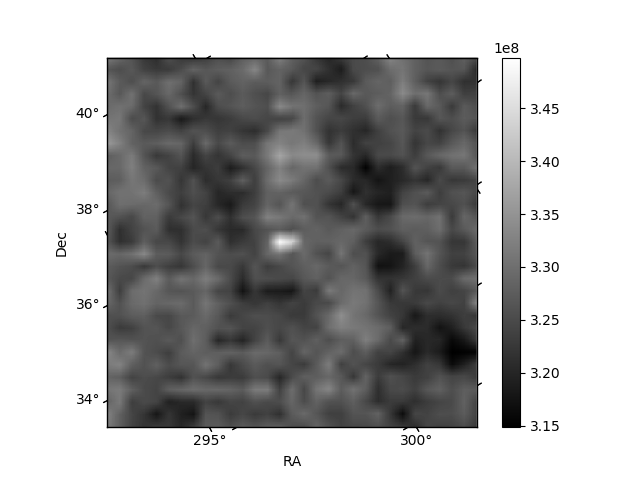
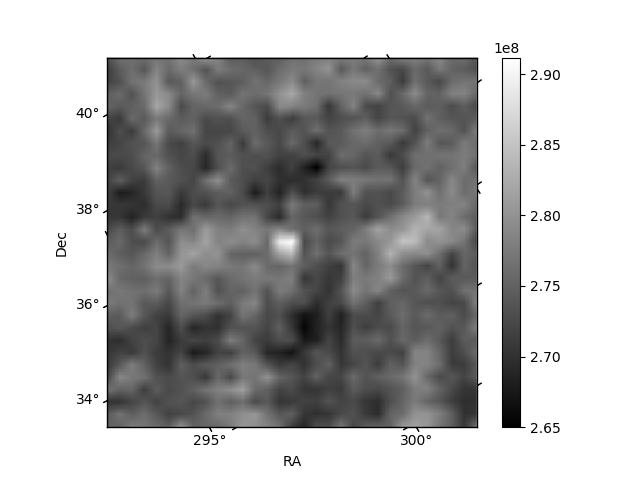
Histogram calculated using DETX and DETY for each event in the final _common_clean file
| Quadrant A | 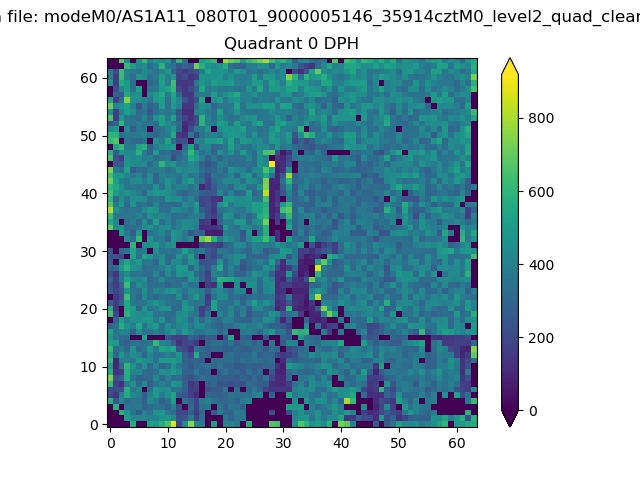 |
 |
Quadrant B |
|---|---|---|---|
| Quadrant D | 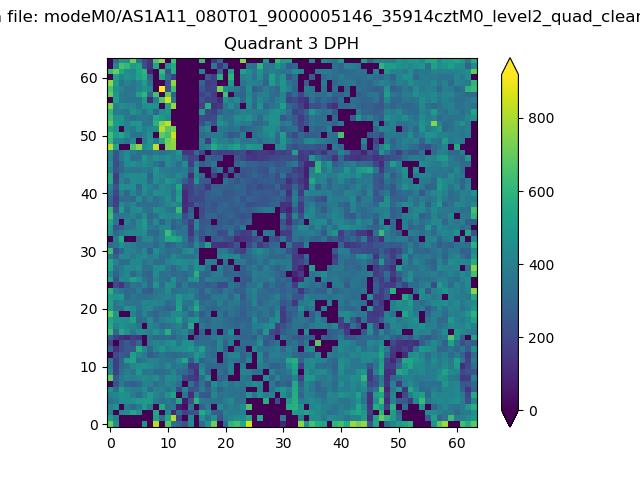 |
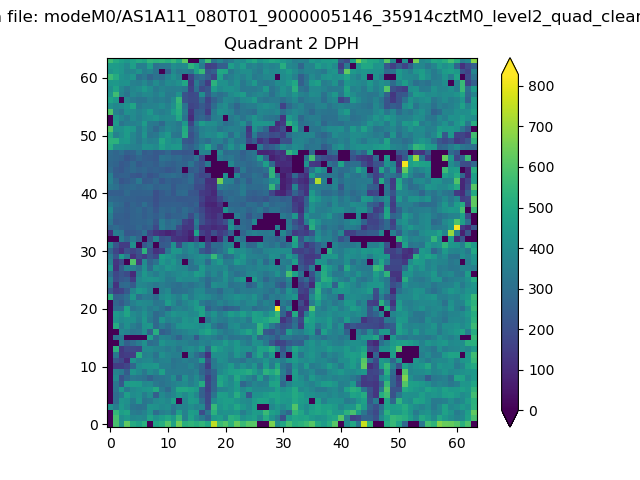 |
Quadrant C |
| Plot type | Count rate plots | Images |
|---|---|---|
| Comparison with Poisson distribution Blue bars denote a histogram of data divided into 1 sec bins. Red curve is a Poisson curve with rate = median count rate of data. |
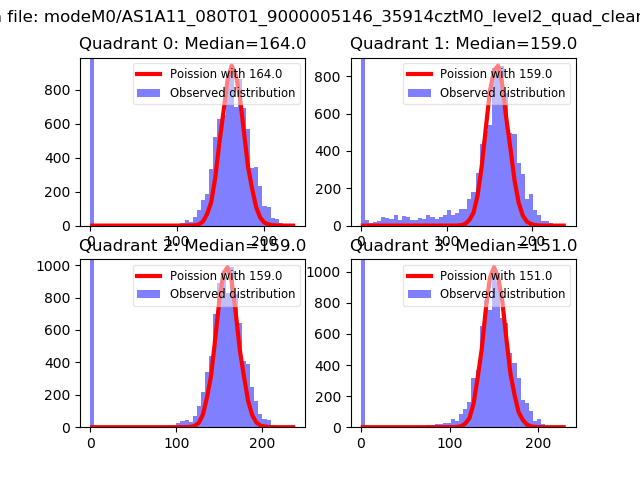 |
 |
| Quadrant-wise count rates Data is divided into 100 sec bins |
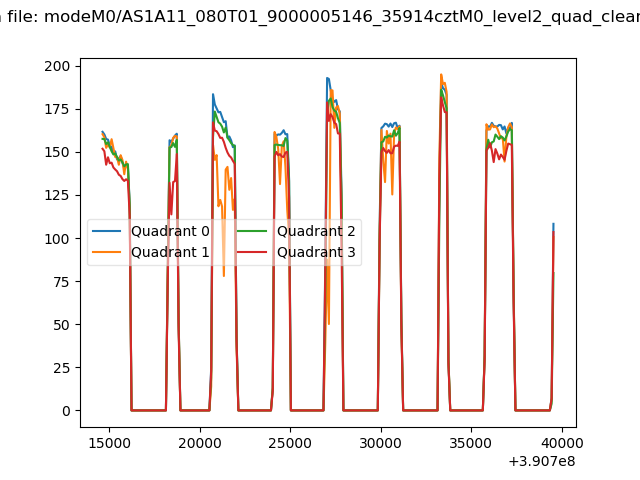 |
|
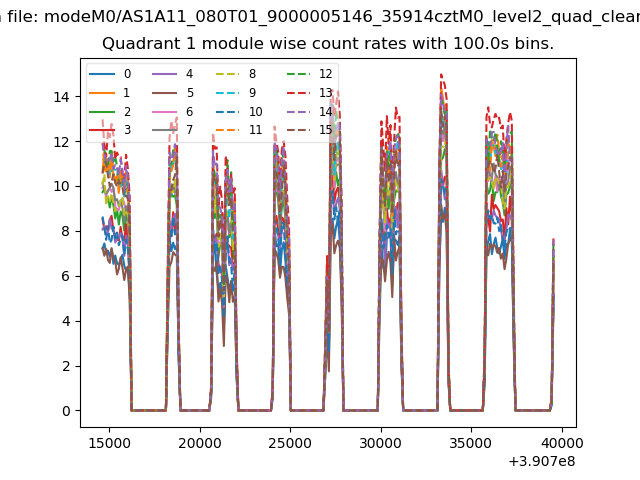
| Module-wise count rates for Quadrant A Data is divided into 100 sec bins |
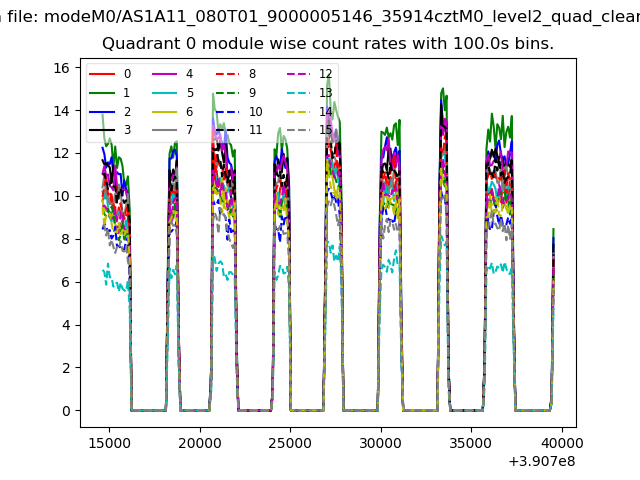 |
 |
| Module-wise count rates for Quadrant B Data is divided into 100 sec bins |
 |
 |
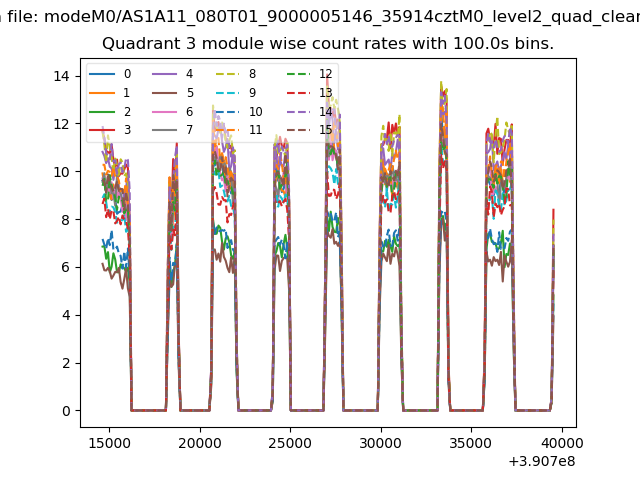
| Module-wise count rates for Quadrant C Data is divided into 100 sec bins |
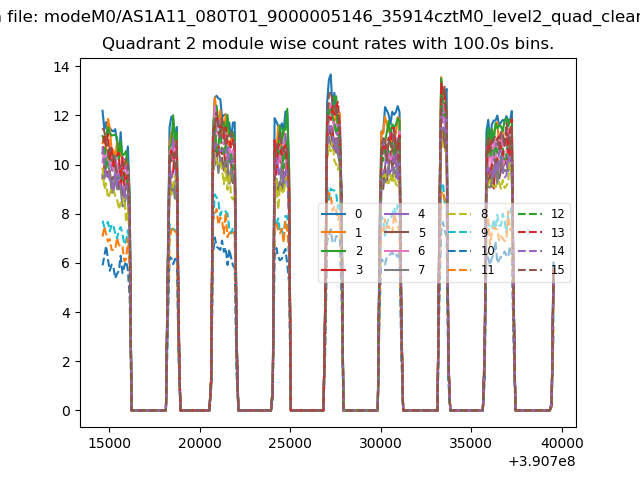 |
 |
| Module-wise count rates for Quadrant D Data is divided into 100 sec bins |
 |
 |
| Parameter | Plot |
|---|---|
| CZT HV Monitor | 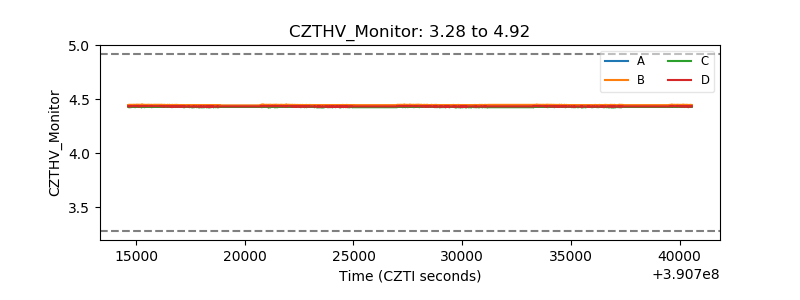 |
| D_VDD | 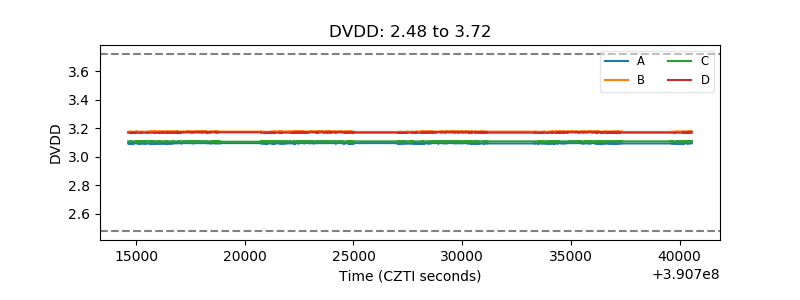 |
| Temperature 1 | 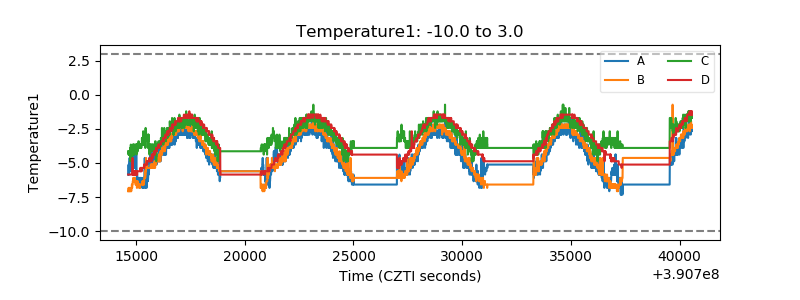 |
| Veto HV Monitor | 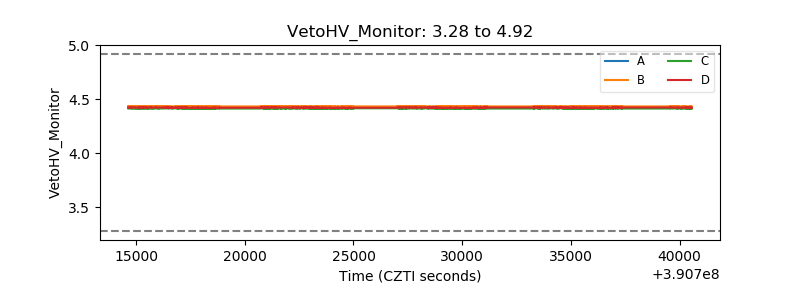 |
| Veto LLD | 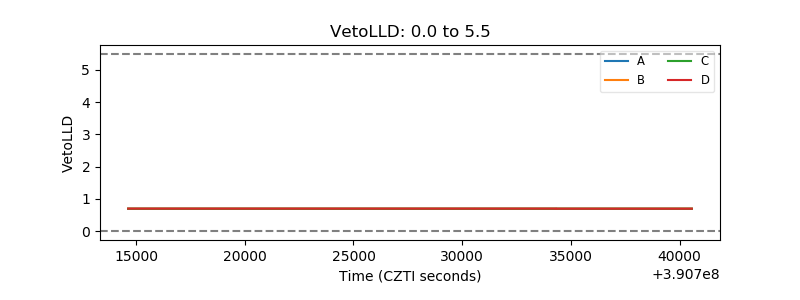 |
| Alpha Counter | 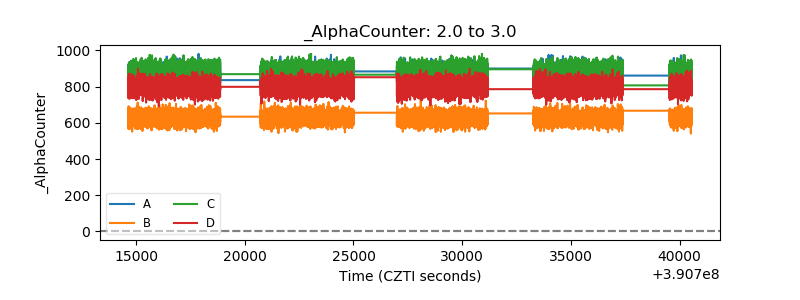 |
| _CPM_Rate | 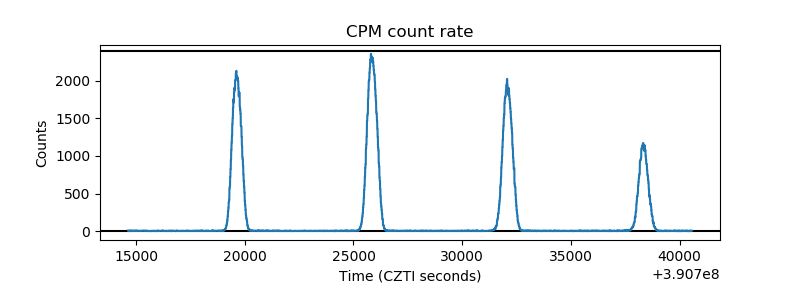 |
| CZT Counter | 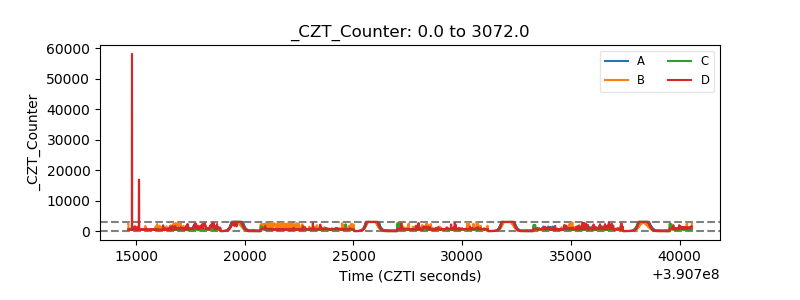 |
| +2.5 Volts monitor | 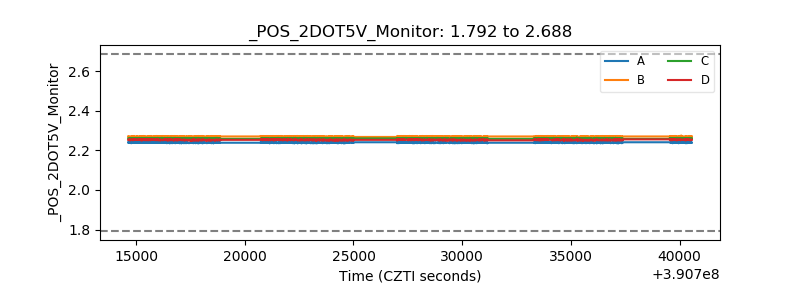 |
| +5 Volts monitor | 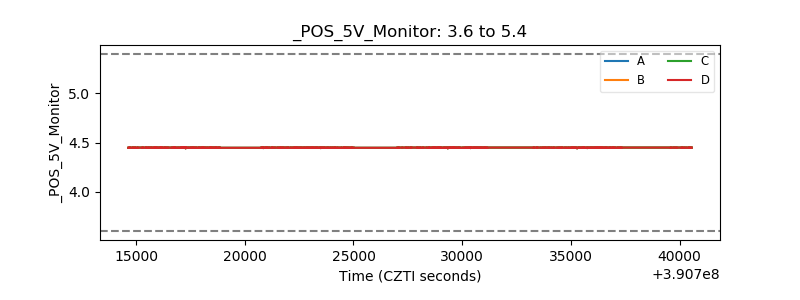 |
| _ROLL_ROT | 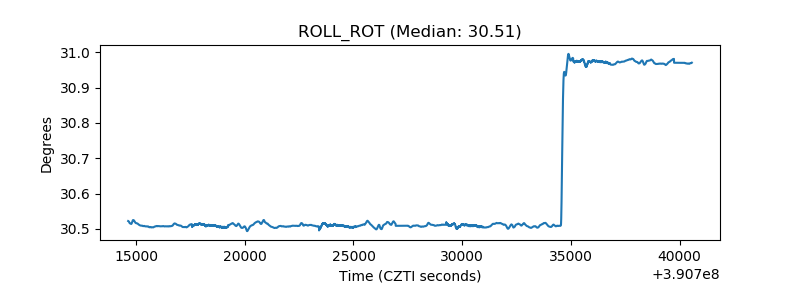 |
| _Roll_DEC | 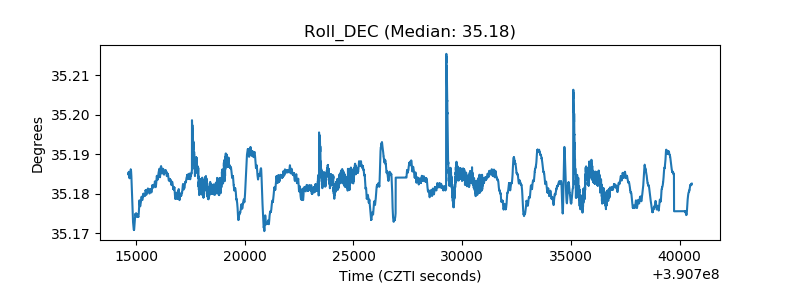 |
| _Roll_RA | 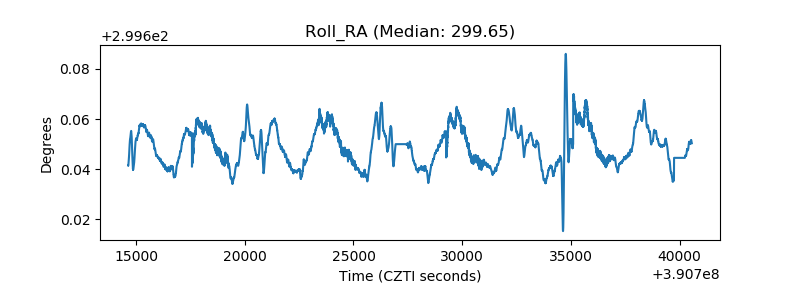 |
| Veto Counter | 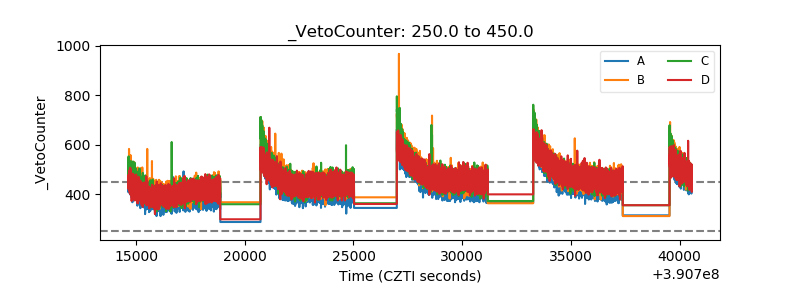 |