| Param | Original file | Final file |
|---|---|---|
| Filename | modeM0/AS1A11_080T01_9000005146_35913cztM0_level2.evt | modeM0/AS1A11_080T01_9000005146_35913cztM0_level2_quad_clean.evt |
| Size (bytes) | 482,063,040 | 69,062,400 |
| Size | 459.7 MB | 65.9 MB |
| Events in quadrant A | 3,101,983 | 456,773 |
| Events in quadrant B | 4,059,972 | 414,122 |
| Events in quadrant C | 3,186,658 | 435,131 |
| Events in quadrant D | 3,897,900 | 420,398 |
| Mode M9 | |||
|---|---|---|---|
| Quadrant | BADHDUFLAG | Total packets | Discarded packets |
| A | 0 | 21 | 0 |
| B | 0 | 21 | 0 |
| C | 0 | 21 | 0 |
| D | 0 | 22 | 0 |
| Mode SS | |||
|---|---|---|---|
| Quadrant | BADHDUFLAG | Total packets | Discarded packets |
| A | 0 | 106 | 0 |
| B | 0 | 106 | 0 |
| C | 0 | 106 | 0 |
| D | 0 | 106 | 0 |
| Mode M0 | |||
|---|---|---|---|
| Quadrant | BADHDUFLAG | Total packets | Discarded packets |
| A | 0 | 12275 | 3 |
| B | 0 | 15198 | 2 |
| C | 0 | 12452 | 2 |
| D | 0 | 15268 | 2 |
| Quadrant | Total seconds | Saturated seconds | Saturation percentage |
|---|---|---|---|
| A | 5204 | 21 | 0.403536% |
| B | 5204 | 509 | 9.780938% |
| C | 5204 | 89 | 1.710223% |
| D | 5204 | 162 | 3.112990% |
Noise dominated data is calculated using 1-second bins in cleaned event files. If a bin has >2000 counts, and if more than 50% of those come from <1% of pixels, then it is considered to be noise-dominated and hence unusable.
| Quadrant | # 1 sec bins | Bins with >0 counts | Bins with >2000 counts | High rate bins dominated by noise | Noise dominated (total time) | Noise dominated (detector-on time) | Marked lightcurve |
|---|---|---|---|---|---|---|---|
| A | 7297 | 5205 | 5 | 5 | 0.07% | 0.10% | 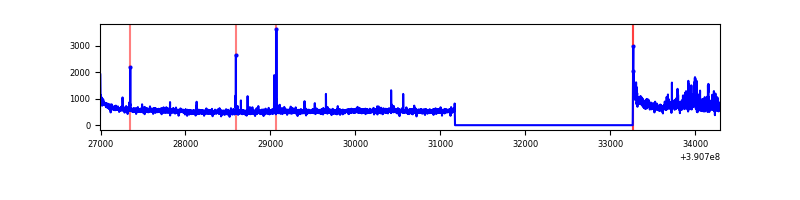 |
| B | 7297 | 5205 | 348 | 348 | 4.77% | 6.69% | 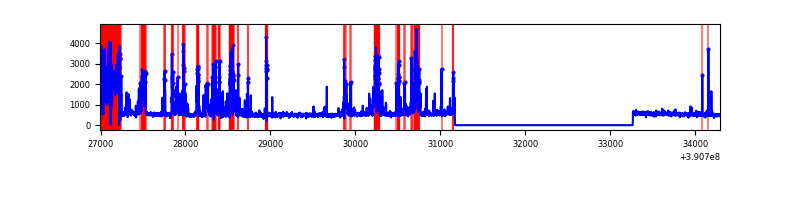 |
| C | 7297 | 5205 | 75 | 75 | 1.03% | 1.44% | 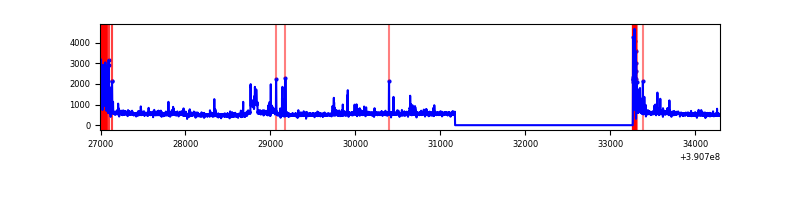 |
| D | 7297 | 5205 | 129 | 129 | 1.77% | 2.48% | 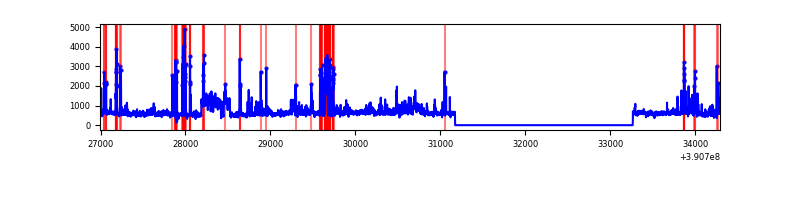 |
Top three noisy pixels from each quadrant. If the there are fewer than three noisy pixels in the level2.evt file, extra rows are filled as -1
| Pixel properties | Quadrant properties | ||||||
|---|---|---|---|---|---|---|---|
| Quadrant | DetID | PixID | Counts | Sigma | Mean | Median | Sigma |
| A | 15 | 169 | 231879 | 1676.43 | 689 | 678 | 137.9 |
| A | 10 | 83 | 161595 | 1166.8 | 689 | 678 | 137.9 |
| A | 9 | 143 | 38662 | 275.42 | 689 | 678 | 137.9 |
| B | 5 | 172 | 1412197 | 11816.86 | 639 | 626 | 119.5 |
| B | 5 | 255 | 106015 | 882.25 | 639 | 626 | 119.5 |
| B | 12 | 111 | 13780 | 110.11 | 639 | 626 | 119.5 |
| C | 0 | 10 | 254180 | 1721.01 | 644 | 652 | 147.3 |
| C | 15 | 214 | 221851 | 1501.56 | 644 | 652 | 147.3 |
| C | 0 | 207 | 195908 | 1325.45 | 644 | 652 | 147.3 |
| D | 8 | 195 | 367457 | 2342.46 | 650 | 634 | 156.6 |
| D | 1 | 52 | 303037 | 1931.09 | 650 | 634 | 156.6 |
| D | 13 | 249 | 206063 | 1311.83 | 650 | 634 | 156.6 |
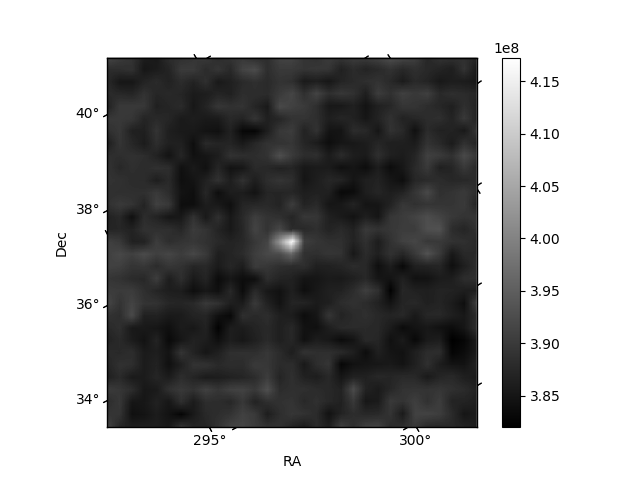
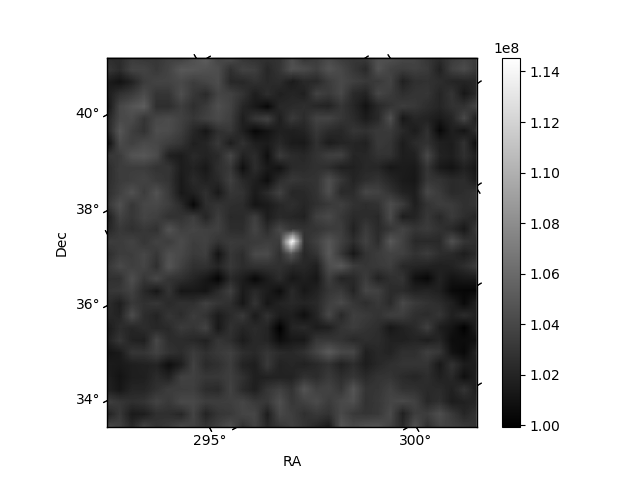
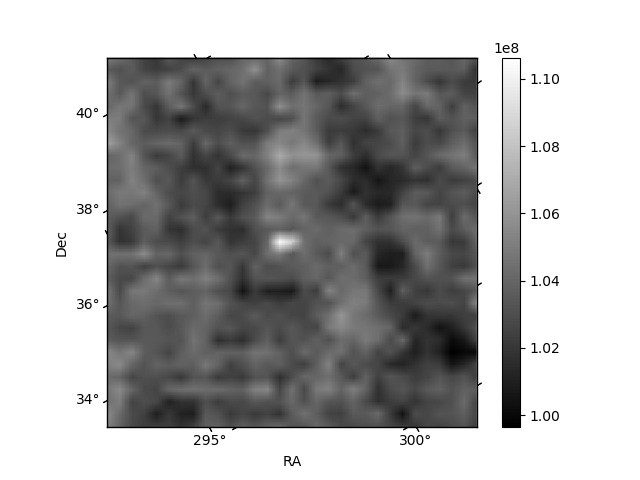
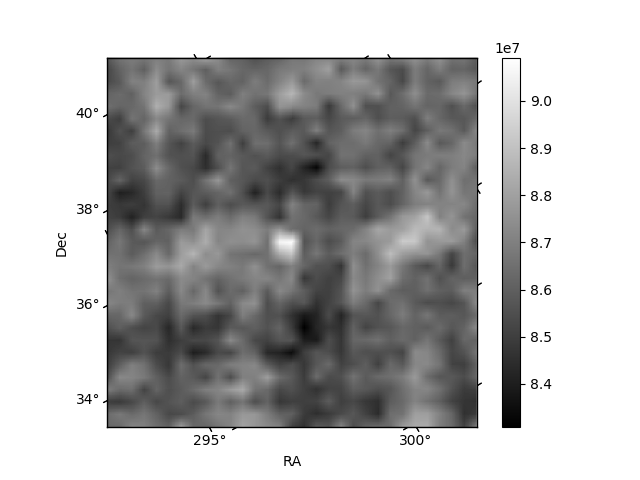
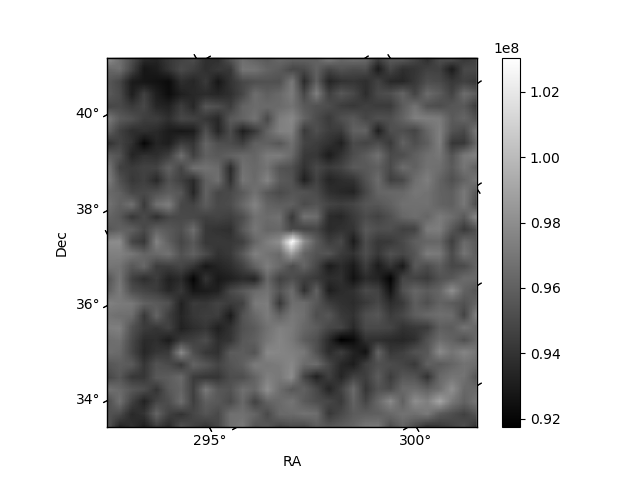
Histogram calculated using DETX and DETY for each event in the final _common_clean file
| Quadrant A | 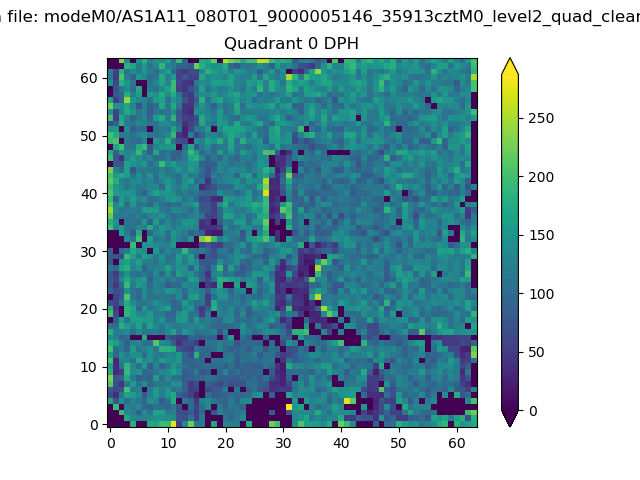 |
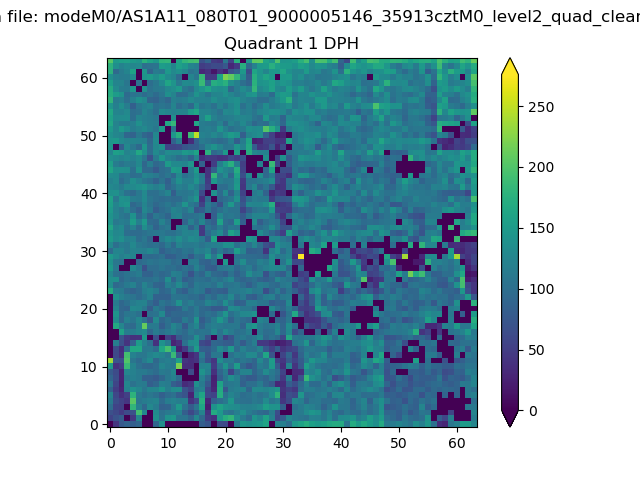 |
Quadrant B |
|---|---|---|---|
| Quadrant D | 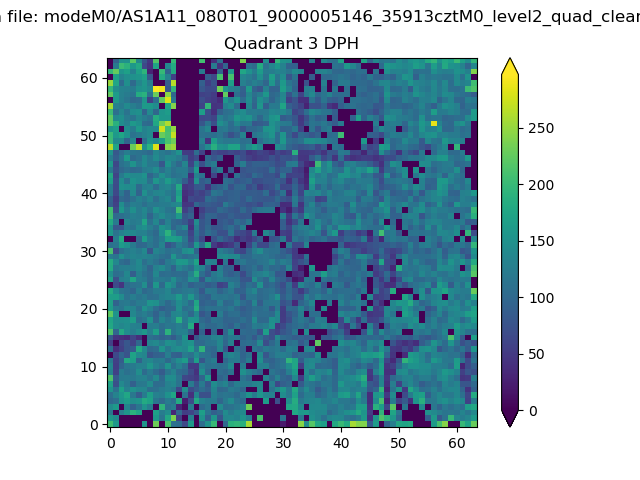 |
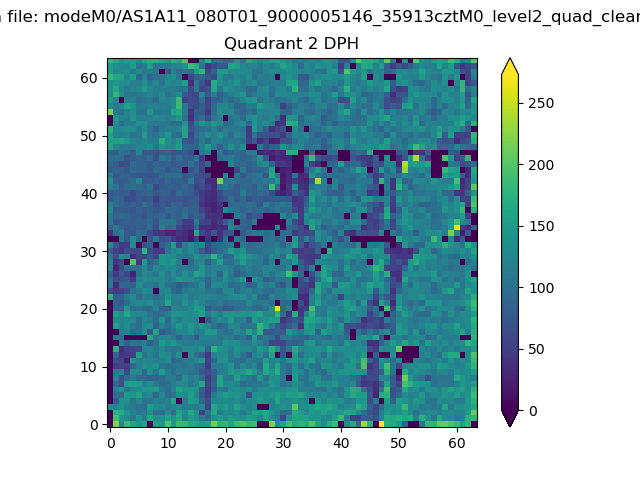 |
Quadrant C |
| Plot type | Count rate plots | Images |
|---|---|---|
| Comparison with Poisson distribution Blue bars denote a histogram of data divided into 1 sec bins. Red curve is a Poisson curve with rate = median count rate of data. |
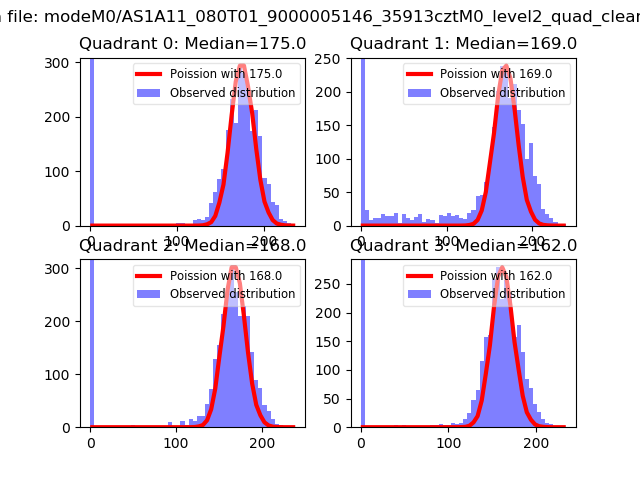 |
 |
| Quadrant-wise count rates Data is divided into 100 sec bins |
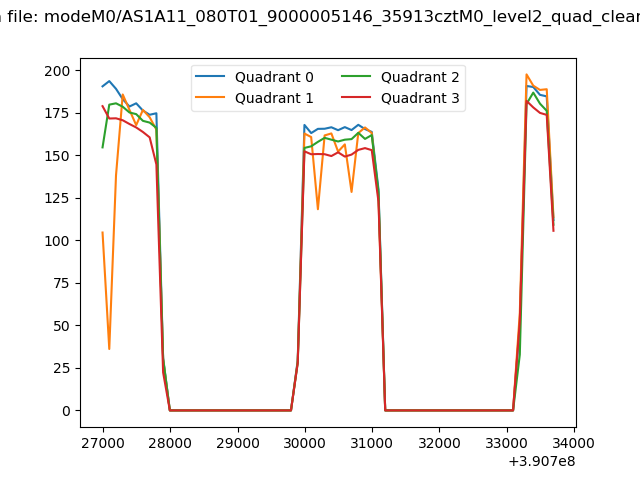 |
|
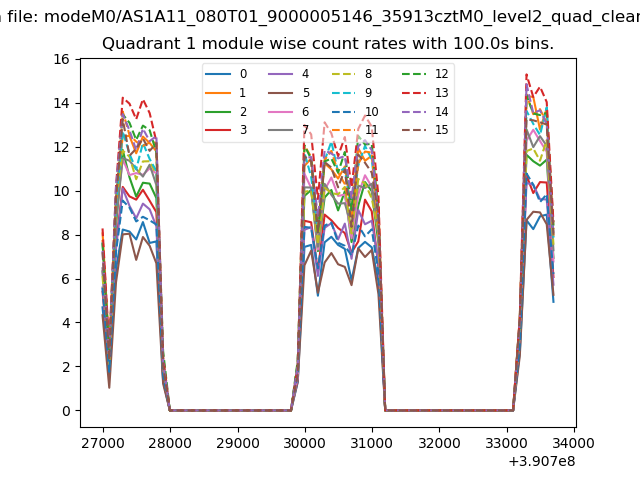
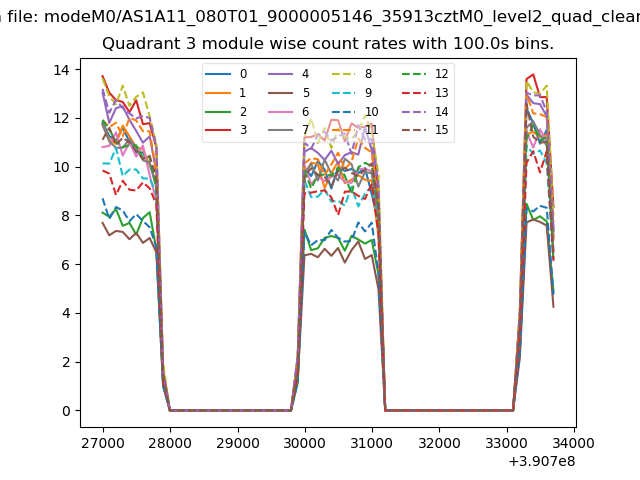
| Module-wise count rates for Quadrant A Data is divided into 100 sec bins |
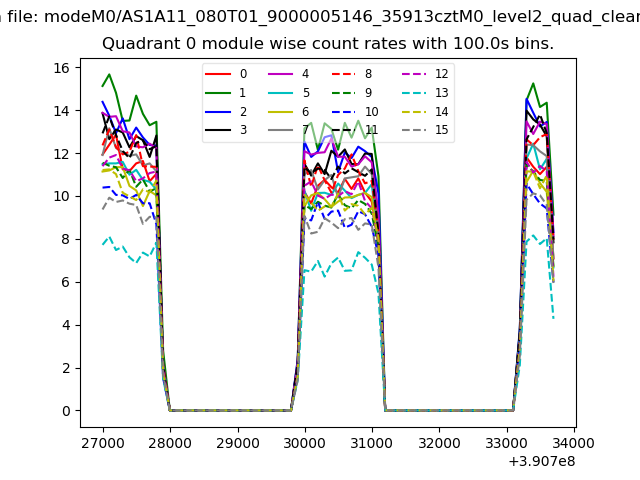 |
 |
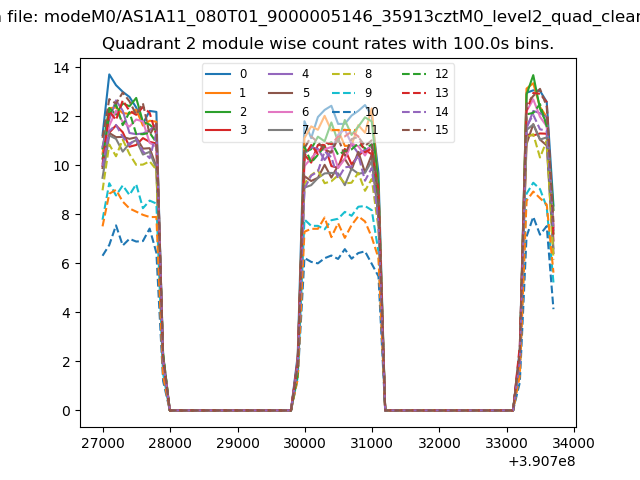
| Module-wise count rates for Quadrant B Data is divided into 100 sec bins |
 |
 |
| Module-wise count rates for Quadrant C Data is divided into 100 sec bins |
 |
 |
| Module-wise count rates for Quadrant D Data is divided into 100 sec bins |
 |
 |
| Parameter | Plot |
|---|---|
| CZT HV Monitor | 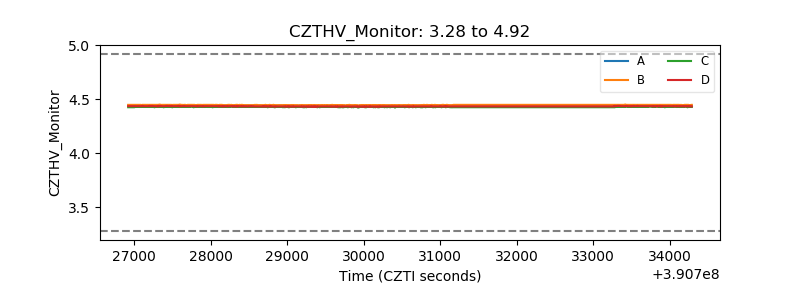 |
| D_VDD | 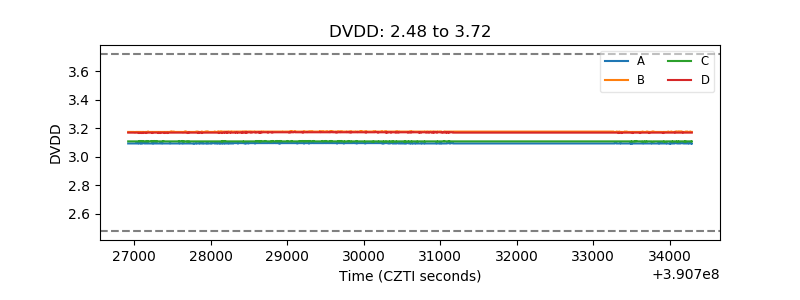 |
| Temperature 1 | 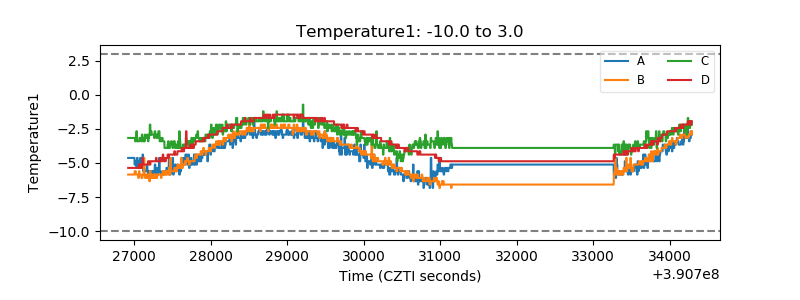 |
| Veto HV Monitor | 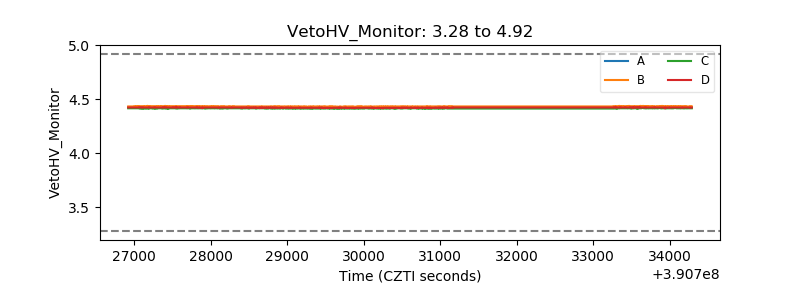 |
| Veto LLD | 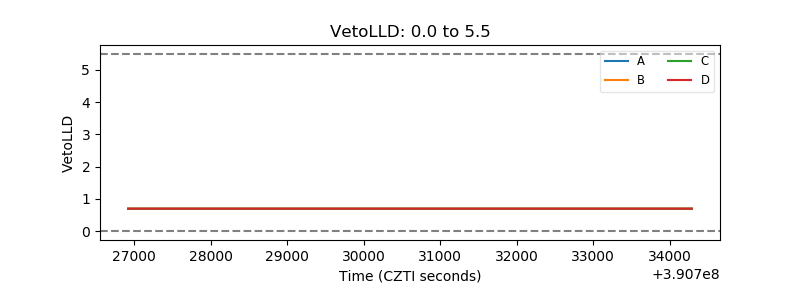 |
| Alpha Counter | 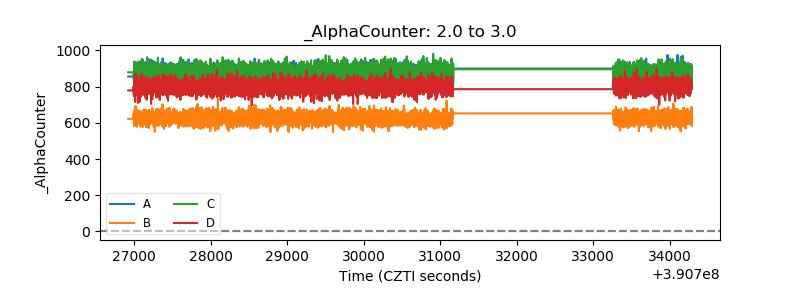 |
| _CPM_Rate | 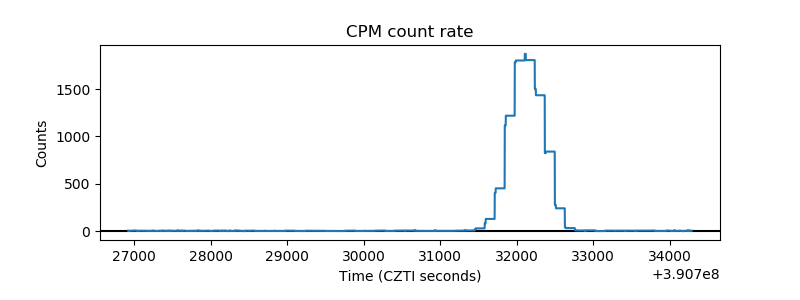 |
| CZT Counter | 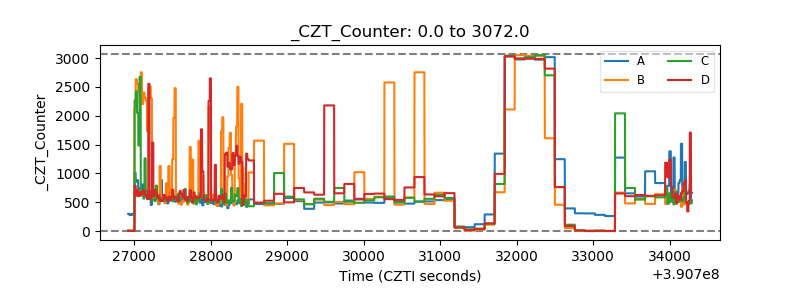 |
| +2.5 Volts monitor | 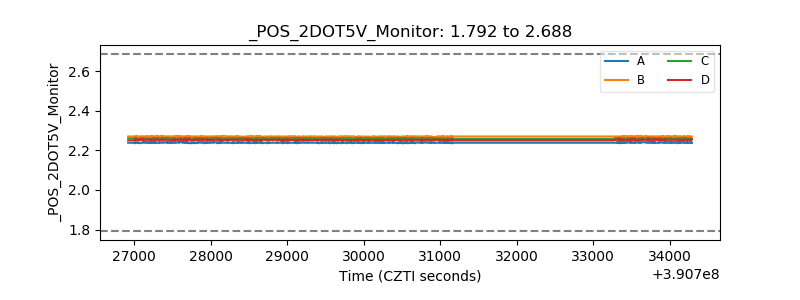 |
| +5 Volts monitor | 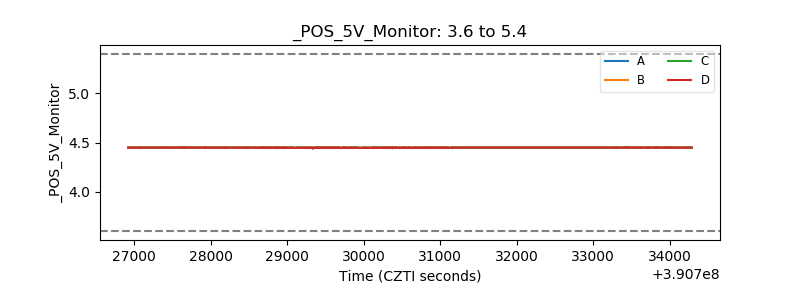 |
| _ROLL_ROT | 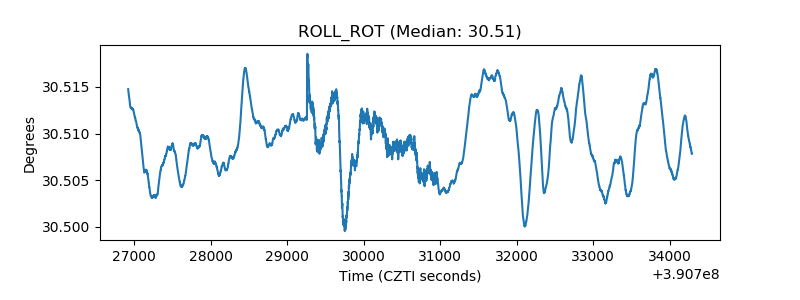 |
| _Roll_DEC | 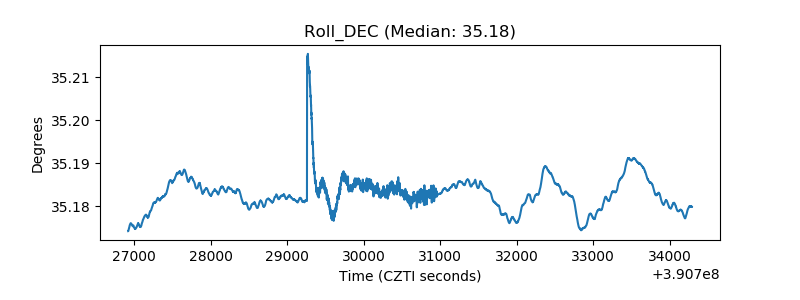 |
| _Roll_RA | 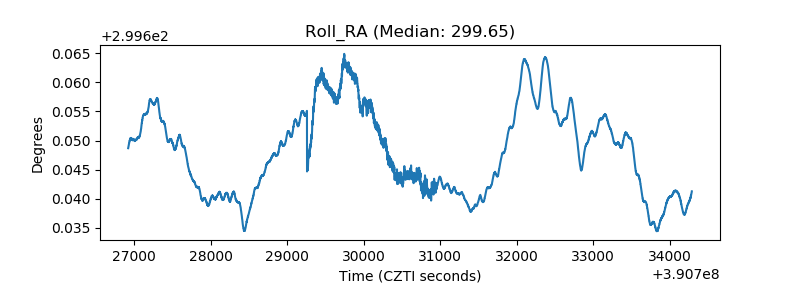 |
| Veto Counter | 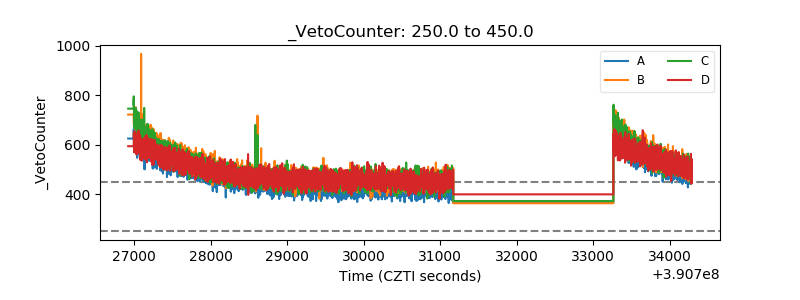 |