| Param | Original file | Final file |
|---|---|---|
| Filename | modeM0/AS1A11_080T01_9000005146_35907cztM0_level2.evt | modeM0/AS1A11_080T01_9000005146_35907cztM0_level2_quad_clean.evt |
| Size (bytes) | 896,676,480 | 162,187,200 |
| Size | 855.1 MB | 154.7 MB |
| Events in quadrant A | 5,310,878 | 1,079,809 |
| Events in quadrant B | 6,512,826 | 1,052,844 |
| Events in quadrant C | 5,759,933 | 1,055,616 |
| Events in quadrant D | 8,849,397 | 982,886 |
| Mode M9 | |||
|---|---|---|---|
| Quadrant | BADHDUFLAG | Total packets | Discarded packets |
| A | 0 | 28 | 0 |
| B | 0 | 28 | 0 |
| C | 0 | 28 | 0 |
| D | 0 | 29 | 0 |
| Mode SS | |||
|---|---|---|---|
| Quadrant | BADHDUFLAG | Total packets | Discarded packets |
| A | 0 | 218 | 0 |
| B | 0 | 218 | 0 |
| C | 0 | 218 | 0 |
| D | 0 | 218 | 0 |
| Mode M0 | |||
|---|---|---|---|
| Quadrant | BADHDUFLAG | Total packets | Discarded packets |
| A | 0 | 22597 | 4 |
| B | 0 | 26290 | 3 |
| C | 0 | 23392 | 3 |
| D | 0 | 33311 | 3 |
| Quadrant | Total seconds | Saturated seconds | Saturation percentage |
|---|---|---|---|
| A | 10699 | 21 | 0.196280% |
| B | 10699 | 351 | 3.280680% |
| C | 10699 | 185 | 1.729134% |
| D | 10699 | 742 | 6.935228% |
Noise dominated data is calculated using 1-second bins in cleaned event files. If a bin has >2000 counts, and if more than 50% of those come from <1% of pixels, then it is considered to be noise-dominated and hence unusable.
| Quadrant | # 1 sec bins | Bins with >0 counts | Bins with >2000 counts | High rate bins dominated by noise | Noise dominated (total time) | Noise dominated (detector-on time) | Marked lightcurve |
|---|---|---|---|---|---|---|---|
| A | 13534 | 10701 | 10 | 10 | 0.07% | 0.09% | 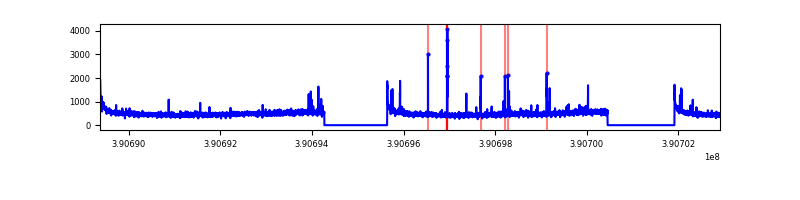 |
| B | 13534 | 10701 | 218 | 218 | 1.61% | 2.04% | 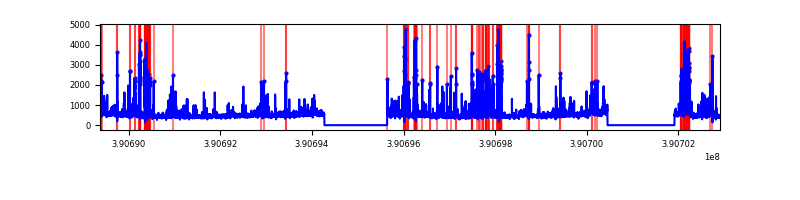 |
| C | 13534 | 10701 | 140 | 140 | 1.03% | 1.31% | 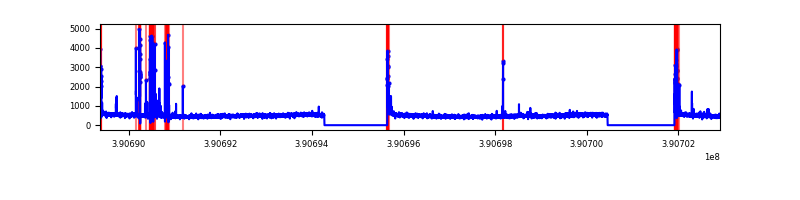 |
| D | 13534 | 10700 | 612 | 612 | 4.52% | 5.72% | 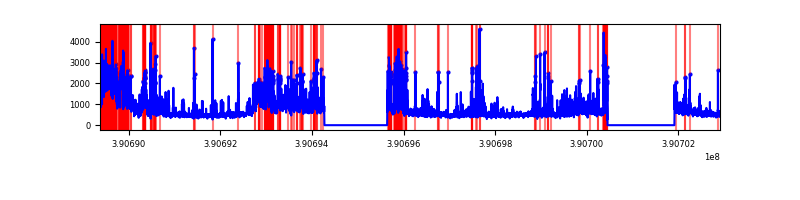 |
Top three noisy pixels from each quadrant. If the there are fewer than three noisy pixels in the level2.evt file, extra rows are filled as -1
| Pixel properties | Quadrant properties | ||||||
|---|---|---|---|---|---|---|---|
| Quadrant | DetID | PixID | Counts | Sigma | Mean | Median | Sigma |
| A | 10 | 83 | 282316 | 1102.76 | 1254 | 1234 | 254.9 |
| A | 9 | 143 | 89612 | 346.73 | 1254 | 1234 | 254.9 |
| A | 15 | 169 | 36858 | 139.76 | 1254 | 1234 | 254.9 |
| B | 5 | 172 | 1116484 | 4736.93 | 1228 | 1200 | 235.4 |
| B | 5 | 255 | 152575 | 642.93 | 1228 | 1200 | 235.4 |
| B | 4 | 232 | 126346 | 531.53 | 1228 | 1200 | 235.4 |
| C | 15 | 214 | 447130 | 1582.11 | 1206 | 1217 | 281.8 |
| C | 9 | 69 | 353989 | 1251.65 | 1206 | 1217 | 281.8 |
| C | 0 | 10 | 218075 | 769.42 | 1206 | 1217 | 281.8 |
| D | 12 | 227 | 1298885 | 4480.3 | 1184 | 1153 | 289.7 |
| D | 8 | 195 | 835997 | 2882.22 | 1184 | 1153 | 289.7 |
| D | 10 | 118 | 622440 | 2144.94 | 1184 | 1153 | 289.7 |
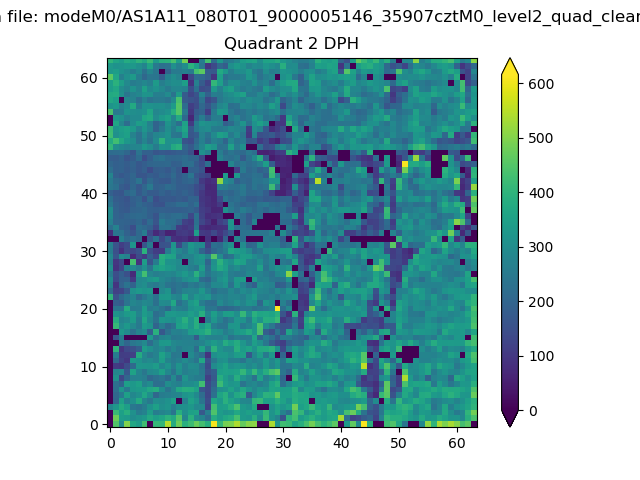
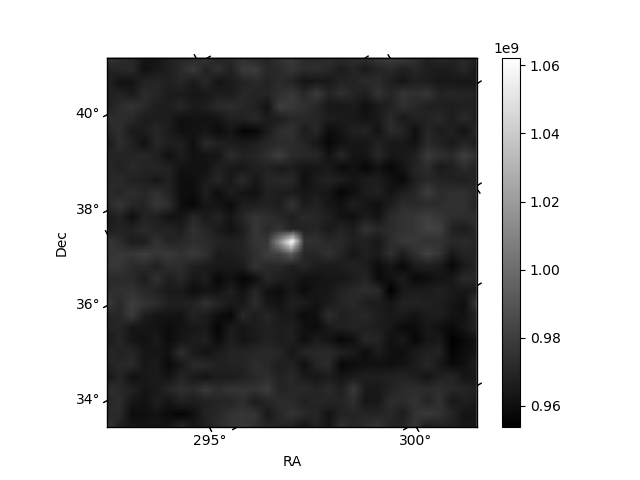
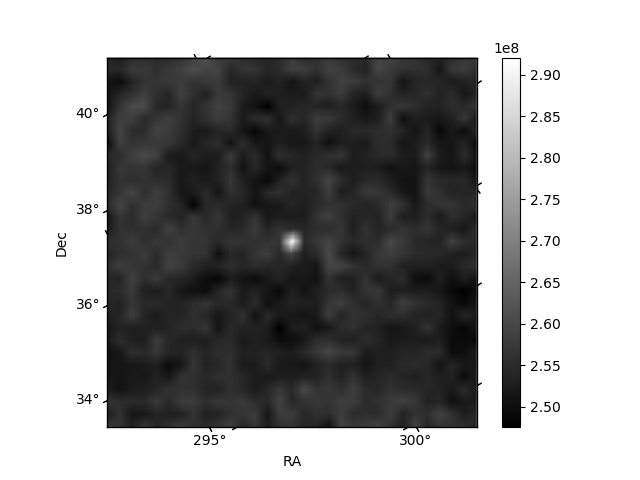
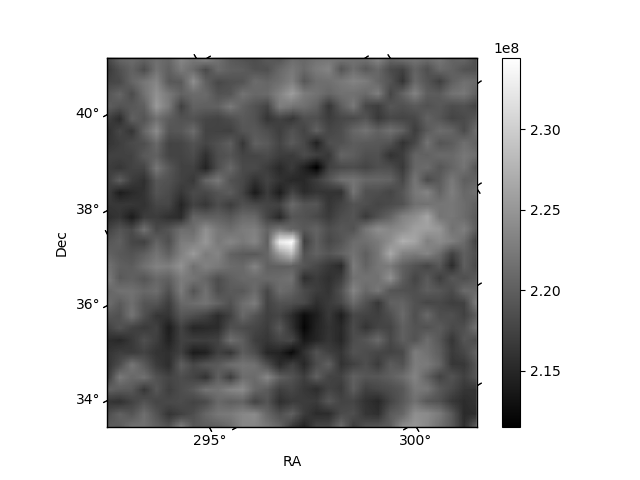
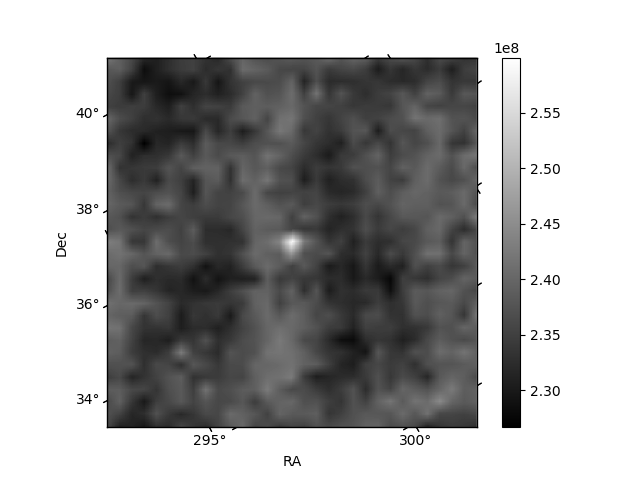
Histogram calculated using DETX and DETY for each event in the final _common_clean file
| Quadrant A | 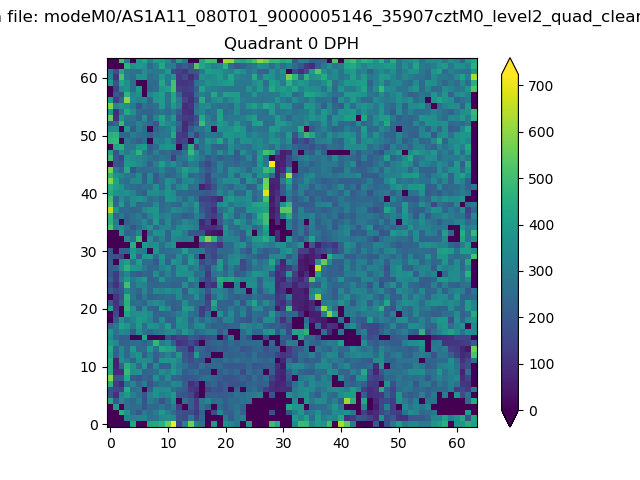 |
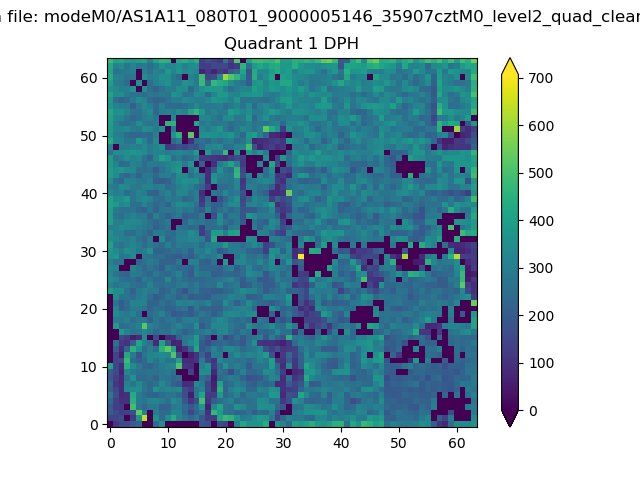 |
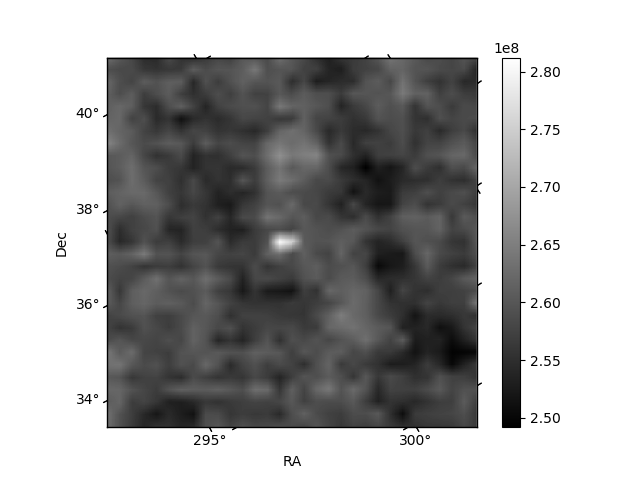
Quadrant B |
|---|---|---|---|
| Quadrant D | 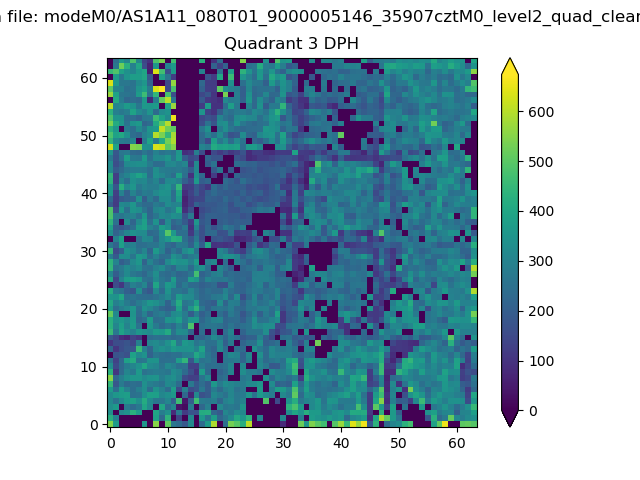 |
 |
Quadrant C |
| Plot type | Count rate plots | Images |
|---|---|---|
| Comparison with Poisson distribution Blue bars denote a histogram of data divided into 1 sec bins. Red curve is a Poisson curve with rate = median count rate of data. |
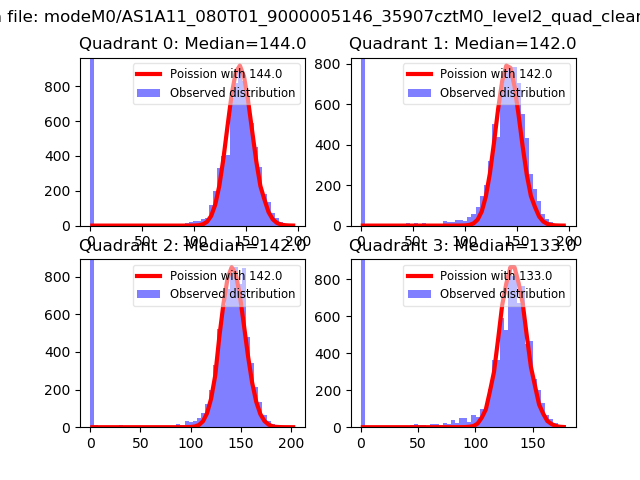 |
 |
| Quadrant-wise count rates Data is divided into 100 sec bins |
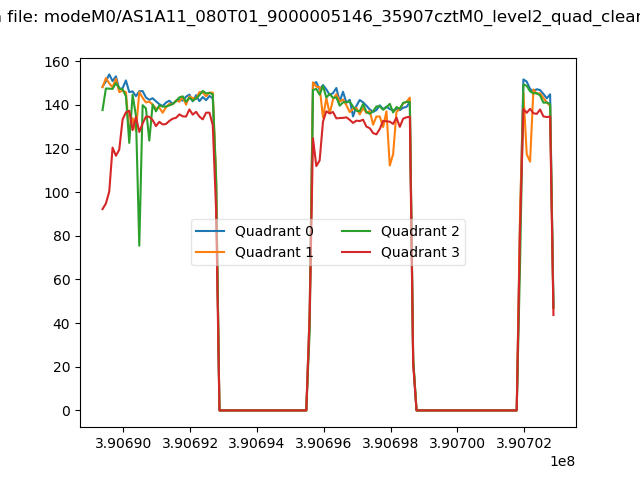 |
|
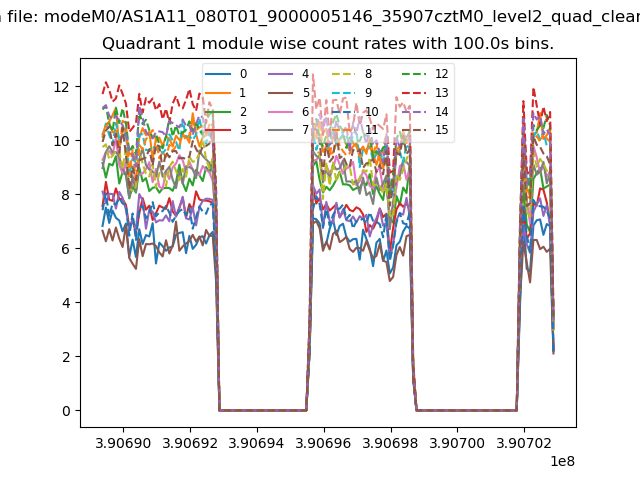
| Module-wise count rates for Quadrant A Data is divided into 100 sec bins |
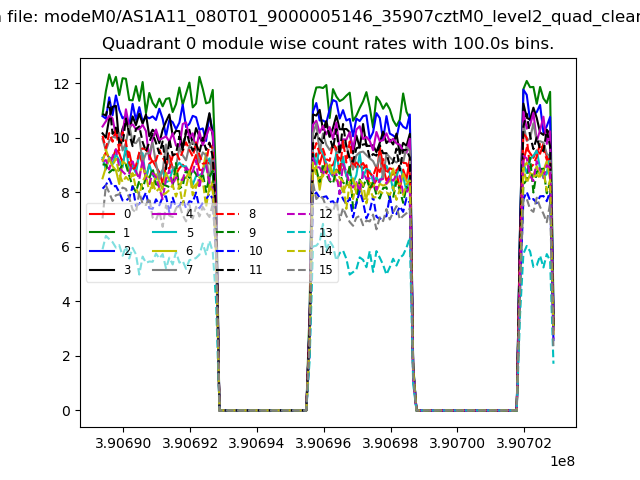 |
 |
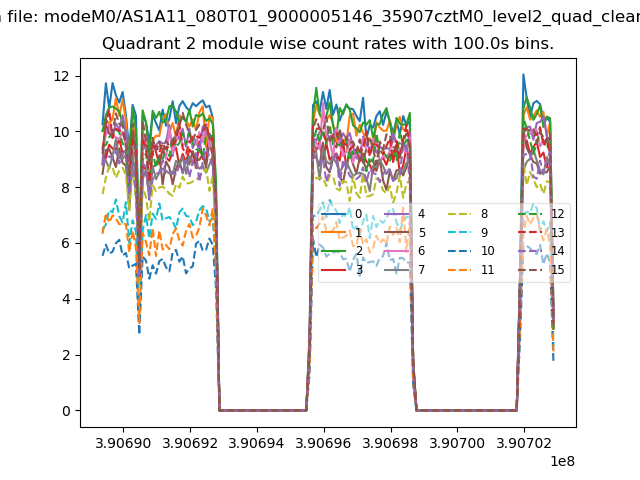
| Module-wise count rates for Quadrant B Data is divided into 100 sec bins |
 |
 |
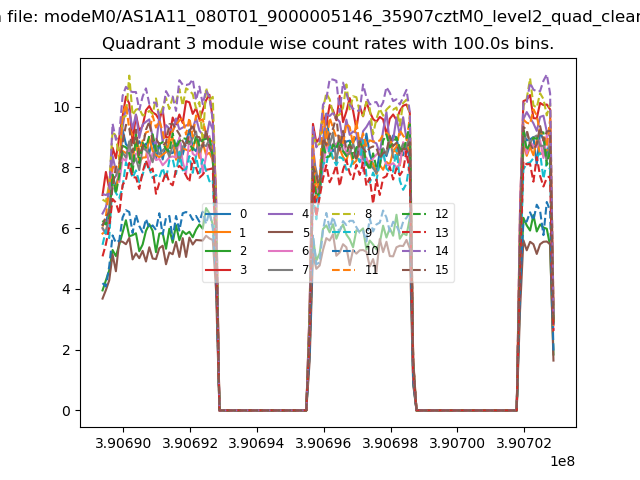
| Module-wise count rates for Quadrant C Data is divided into 100 sec bins |
 |
 |
| Module-wise count rates for Quadrant D Data is divided into 100 sec bins |
 |
 |
| Parameter | Plot |
|---|---|
| CZT HV Monitor | 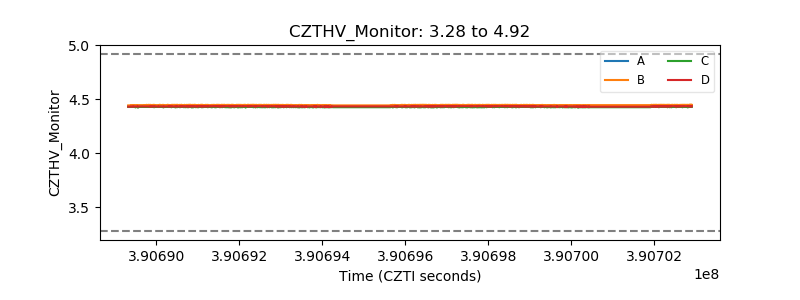 |
| D_VDD | 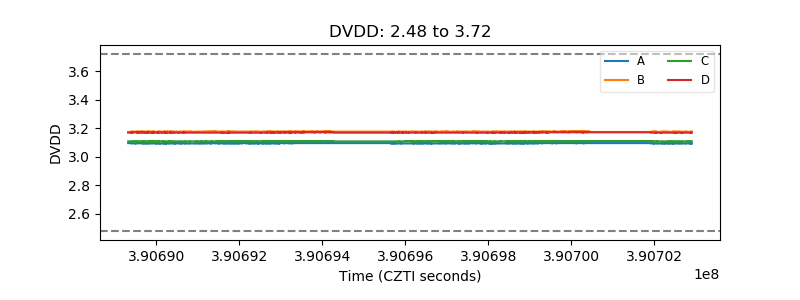 |
| Temperature 1 | 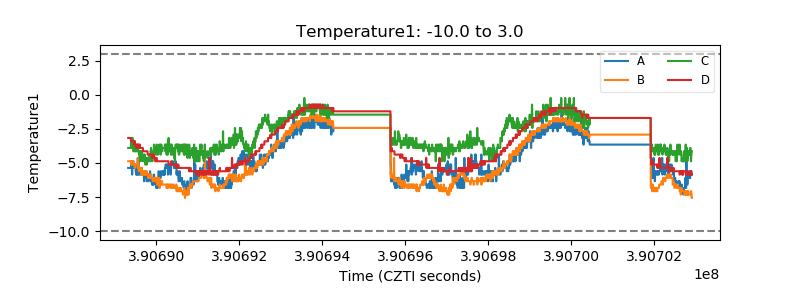 |
| Veto HV Monitor | 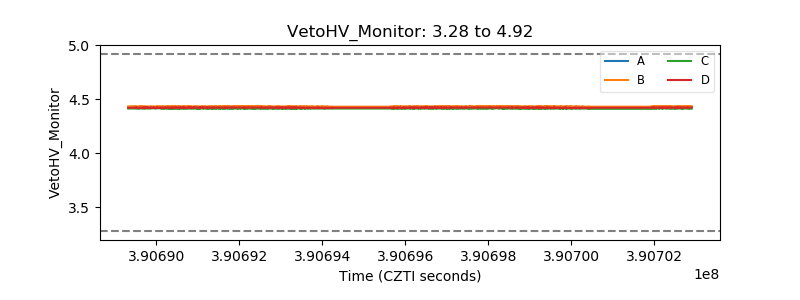 |
| Veto LLD | 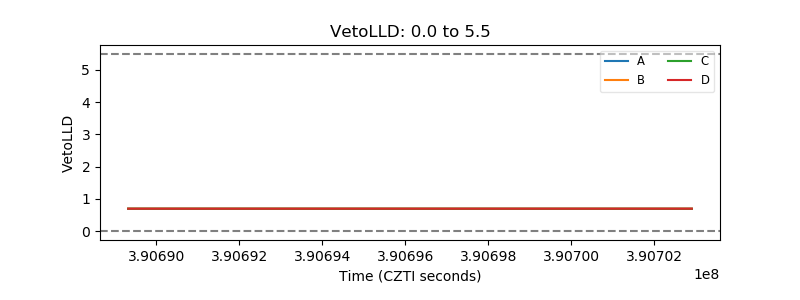 |
| Alpha Counter | 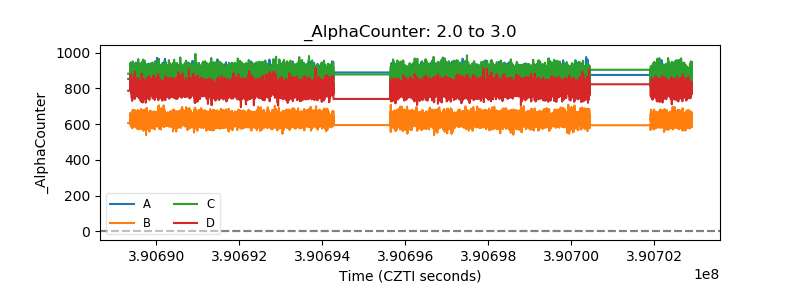 |
| _CPM_Rate | 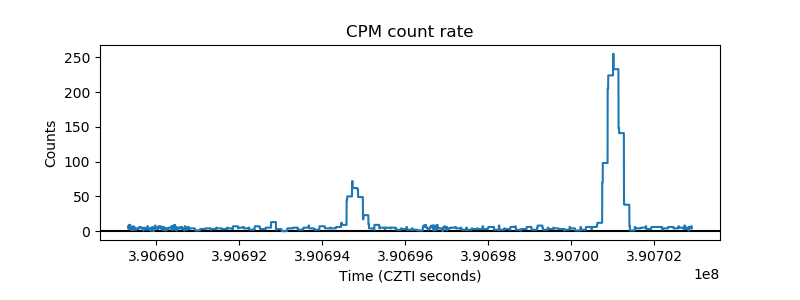 |
| CZT Counter | 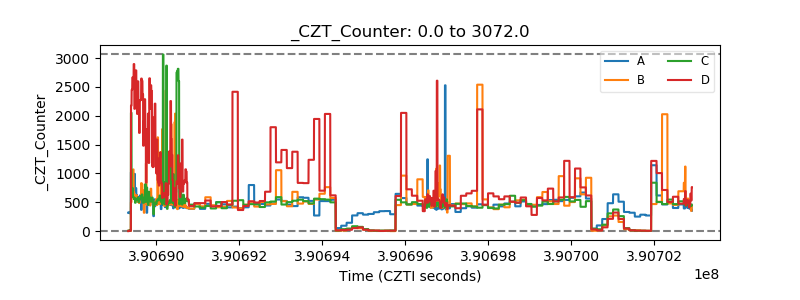 |
| +2.5 Volts monitor | 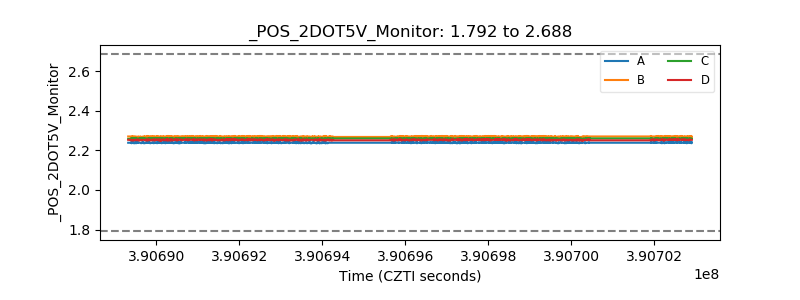 |
| +5 Volts monitor | 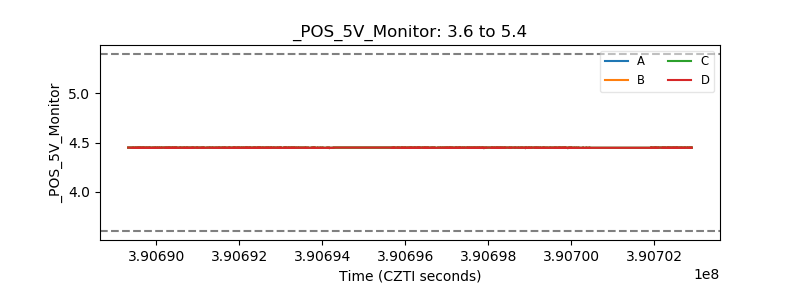 |
| _ROLL_ROT | 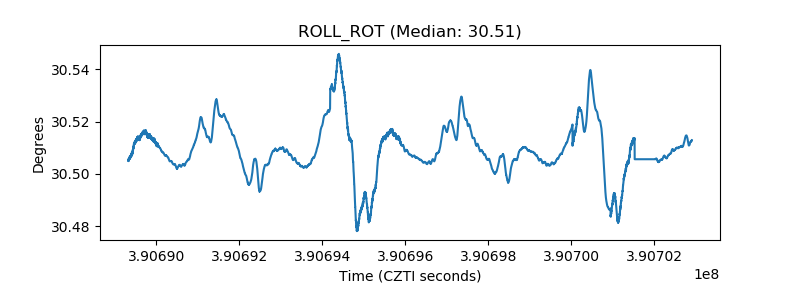 |
| _Roll_DEC | 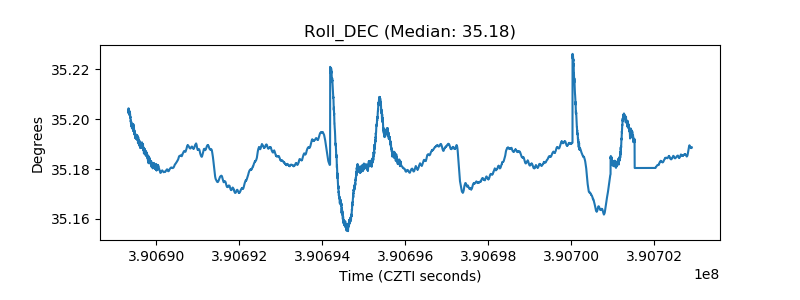 |
| _Roll_RA | 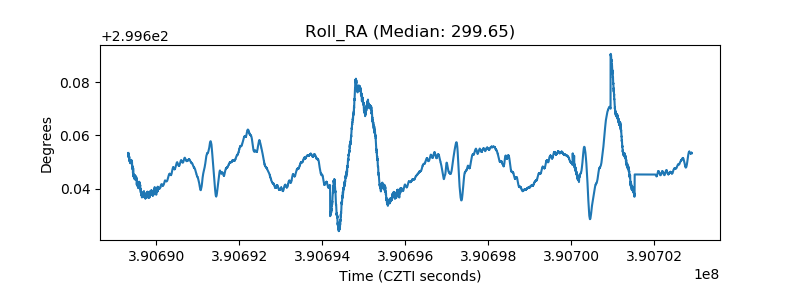 |
| Veto Counter | 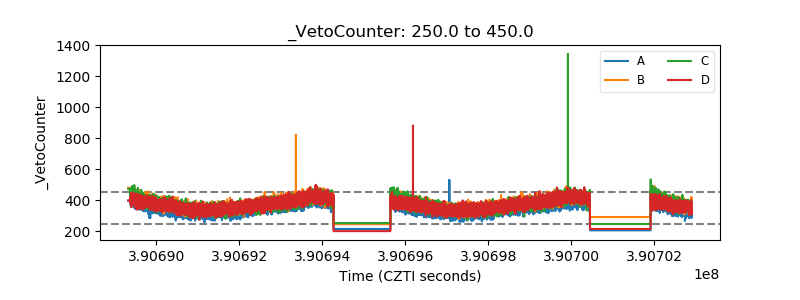 |