| Param | Original file | Final file |
|---|---|---|
| Filename | modeM0/AS1A11_080T01_9000005146_35902cztM0_level2.evt | modeM0/AS1A11_080T01_9000005146_35902cztM0_level2_quad_clean.evt |
| Size (bytes) | 477,967,680 | 73,445,760 |
| Size | 455.8 MB | 70.0 MB |
| Events in quadrant A | 3,077,789 | 485,783 |
| Events in quadrant B | 3,101,128 | 472,384 |
| Events in quadrant C | 3,025,869 | 472,679 |
| Events in quadrant D | 4,900,568 | 411,560 |
| Mode M9 | |||
|---|---|---|---|
| Quadrant | BADHDUFLAG | Total packets | Discarded packets |
| A | 0 | 38 | 0 |
| B | 0 | 38 | 0 |
| C | 0 | 38 | 0 |
| D | 0 | 38 | 0 |
| Mode SS | |||
|---|---|---|---|
| Quadrant | BADHDUFLAG | Total packets | Discarded packets |
| A | 0 | 114 | 0 |
| B | 0 | 114 | 0 |
| C | 0 | 114 | 0 |
| D | 0 | 114 | 0 |
| Mode M0 | |||
|---|---|---|---|
| Quadrant | BADHDUFLAG | Total packets | Discarded packets |
| A | 0 | 12351 | 3 |
| B | 0 | 12449 | 2 |
| C | 0 | 11941 | 2 |
| D | 0 | 18025 | 2 |
| Quadrant | Total seconds | Saturated seconds | Saturation percentage |
|---|---|---|---|
| A | 5445 | 12 | 0.220386% |
| B | 5445 | 135 | 2.479339% |
| C | 5445 | 112 | 2.056933% |
| D | 5445 | 704 | 12.929293% |
Noise dominated data is calculated using 1-second bins in cleaned event files. If a bin has >2000 counts, and if more than 50% of those come from <1% of pixels, then it is considered to be noise-dominated and hence unusable.
| Quadrant | # 1 sec bins | Bins with >0 counts | Bins with >2000 counts | High rate bins dominated by noise | Noise dominated (total time) | Noise dominated (detector-on time) | Marked lightcurve |
|---|---|---|---|---|---|---|---|
| A | 9300 | 5447 | 0 | 0 | 0.00% | 0.00% | 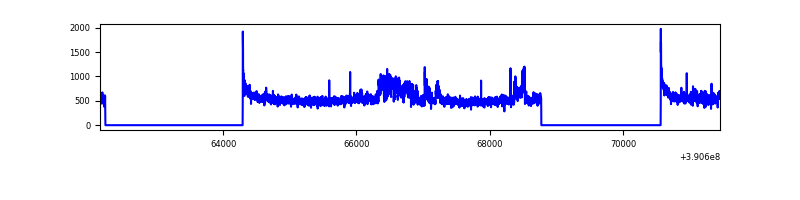 |
| B | 9300 | 5447 | 96 | 96 | 1.03% | 1.76% | 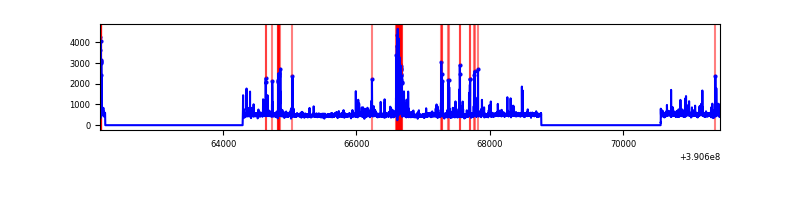 |
| C | 9300 | 5447 | 81 | 81 | 0.87% | 1.49% | 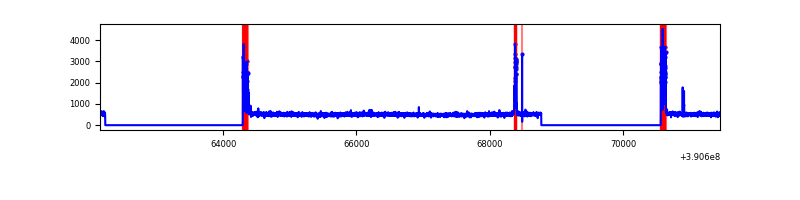 |
| D | 9300 | 5447 | 630 | 630 | 6.77% | 11.57% | 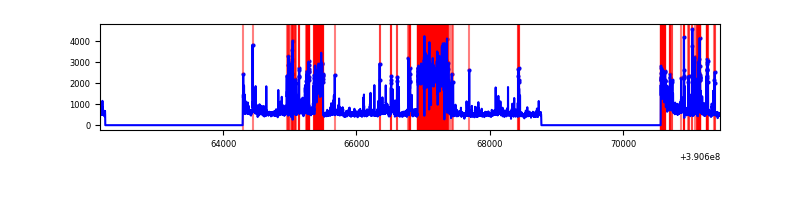 |
Top three noisy pixels from each quadrant. If the there are fewer than three noisy pixels in the level2.evt file, extra rows are filled as -1
| Pixel properties | Quadrant properties | ||||||
|---|---|---|---|---|---|---|---|
| Quadrant | DetID | PixID | Counts | Sigma | Mean | Median | Sigma |
| A | 15 | 169 | 328706 | 2446.57 | 663 | 653 | 134.1 |
| A | 10 | 83 | 169184 | 1256.88 | 663 | 653 | 134.1 |
| A | 10 | 255 | 9653 | 67.12 | 663 | 653 | 134.1 |
| B | 5 | 255 | 313271 | 2528.85 | 647 | 632 | 123.6 |
| B | 5 | 172 | 142743 | 1149.5 | 647 | 632 | 123.6 |
| B | 0 | 213 | 38156 | 303.52 | 647 | 632 | 123.6 |
| C | 0 | 10 | 251064 | 1695.68 | 634 | 641 | 147.7 |
| C | 15 | 214 | 228823 | 1545.08 | 634 | 641 | 147.7 |
| C | 9 | 69 | 72044 | 483.49 | 634 | 641 | 147.7 |
| D | 13 | 153 | 1196833 | 8057.07 | 602 | 586 | 148.5 |
| D | 12 | 128 | 356670 | 2398.33 | 602 | 586 | 148.5 |
| D | 8 | 195 | 249011 | 1673.21 | 602 | 586 | 148.5 |
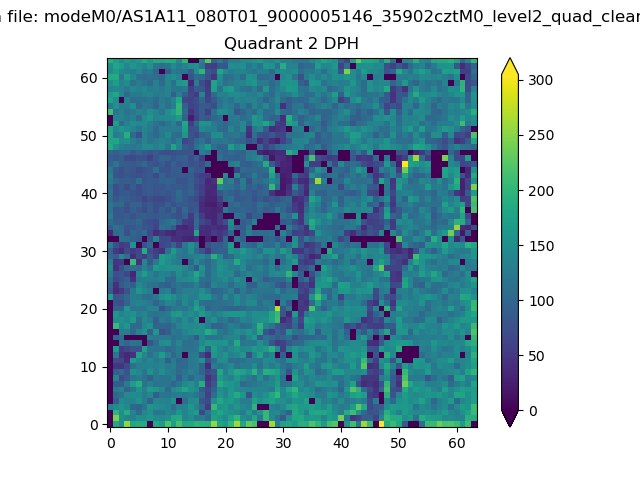
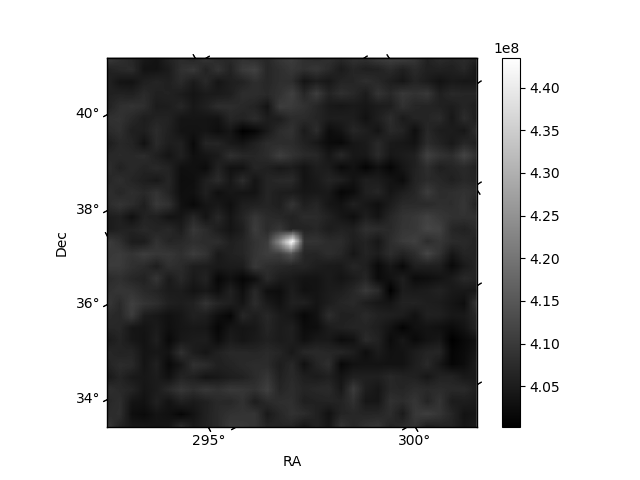
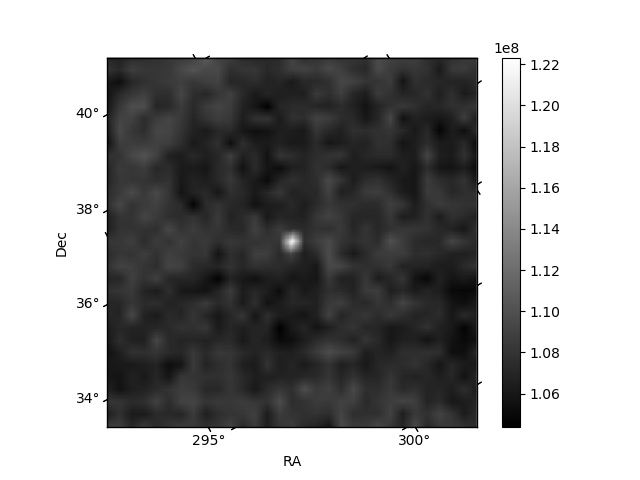
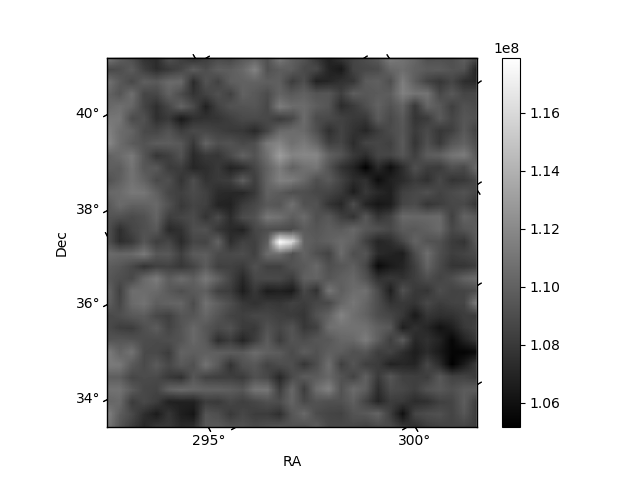
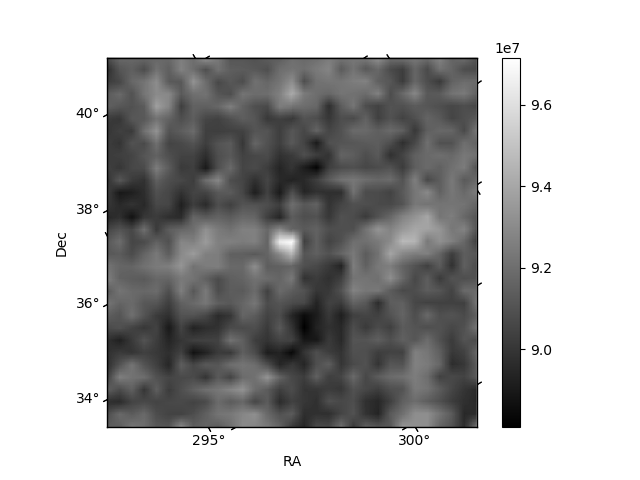
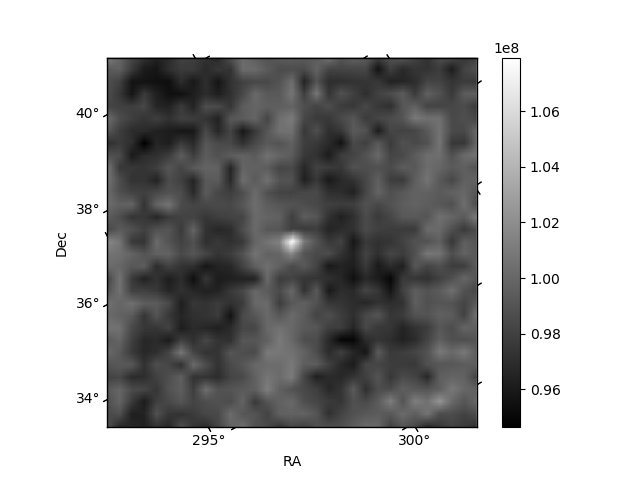
Histogram calculated using DETX and DETY for each event in the final _common_clean file
| Quadrant A | 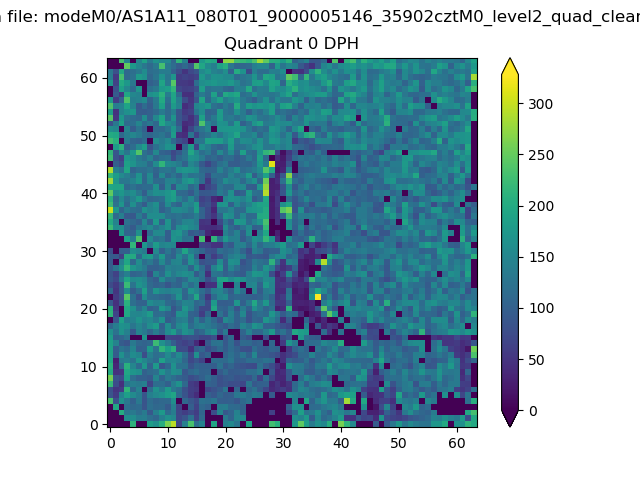 |
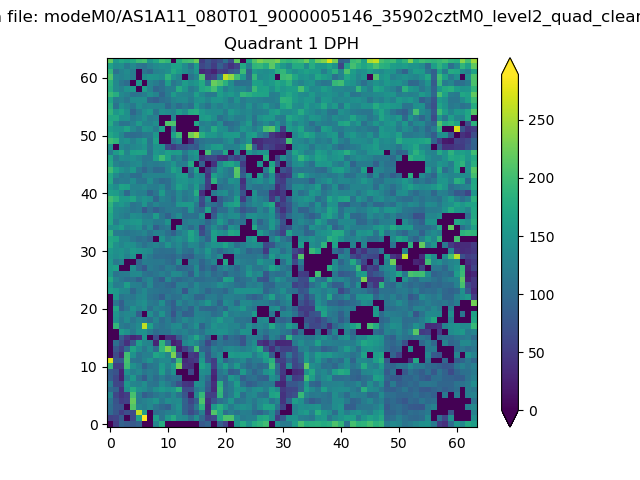 |
Quadrant B |
|---|---|---|---|
| Quadrant D | 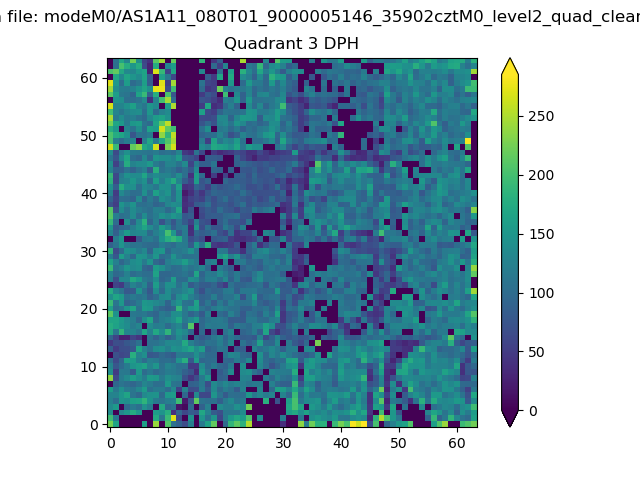 |
 |
Quadrant C |
| Plot type | Count rate plots | Images |
|---|---|---|
| Comparison with Poisson distribution Blue bars denote a histogram of data divided into 1 sec bins. Red curve is a Poisson curve with rate = median count rate of data. |
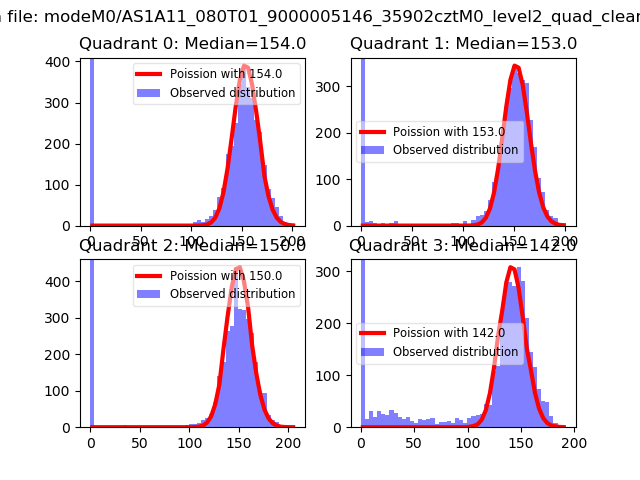 |
 |
| Quadrant-wise count rates Data is divided into 100 sec bins |
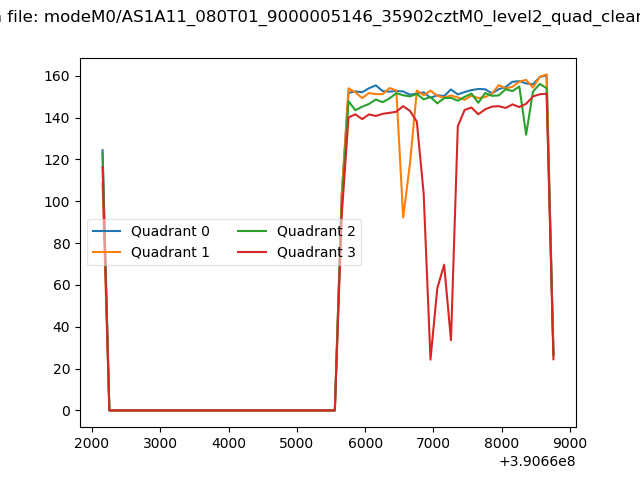 |
|
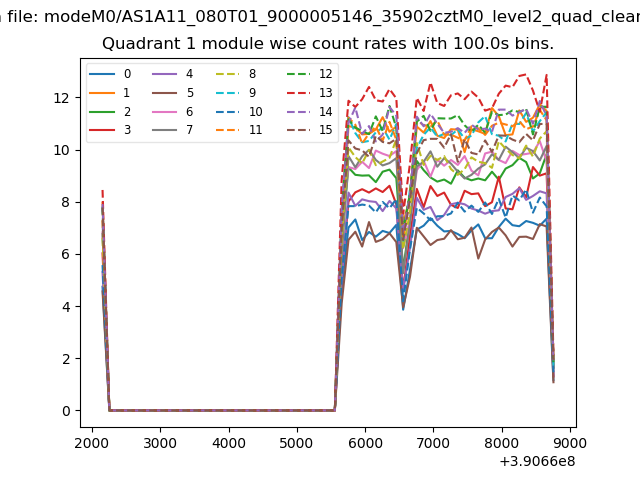
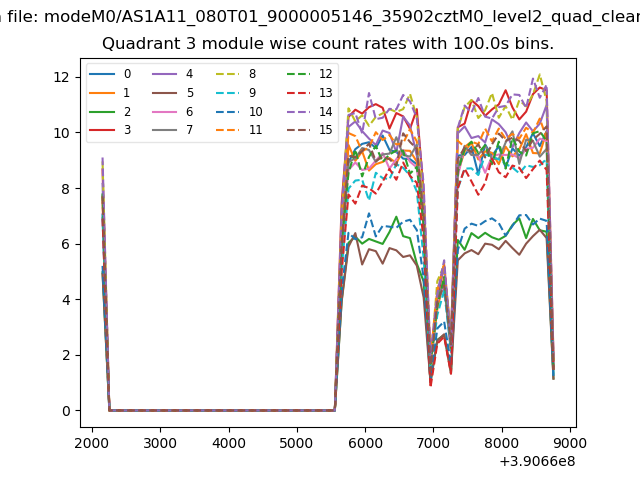
| Module-wise count rates for Quadrant A Data is divided into 100 sec bins |
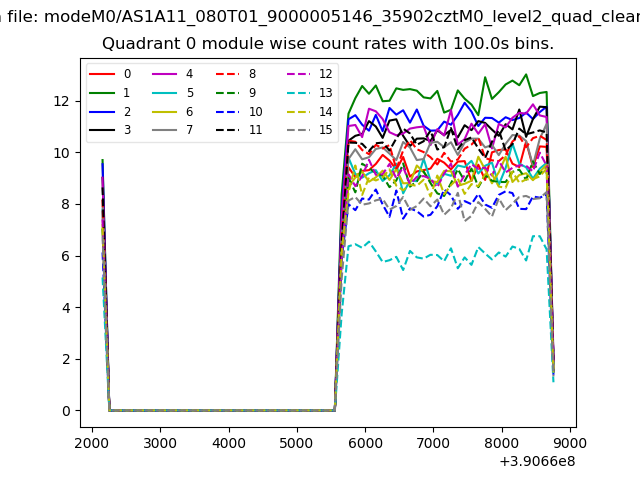 |
 |
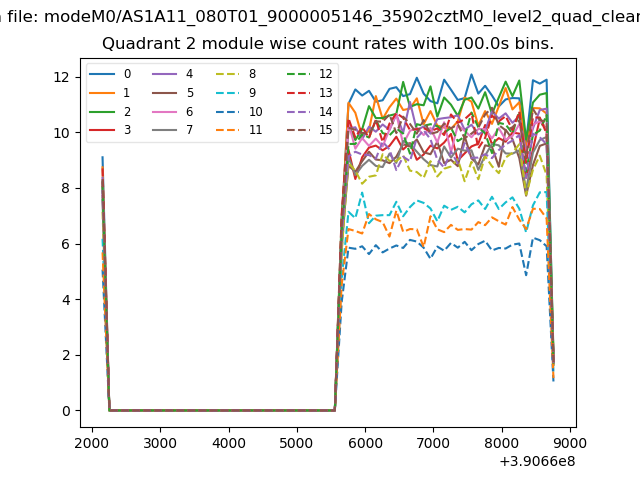
| Module-wise count rates for Quadrant B Data is divided into 100 sec bins |
 |
 |
| Module-wise count rates for Quadrant C Data is divided into 100 sec bins |
 |
 |
| Module-wise count rates for Quadrant D Data is divided into 100 sec bins |
 |
 |
| Parameter | Plot |
|---|---|
| CZT HV Monitor | 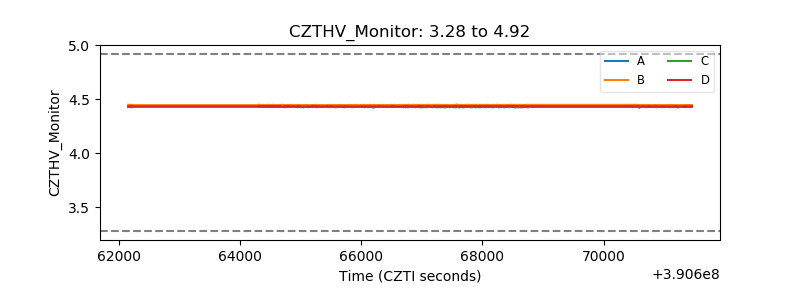 |
| D_VDD | 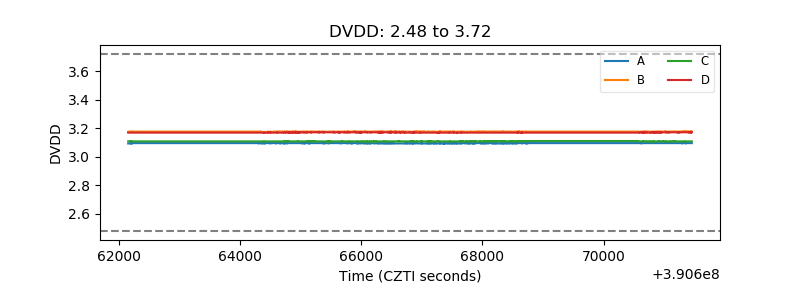 |
| Temperature 1 | 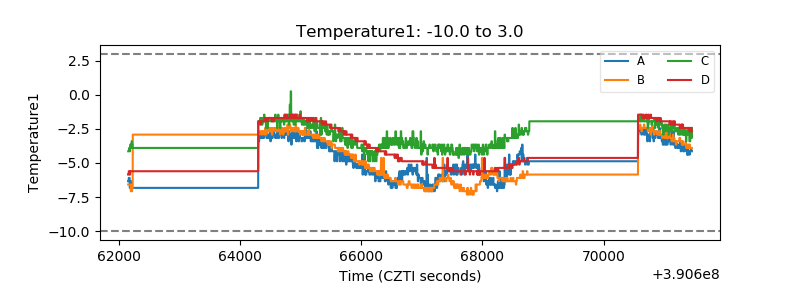 |
| Veto HV Monitor | 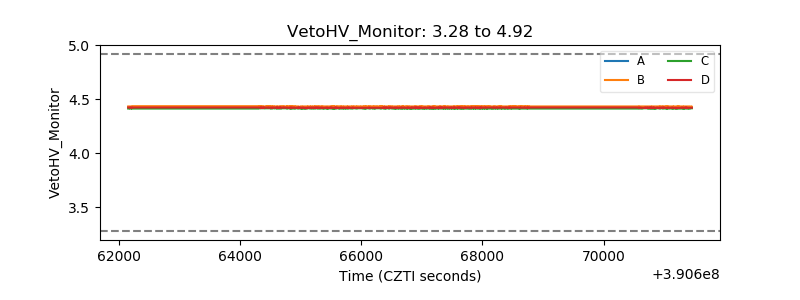 |
| Veto LLD | 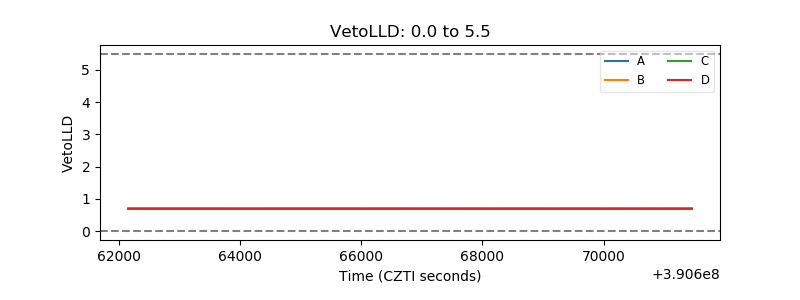 |
| Alpha Counter | 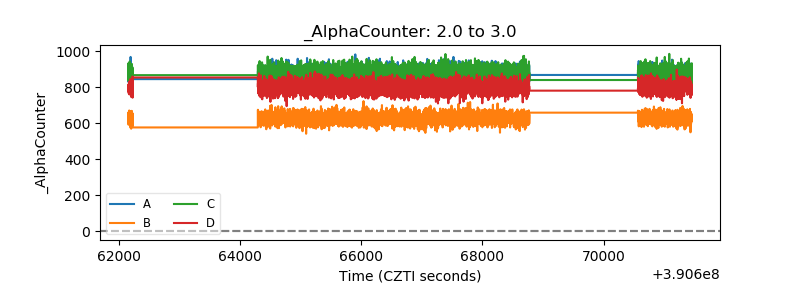 |
| _CPM_Rate | 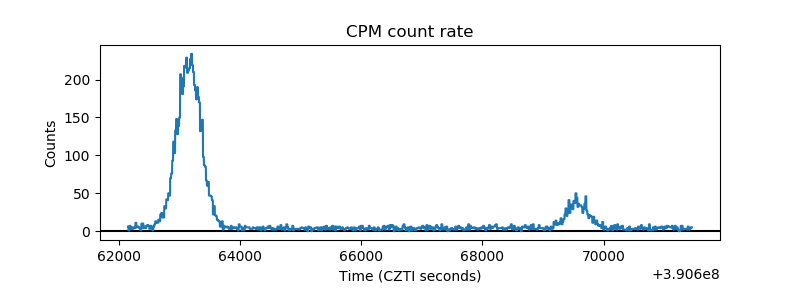 |
| CZT Counter | 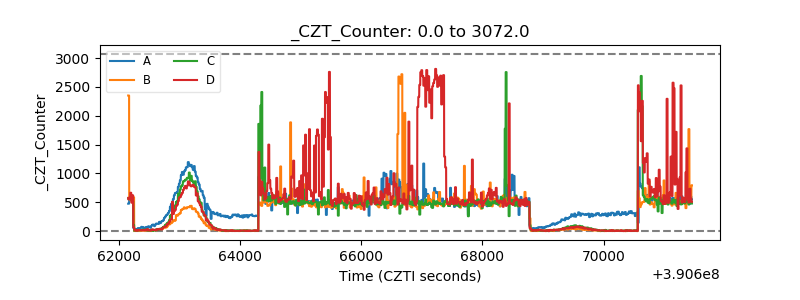 |
| +2.5 Volts monitor | 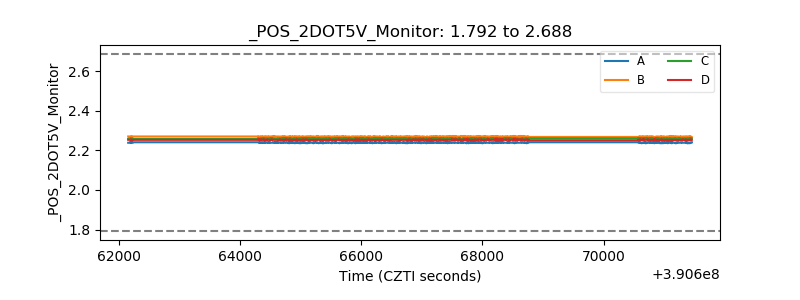 |
| +5 Volts monitor | 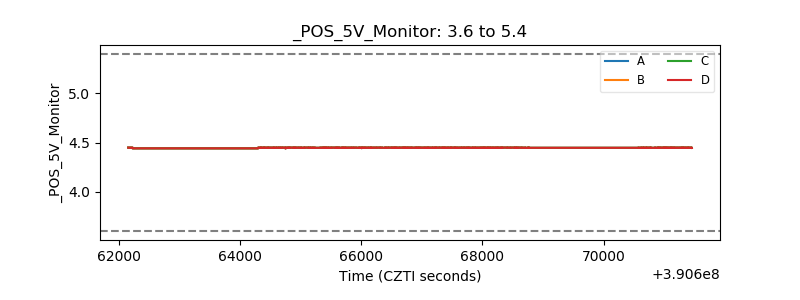 |
| _ROLL_ROT | 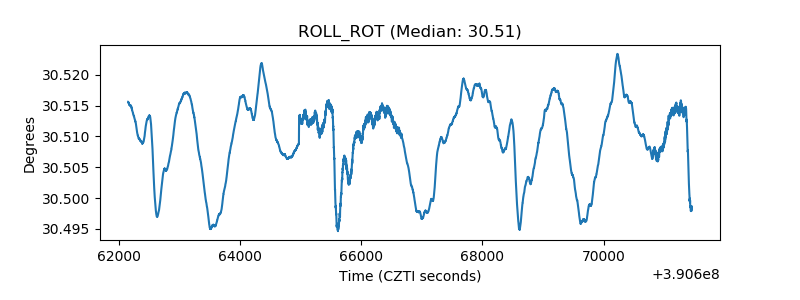 |
| _Roll_DEC | 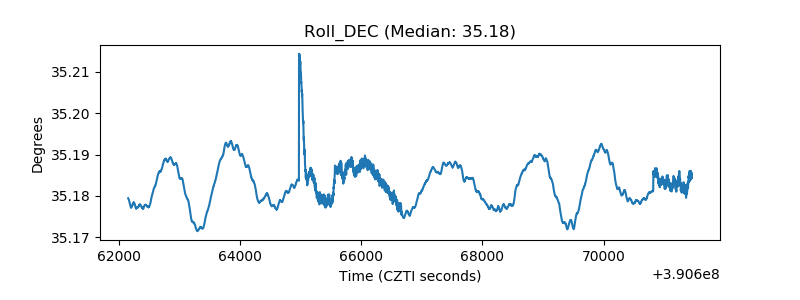 |
| _Roll_RA | 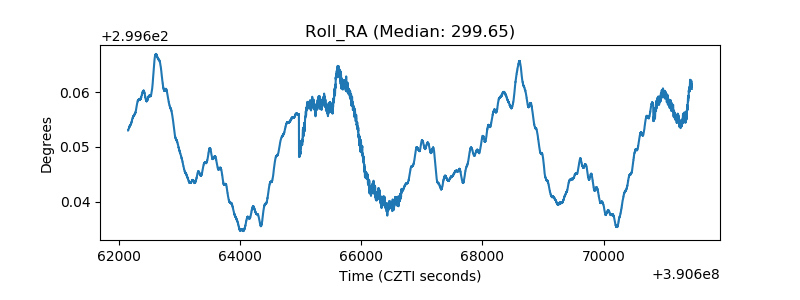 |
| Veto Counter | 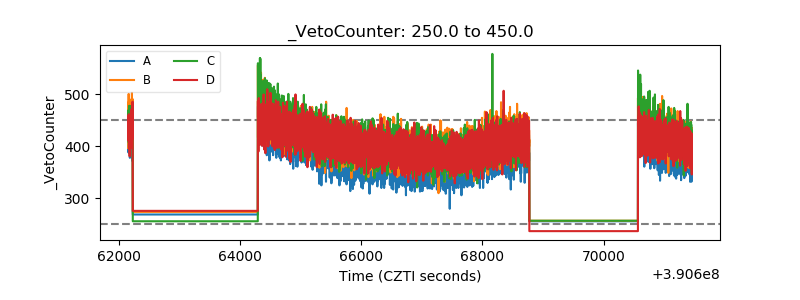 |