| Param | Original file | Final file |
|---|---|---|
| Filename | modeM0/AS1A11_080T01_9000005146_35899cztM0_level2.evt | modeM0/AS1A11_080T01_9000005146_35899cztM0_level2_quad_clean.evt |
| Size (bytes) | 467,334,720 | 64,140,480 |
| Size | 445.7 MB | 61.2 MB |
| Events in quadrant A | 3,334,095 | 404,359 |
| Events in quadrant B | 3,220,252 | 406,323 |
| Events in quadrant C | 3,143,495 | 384,901 |
| Events in quadrant D | 4,096,583 | 375,657 |
| Mode M9 | |||
|---|---|---|---|
| Quadrant | BADHDUFLAG | Total packets | Discarded packets |
| A | 0 | 28 | 0 |
| B | 0 | 28 | 0 |
| C | 0 | 28 | 0 |
| D | 0 | 29 | 0 |
| Mode SS | |||
|---|---|---|---|
| Quadrant | BADHDUFLAG | Total packets | Discarded packets |
| A | 0 | 108 | 0 |
| B | 0 | 108 | 0 |
| C | 0 | 108 | 0 |
| D | 0 | 108 | 0 |
| Mode M0 | |||
|---|---|---|---|
| Quadrant | BADHDUFLAG | Total packets | Discarded packets |
| A | 0 | 13036 | 3 |
| B | 0 | 12702 | 2 |
| C | 0 | 12240 | 2 |
| D | 0 | 15994 | 2 |
| Quadrant | Total seconds | Saturated seconds | Saturation percentage |
|---|---|---|---|
| A | 5294 | 45 | 0.850019% |
| B | 5294 | 80 | 1.511145% |
| C | 5294 | 109 | 2.058935% |
| D | 5294 | 126 | 2.380053% |
Noise dominated data is calculated using 1-second bins in cleaned event files. If a bin has >2000 counts, and if more than 50% of those come from <1% of pixels, then it is considered to be noise-dominated and hence unusable.
| Quadrant | # 1 sec bins | Bins with >0 counts | Bins with >2000 counts | High rate bins dominated by noise | Noise dominated (total time) | Noise dominated (detector-on time) | Marked lightcurve |
|---|---|---|---|---|---|---|---|
| A | 7387 | 5295 | 31 | 31 | 0.42% | 0.59% | 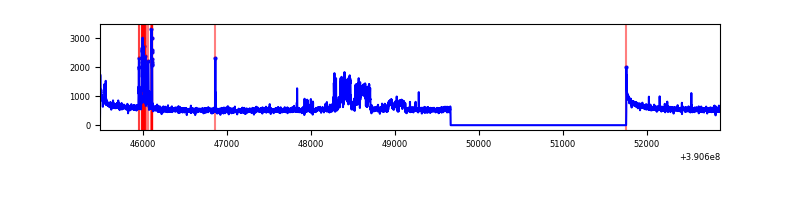 |
| B | 7387 | 5295 | 36 | 36 | 0.49% | 0.68% | 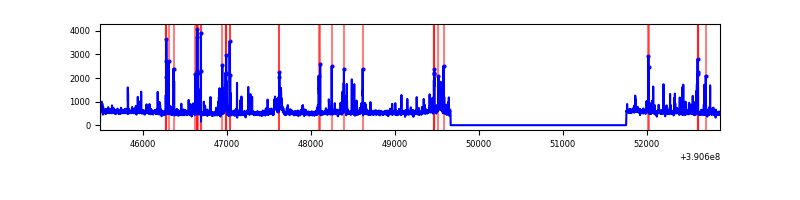 |
| C | 7387 | 5295 | 79 | 79 | 1.07% | 1.49% | 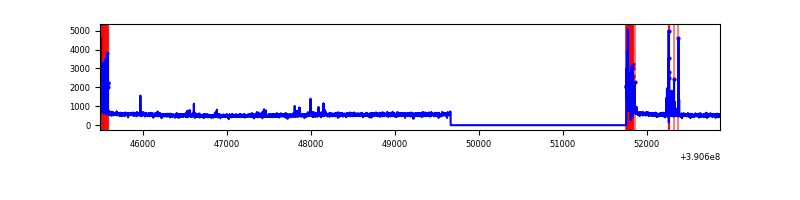 |
| D | 7387 | 5295 | 123 | 123 | 1.67% | 2.32% | 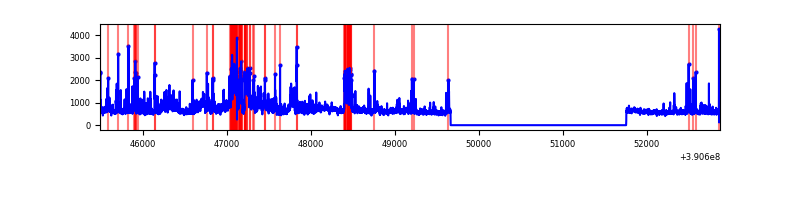 |
Top three noisy pixels from each quadrant. If the there are fewer than three noisy pixels in the level2.evt file, extra rows are filled as -1
| Pixel properties | Quadrant properties | ||||||
|---|---|---|---|---|---|---|---|
| Quadrant | DetID | PixID | Counts | Sigma | Mean | Median | Sigma |
| A | 15 | 169 | 389347 | 2730.88 | 713 | 705 | 142.3 |
| A | 10 | 83 | 164213 | 1148.93 | 713 | 705 | 142.3 |
| A | 7 | 3 | 13317 | 88.62 | 713 | 705 | 142.3 |
| B | 5 | 172 | 262353 | 2021.78 | 693 | 678 | 129.4 |
| B | 5 | 255 | 159548 | 1227.48 | 693 | 678 | 129.4 |
| B | 0 | 213 | 32012 | 242.1 | 693 | 678 | 129.4 |
| C | 0 | 10 | 253389 | 1659.61 | 668 | 676 | 152.3 |
| C | 15 | 214 | 223646 | 1464.28 | 668 | 676 | 152.3 |
| C | 9 | 69 | 32078 | 206.22 | 668 | 676 | 152.3 |
| D | 12 | 227 | 528628 | 3192.63 | 680 | 663 | 165.4 |
| D | 8 | 195 | 436731 | 2636.92 | 680 | 663 | 165.4 |
| D | 7 | 223 | 155157 | 934.23 | 680 | 663 | 165.4 |
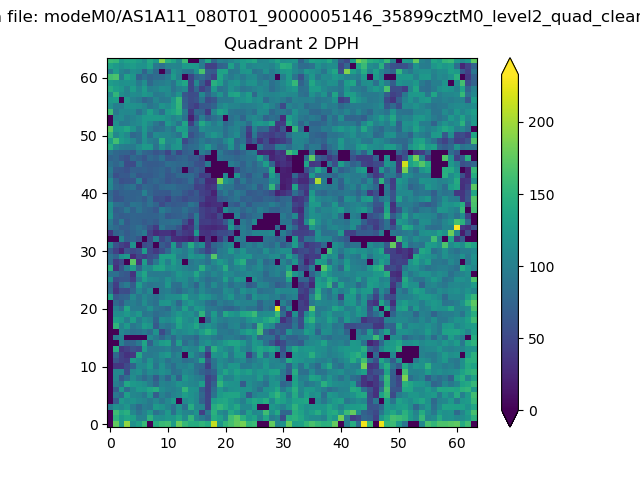
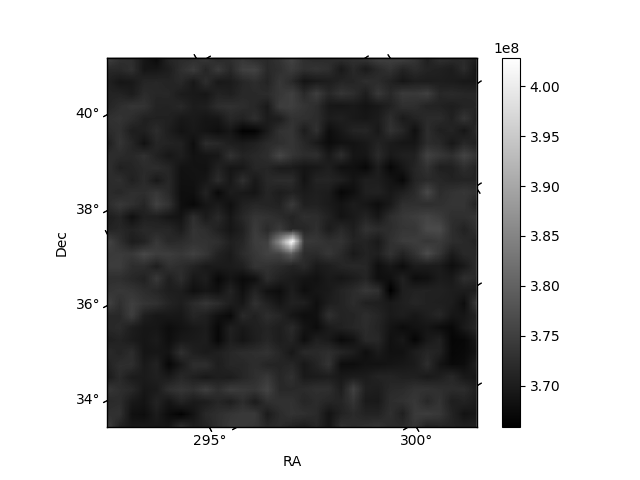
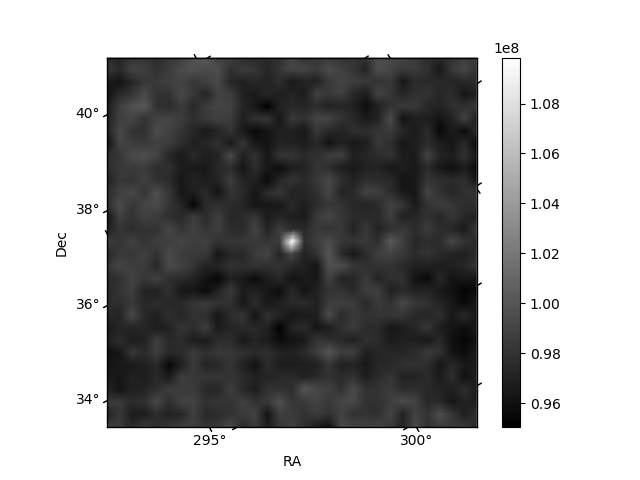
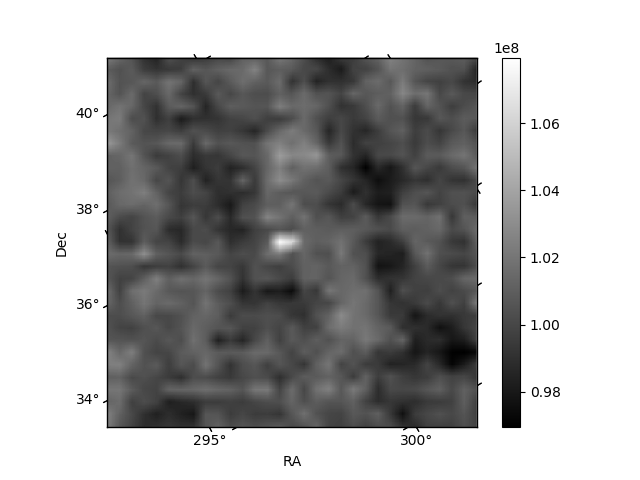
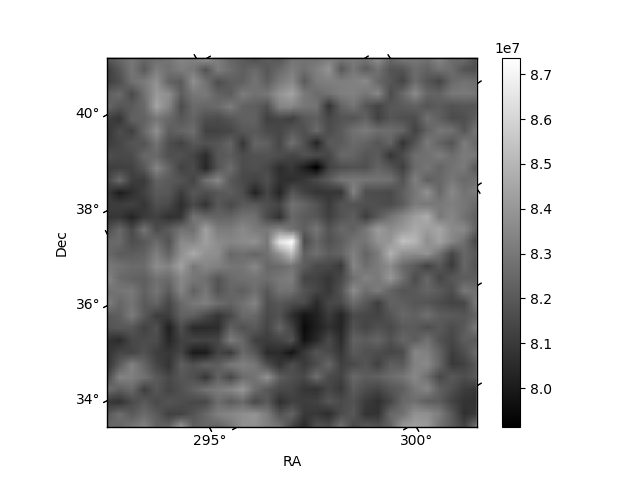
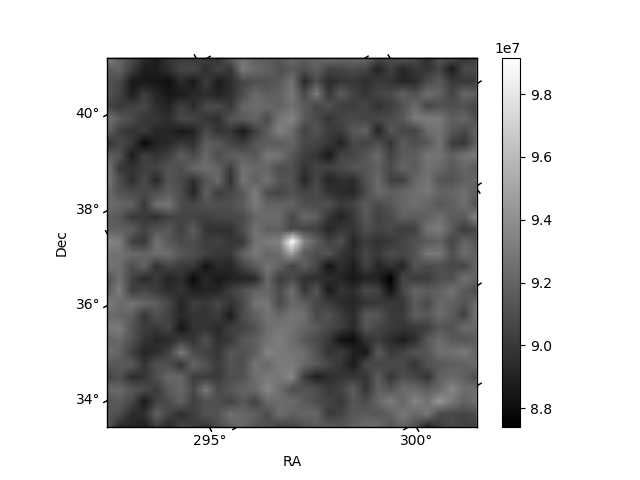
Histogram calculated using DETX and DETY for each event in the final _common_clean file
| Quadrant A | 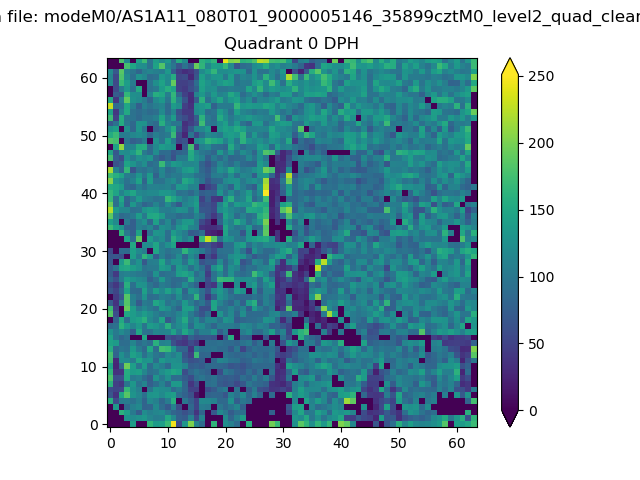 |
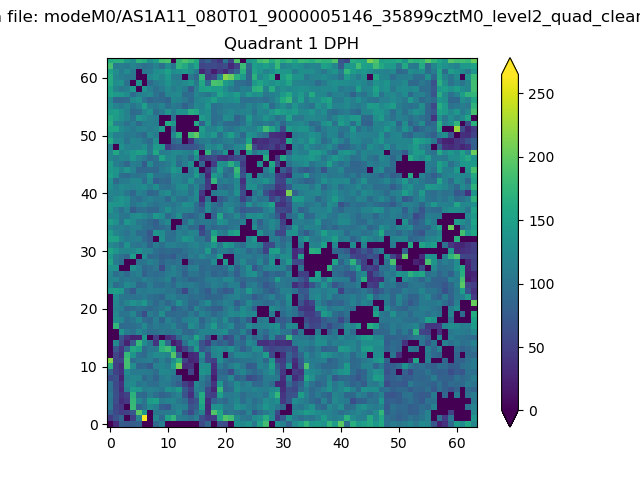 |
Quadrant B |
|---|---|---|---|
| Quadrant D | 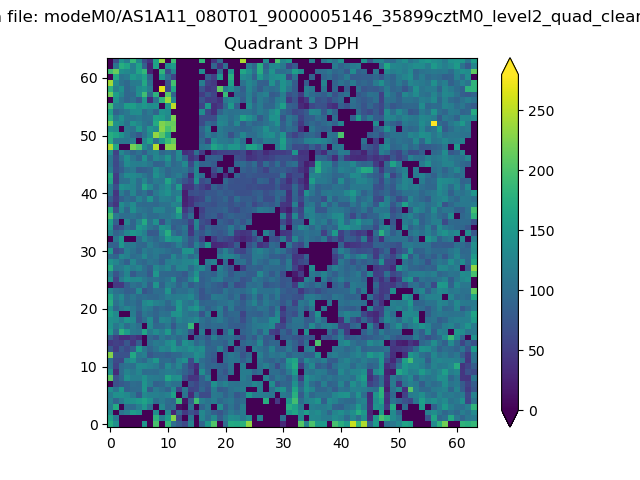 |
 |
Quadrant C |
| Plot type | Count rate plots | Images |
|---|---|---|
| Comparison with Poisson distribution Blue bars denote a histogram of data divided into 1 sec bins. Red curve is a Poisson curve with rate = median count rate of data. |
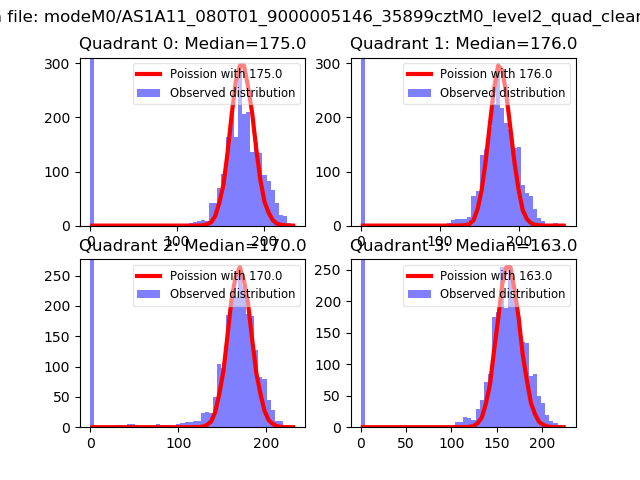 |
 |
| Quadrant-wise count rates Data is divided into 100 sec bins |
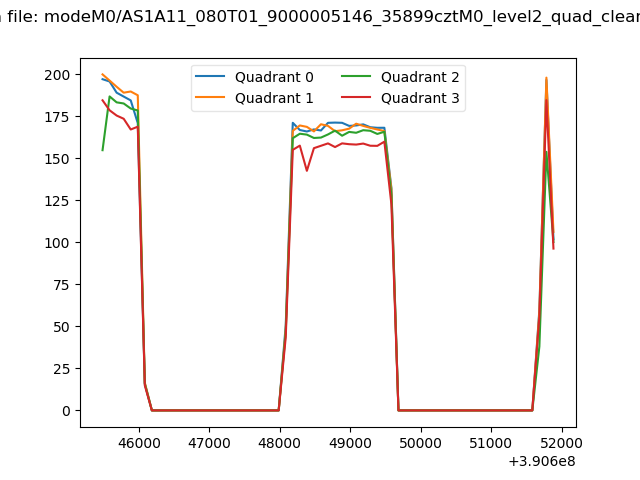 |
|
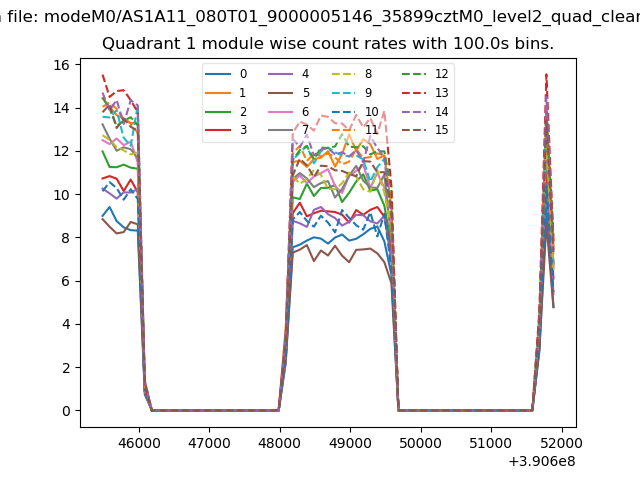
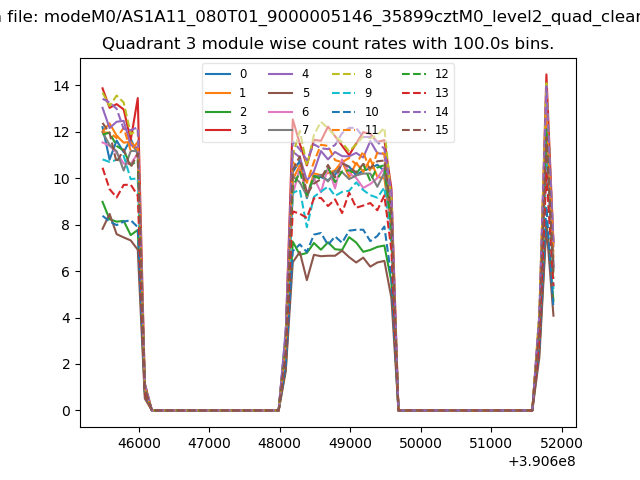
| Module-wise count rates for Quadrant A Data is divided into 100 sec bins |
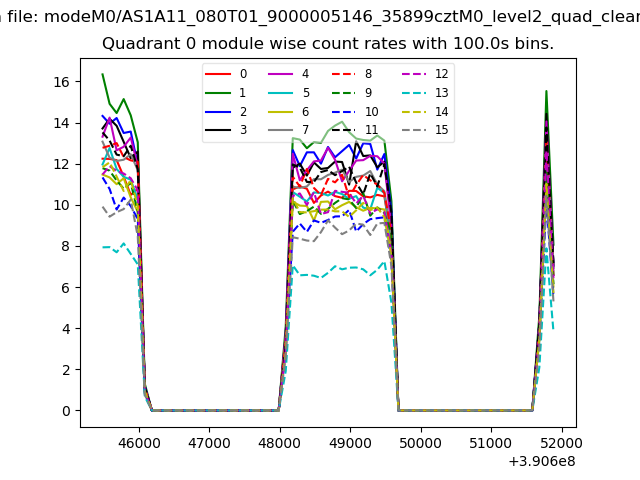 |
 |
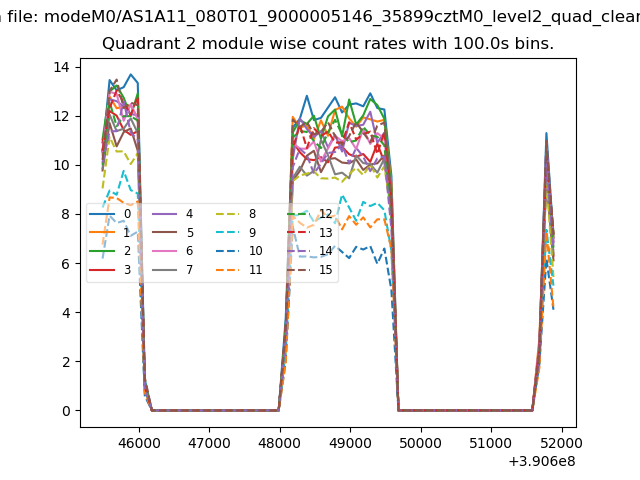
| Module-wise count rates for Quadrant B Data is divided into 100 sec bins |
 |
 |
| Module-wise count rates for Quadrant C Data is divided into 100 sec bins |
 |
 |
| Module-wise count rates for Quadrant D Data is divided into 100 sec bins |
 |
 |
| Parameter | Plot |
|---|---|
| CZT HV Monitor | 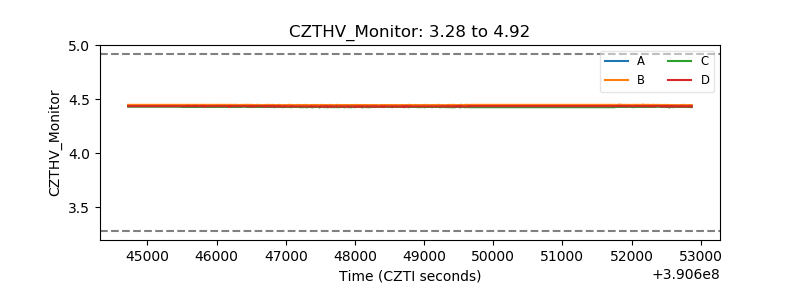 |
| D_VDD | 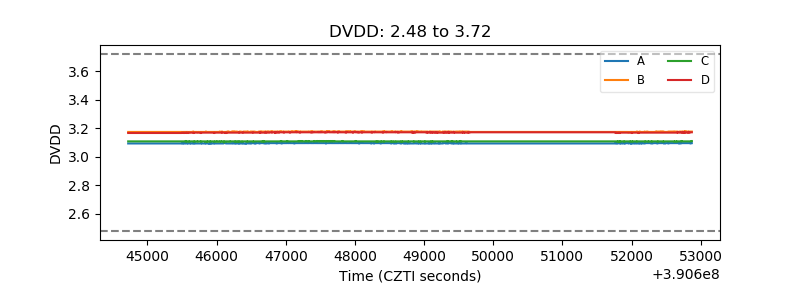 |
| Temperature 1 | 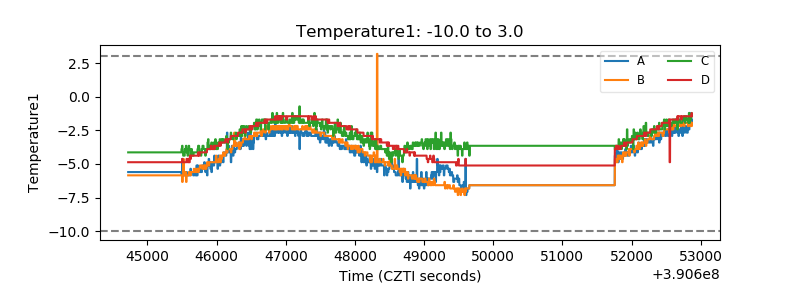 |
| Veto HV Monitor | 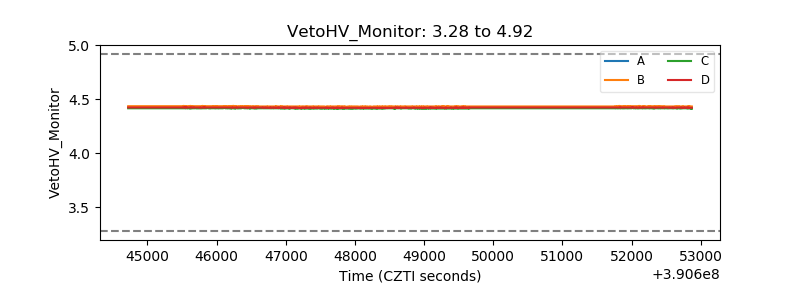 |
| Veto LLD | 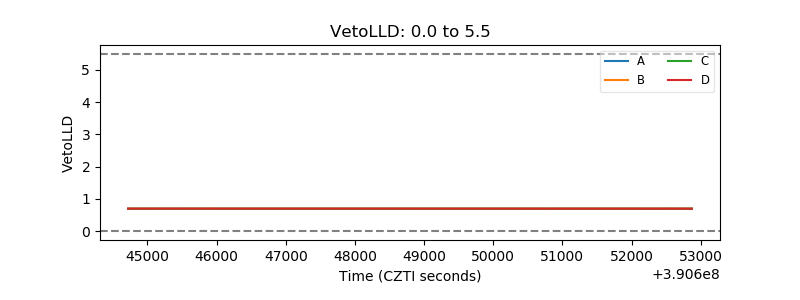 |
| Alpha Counter | 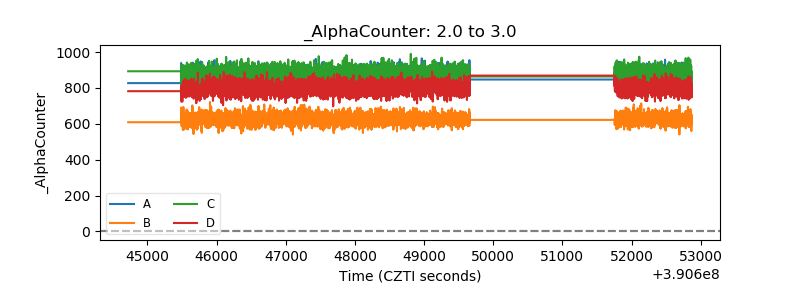 |
| _CPM_Rate | 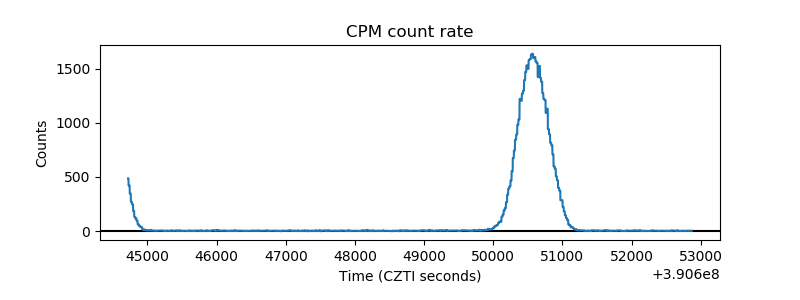 |
| CZT Counter | 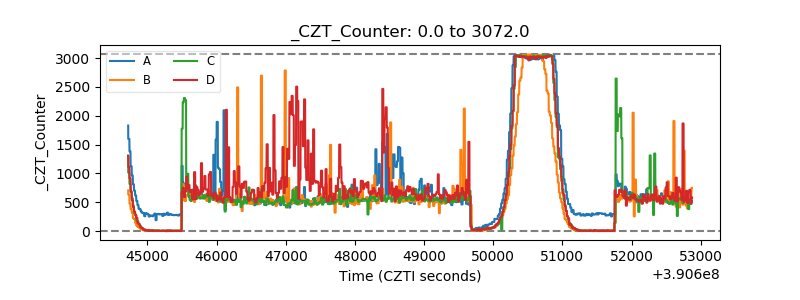 |
| +2.5 Volts monitor | 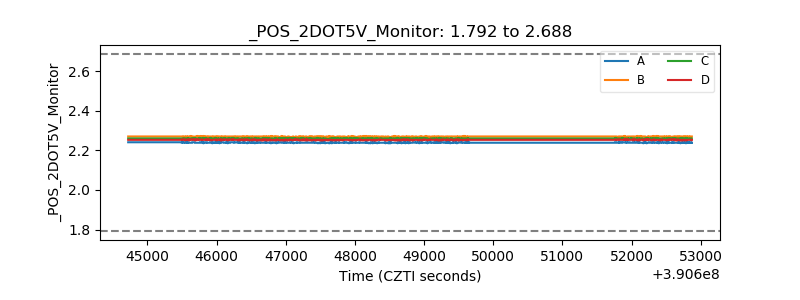 |
| +5 Volts monitor | 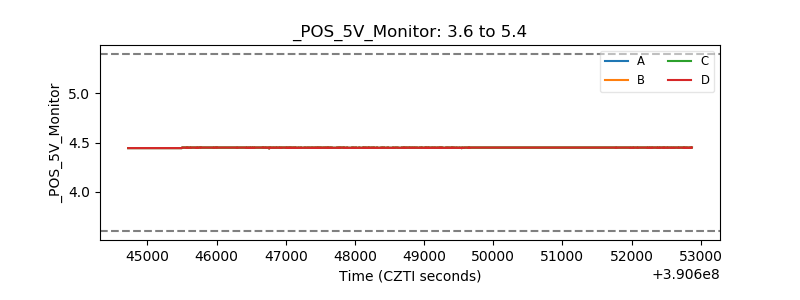 |
| _ROLL_ROT | 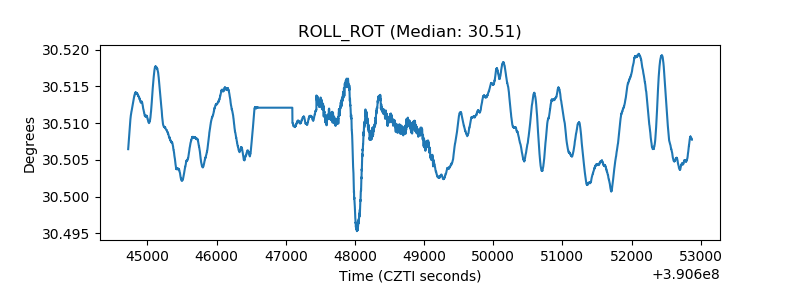 |
| _Roll_DEC | 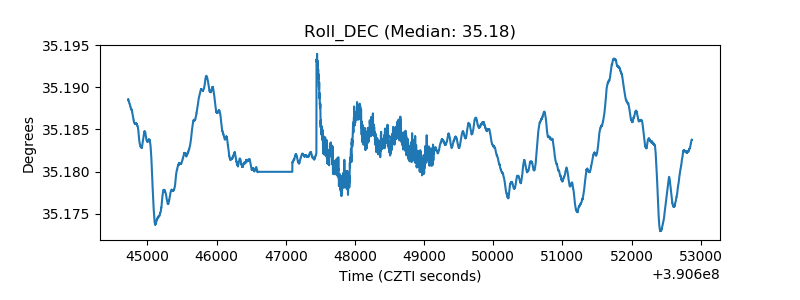 |
| _Roll_RA | 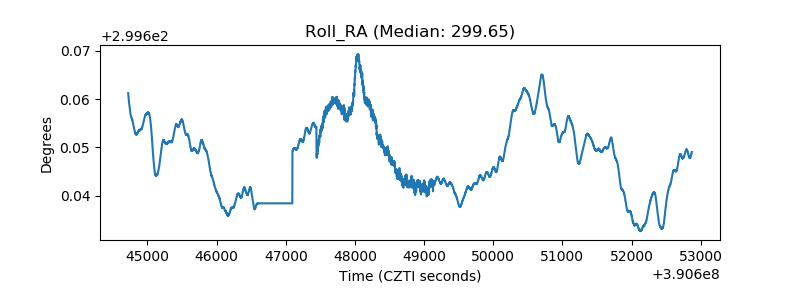 |
| Veto Counter | 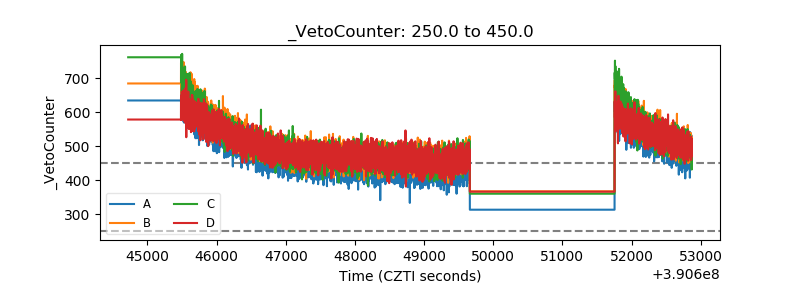 |