| Param | Original file | Final file |
|---|---|---|
| Filename | modeM0/AS1A11_080T01_9000005146_35897cztM0_level2.evt | modeM0/AS1A11_080T01_9000005146_35897cztM0_level2_quad_clean.evt |
| Size (bytes) | 506,039,040 | 80,000,640 |
| Size | 482.6 MB | 76.3 MB |
| Events in quadrant A | 2,766,855 | 536,513 |
| Events in quadrant B | 2,871,744 | 537,835 |
| Events in quadrant C | 2,990,379 | 513,697 |
| Events in quadrant D | 6,341,288 | 467,283 |
| Mode M9 | |||
|---|---|---|---|
| Quadrant | BADHDUFLAG | Total packets | Discarded packets |
| A | 0 | 19 | 0 |
| B | 0 | 18 | 0 |
| C | 0 | 19 | 0 |
| D | 0 | 20 | 0 |
| Mode SS | |||
|---|---|---|---|
| Quadrant | BADHDUFLAG | Total packets | Discarded packets |
| A | 0 | 108 | 0 |
| B | 0 | 107 | 0 |
| C | 0 | 108 | 0 |
| D | 0 | 108 | 0 |
| Mode M0 | |||
|---|---|---|---|
| Quadrant | BADHDUFLAG | Total packets | Discarded packets |
| A | 0 | 11319 | 70 |
| B | 0 | 11704 | 104 |
| C | 0 | 11950 | 101 |
| D | 0 | 22747 | 296 |
| Quadrant | Total seconds | Saturated seconds | Saturation percentage |
|---|---|---|---|
| A | 5256 | 6 | 0.114155% |
| B | 5239 | 28 | 0.534453% |
| C | 5242 | 86 | 1.640595% |
| D | 5218 | 992 | 19.011115% |
Noise dominated data is calculated using 1-second bins in cleaned event files. If a bin has >2000 counts, and if more than 50% of those come from <1% of pixels, then it is considered to be noise-dominated and hence unusable.
| Quadrant | # 1 sec bins | Bins with >0 counts | Bins with >2000 counts | High rate bins dominated by noise | Noise dominated (total time) | Noise dominated (detector-on time) | Marked lightcurve |
|---|---|---|---|---|---|---|---|
| A | 7212 | 5287 | 0 | 0 | 0.00% | 0.00% |  |
| B | 7212 | 5279 | 17 | 17 | 0.24% | 0.32% |  |
| C | 7212 | 5276 | 68 | 68 | 0.94% | 1.29% |  |
| D | 7212 | 5277 | 895 | 895 | 12.41% | 16.96% |  |
Top three noisy pixels from each quadrant. If the there are fewer than three noisy pixels in the level2.evt file, extra rows are filled as -1
| Pixel properties | Quadrant properties | ||||||
|---|---|---|---|---|---|---|---|
| Quadrant | DetID | PixID | Counts | Sigma | Mean | Median | Sigma |
| A | 10 | 83 | 163416 | 1208.21 | 669 | 660 | 134.7 |
| A | 13 | 254 | 8920 | 61.32 | 669 | 660 | 134.7 |
| A | 3 | 137 | 6392 | 42.55 | 669 | 660 | 134.7 |
| B | 5 | 172 | 120501 | 957.12 | 654 | 640 | 125.2 |
| B | 0 | 213 | 73425 | 581.21 | 654 | 640 | 125.2 |
| B | 5 | 255 | 58909 | 465.29 | 654 | 640 | 125.2 |
| C | 0 | 10 | 257689 | 1776.05 | 629 | 635 | 144.7 |
| C | 15 | 214 | 219521 | 1512.34 | 629 | 635 | 144.7 |
| C | 0 | 207 | 57794 | 394.93 | 629 | 635 | 144.7 |
| D | 12 | 227 | 1622568 | 11167.43 | 583 | 567 | 145.2 |
| D | 10 | 118 | 1321604 | 9095.3 | 583 | 567 | 145.2 |
| D | 2 | 250 | 416536 | 2863.94 | 583 | 567 | 145.2 |
Histogram calculated using DETX and DETY for each event in the final _common_clean file
| Quadrant A |  |
 |
Quadrant B |
|---|---|---|---|
| Quadrant D |  |
 |
Quadrant C |
| Plot type | Count rate plots | Images |
|---|---|---|
| Comparison with Poisson distribution Blue bars denote a histogram of data divided into 1 sec bins. Red curve is a Poisson curve with rate = median count rate of data. |
 |
 |
| Quadrant-wise count rates Data is divided into 100 sec bins |
 |
|
| Module-wise count rates for Quadrant A Data is divided into 100 sec bins |
 |
 |
| Module-wise count rates for Quadrant B Data is divided into 100 sec bins |
 |
 |
| Module-wise count rates for Quadrant C Data is divided into 100 sec bins |
 |
 |
| Module-wise count rates for Quadrant D Data is divided into 100 sec bins |
 |
 |
| Parameter | Plot |
|---|---|
| CZT HV Monitor |  |
| D_VDD |  |
| Temperature 1 |  |
| Veto HV Monitor |  |
| Veto LLD | 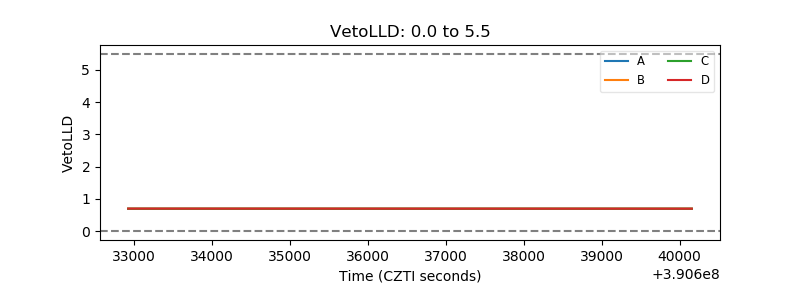 |
| Alpha Counter |  |
| _CPM_Rate |  |
| CZT Counter |  |
| +2.5 Volts monitor |  |
| +5 Volts monitor |  |
| _ROLL_ROT |  |
| _Roll_DEC |  |
| _Roll_RA |  |
| Veto Counter |  |