| Param | Original file | Final file |
|---|---|---|
| Filename | modeM0/AS1A11_080T01_9000005146_35896cztM0_level2.evt | modeM0/AS1A11_080T01_9000005146_35896cztM0_level2_quad_clean.evt |
| Size (bytes) | 441,993,600 | 81,584,640 |
| Size | 421.5 MB | 77.8 MB |
| Events in quadrant A | 2,774,735 | 539,502 |
| Events in quadrant B | 3,105,380 | 535,873 |
| Events in quadrant C | 3,032,195 | 521,430 |
| Events in quadrant D | 4,098,671 | 487,327 |
| Mode M9 | |||
|---|---|---|---|
| Quadrant | BADHDUFLAG | Total packets | Discarded packets |
| A | 0 | 18 | 0 |
| B | 0 | 18 | 0 |
| C | 0 | 18 | 0 |
| D | 0 | 19 | 0 |
| Mode SS | |||
|---|---|---|---|
| Quadrant | BADHDUFLAG | Total packets | Discarded packets |
| A | 0 | 112 | 0 |
| B | 0 | 112 | 0 |
| C | 0 | 112 | 0 |
| D | 0 | 112 | 0 |
| Mode M0 | |||
|---|---|---|---|
| Quadrant | BADHDUFLAG | Total packets | Discarded packets |
| A | 0 | 11552 | 28 |
| B | 0 | 12738 | 38 |
| C | 0 | 12309 | 33 |
| D | 0 | 15891 | 82 |
| Quadrant | Total seconds | Saturated seconds | Saturation percentage |
|---|---|---|---|
| A | 5530 | 7 | 0.126582% |
| B | 5522 | 89 | 1.611735% |
| C | 5529 | 63 | 1.139447% |
| D | 5517 | 162 | 2.936378% |
Noise dominated data is calculated using 1-second bins in cleaned event files. If a bin has >2000 counts, and if more than 50% of those come from <1% of pixels, then it is considered to be noise-dominated and hence unusable.
| Quadrant | # 1 sec bins | Bins with >0 counts | Bins with >2000 counts | High rate bins dominated by noise | Noise dominated (total time) | Noise dominated (detector-on time) | Marked lightcurve |
|---|---|---|---|---|---|---|---|
| A | 7302 | 5538 | 0 | 0 | 0.00% | 0.00% | 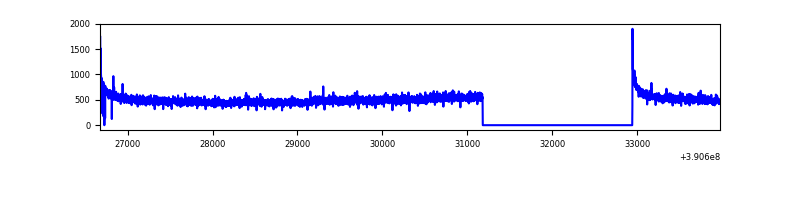 |
| B | 7302 | 5534 | 54 | 54 | 0.74% | 0.98% | 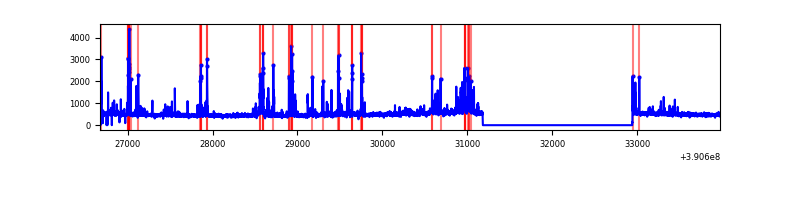 |
| C | 7302 | 5539 | 54 | 54 | 0.74% | 0.97% | 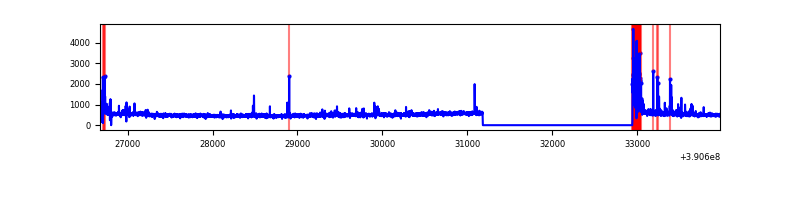 |
| D | 7302 | 5532 | 178 | 178 | 2.44% | 3.22% | 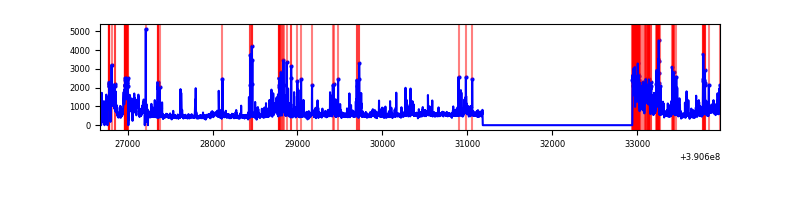 |
Top three noisy pixels from each quadrant. If the there are fewer than three noisy pixels in the level2.evt file, extra rows are filled as -1
| Pixel properties | Quadrant properties | ||||||
|---|---|---|---|---|---|---|---|
| Quadrant | DetID | PixID | Counts | Sigma | Mean | Median | Sigma |
| A | 10 | 83 | 166733 | 1223.3 | 672 | 662 | 135.8 |
| A | 13 | 254 | 8369 | 56.77 | 672 | 662 | 135.8 |
| A | 10 | 255 | 7515 | 50.48 | 672 | 662 | 135.8 |
| B | 5 | 172 | 249641 | 1981.01 | 658 | 644 | 125.7 |
| B | 5 | 255 | 234576 | 1861.15 | 658 | 644 | 125.7 |
| B | 0 | 213 | 16607 | 127.0 | 658 | 644 | 125.7 |
| C | 15 | 214 | 234826 | 1573.89 | 639 | 645 | 148.8 |
| C | 0 | 10 | 197526 | 1323.2 | 639 | 645 | 148.8 |
| C | 0 | 207 | 105574 | 705.21 | 639 | 645 | 148.8 |
| D | 12 | 227 | 787639 | 5007.98 | 635 | 618 | 157.2 |
| D | 13 | 249 | 308885 | 1961.57 | 635 | 618 | 157.2 |
| D | 8 | 195 | 161490 | 1023.66 | 635 | 618 | 157.2 |
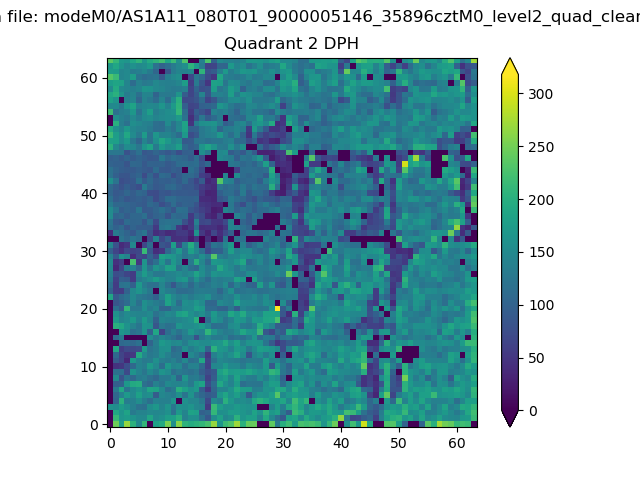
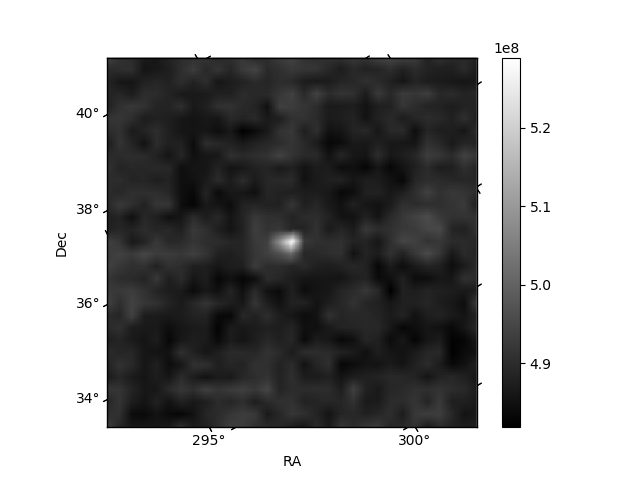
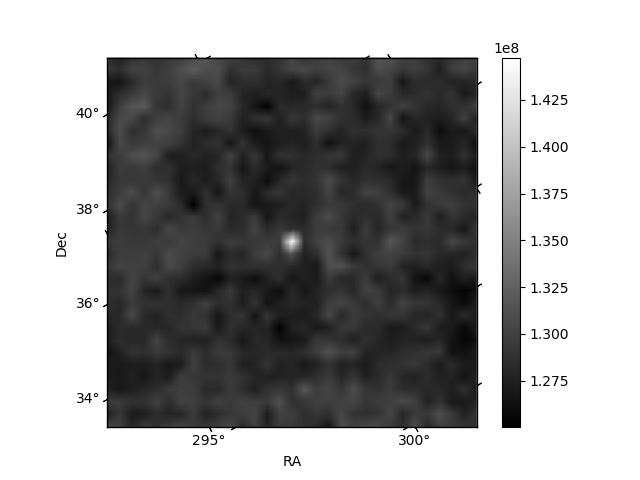
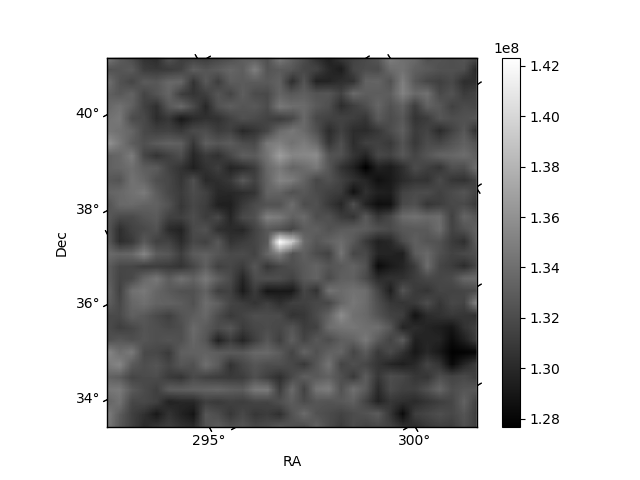
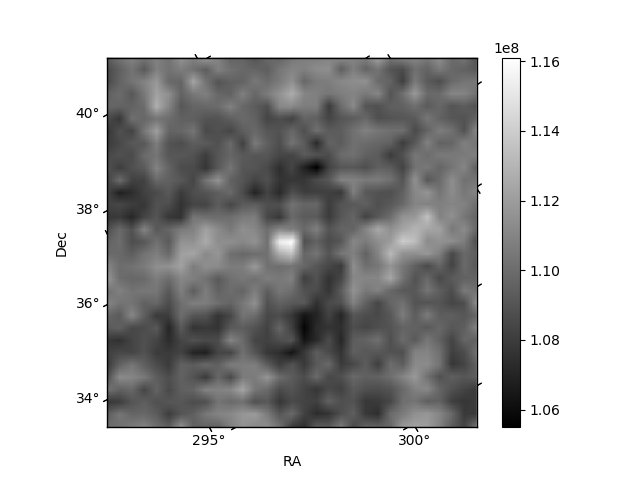
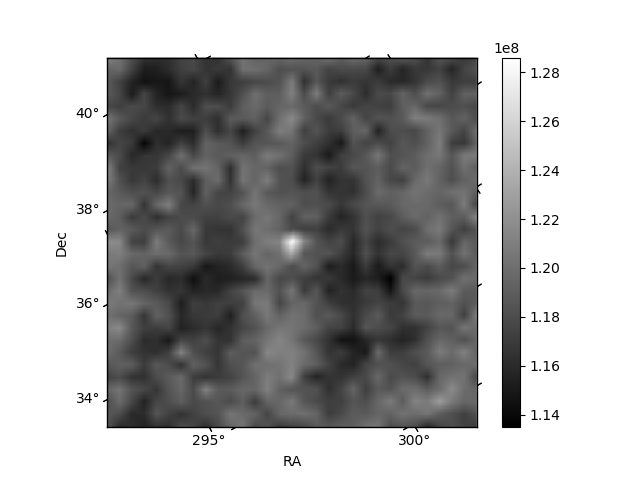
Histogram calculated using DETX and DETY for each event in the final _common_clean file
| Quadrant A | 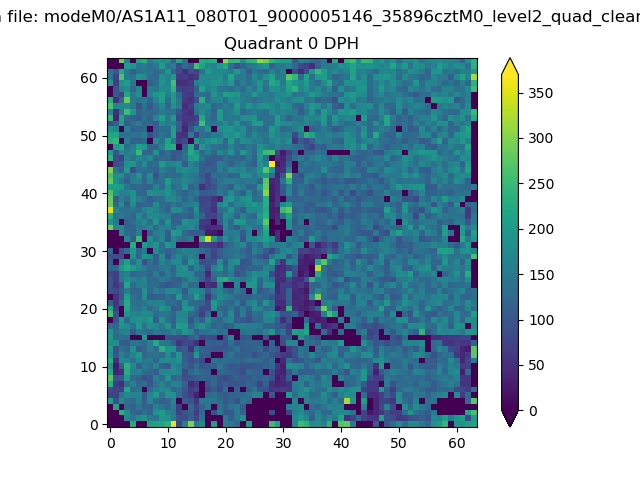 |
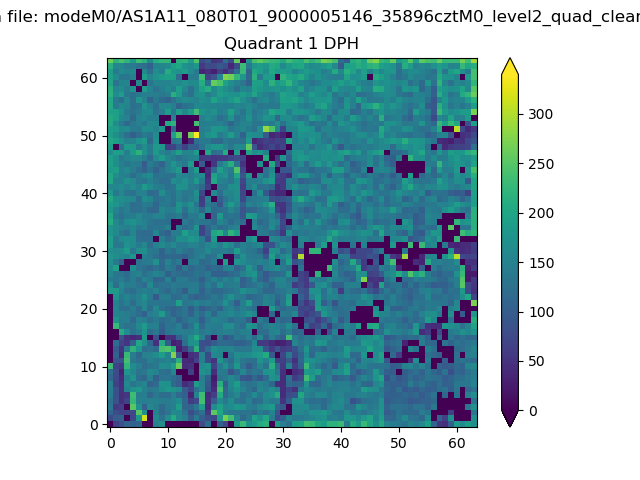 |
Quadrant B |
|---|---|---|---|
| Quadrant D | 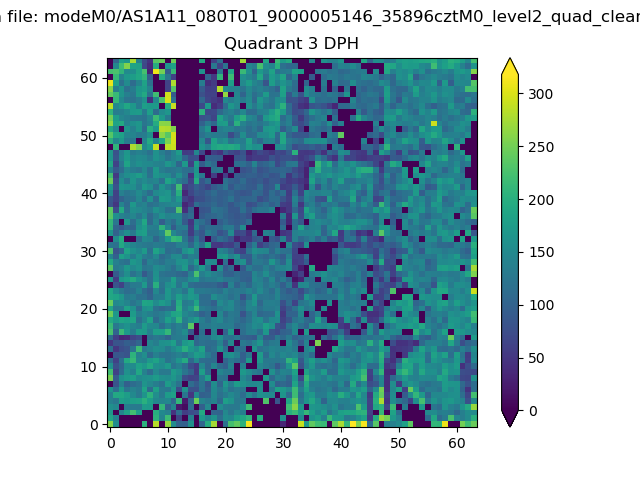 |
 |
Quadrant C |
| Plot type | Count rate plots | Images |
|---|---|---|
| Comparison with Poisson distribution Blue bars denote a histogram of data divided into 1 sec bins. Red curve is a Poisson curve with rate = median count rate of data. |
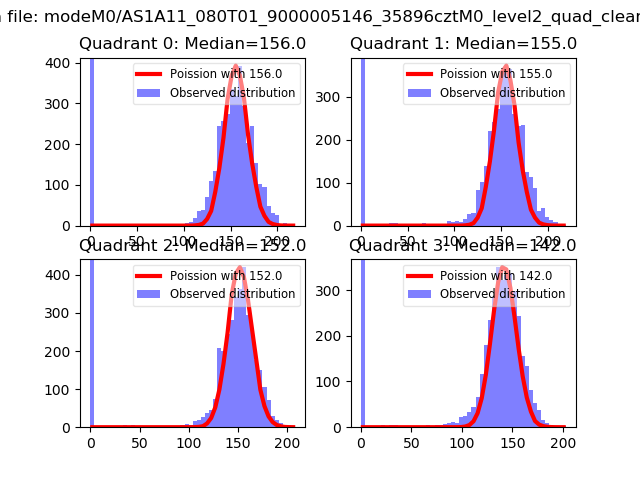 |
 |
| Quadrant-wise count rates Data is divided into 100 sec bins |
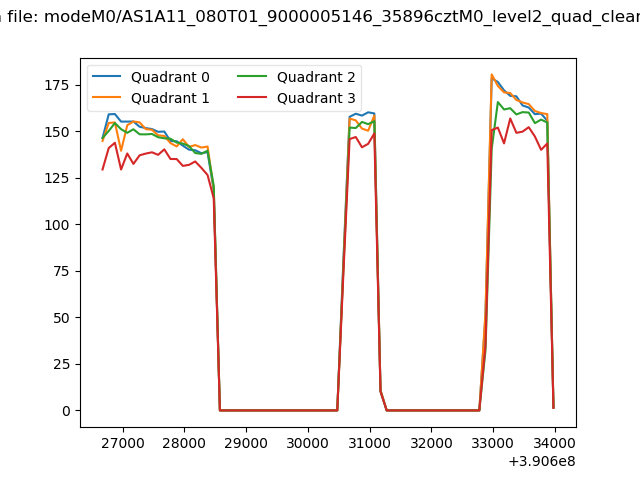 |
|
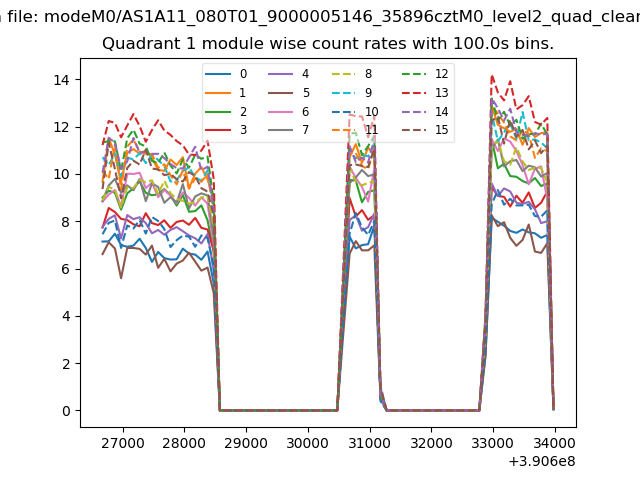
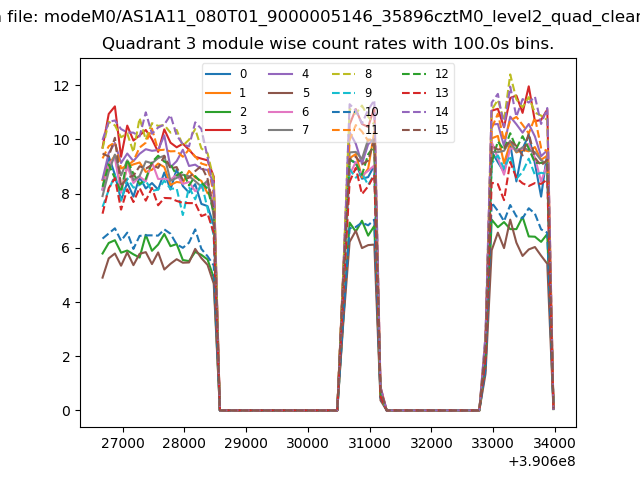
| Module-wise count rates for Quadrant A Data is divided into 100 sec bins |
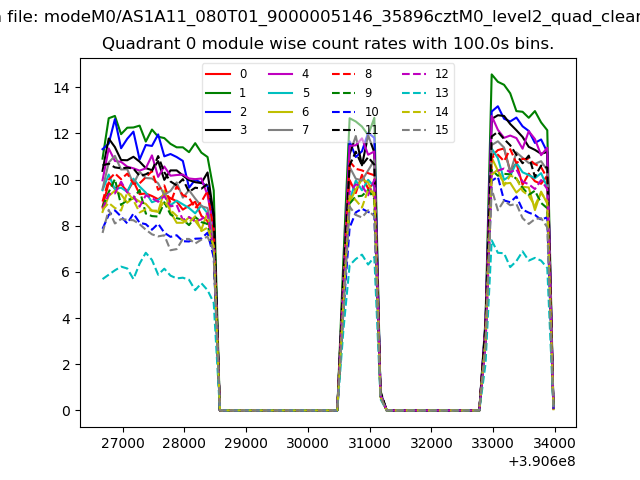 |
 |
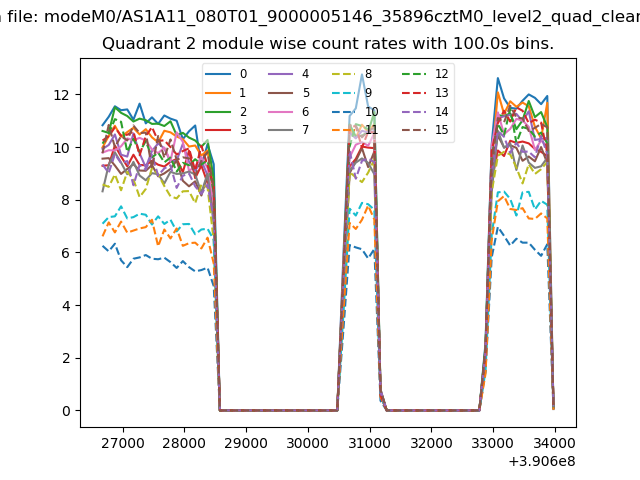
| Module-wise count rates for Quadrant B Data is divided into 100 sec bins |
 |
 |
| Module-wise count rates for Quadrant C Data is divided into 100 sec bins |
 |
 |
| Module-wise count rates for Quadrant D Data is divided into 100 sec bins |
 |
 |
| Parameter | Plot |
|---|---|
| CZT HV Monitor | 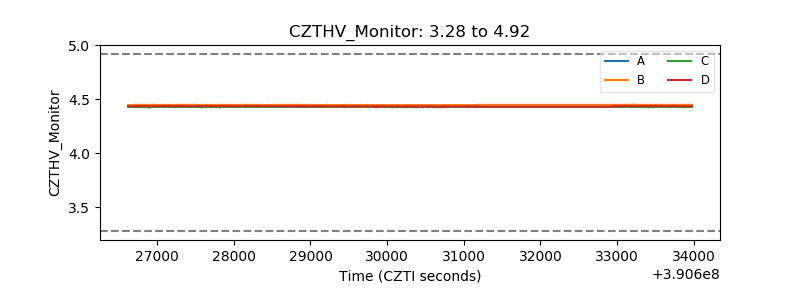 |
| D_VDD | 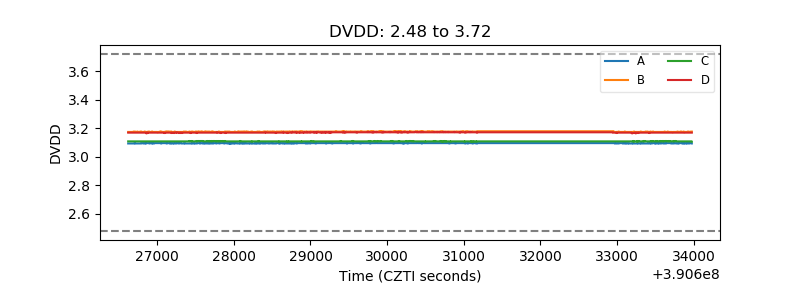 |
| Temperature 1 | 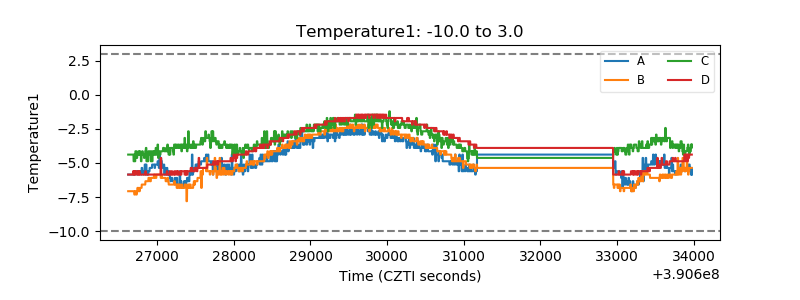 |
| Veto HV Monitor | 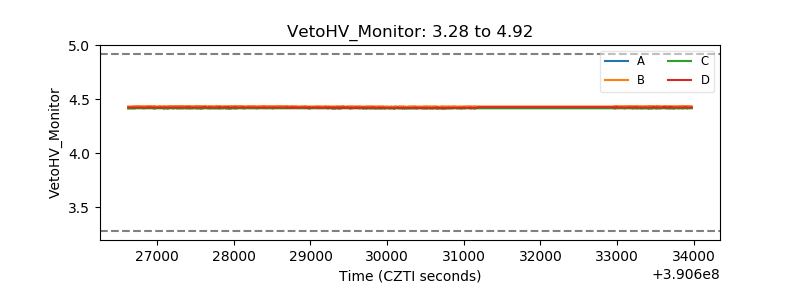 |
| Veto LLD | 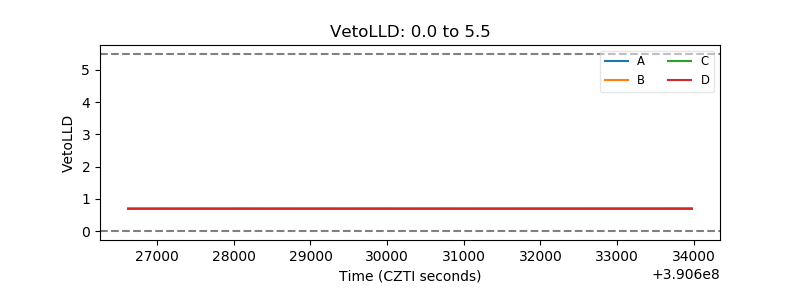 |
| Alpha Counter | 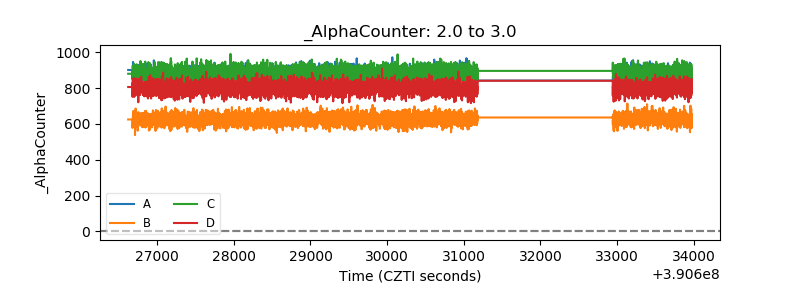 |
| _CPM_Rate | 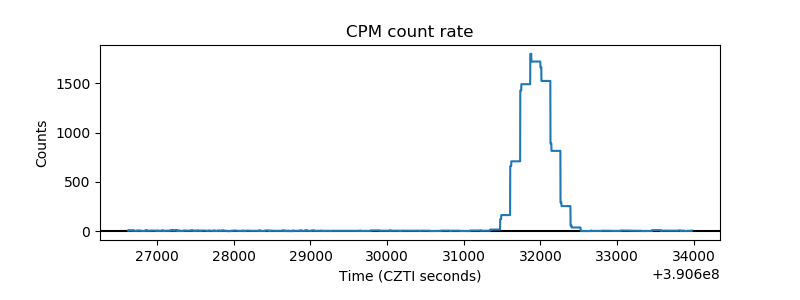 |
| CZT Counter | 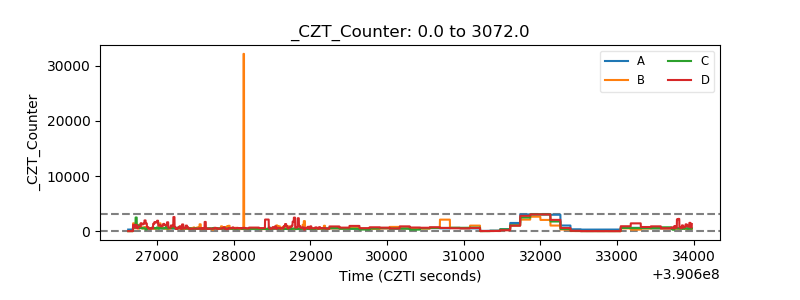 |
| +2.5 Volts monitor | 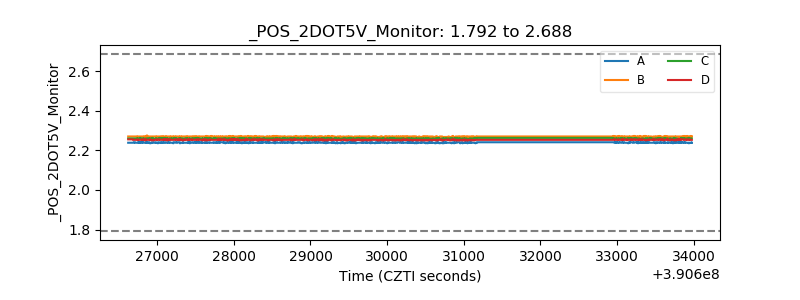 |
| +5 Volts monitor | 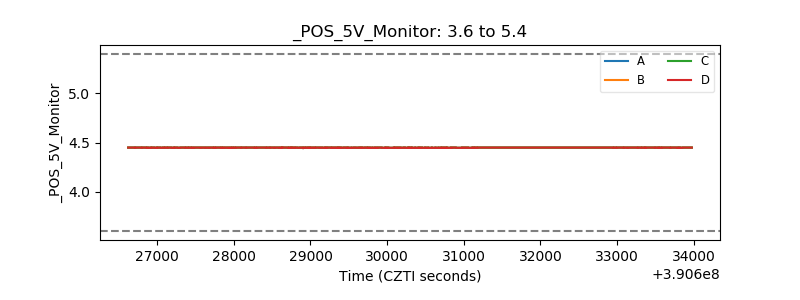 |
| _ROLL_ROT | 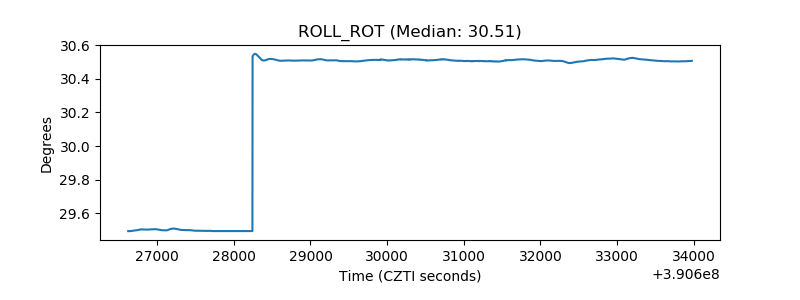 |
| _Roll_DEC | 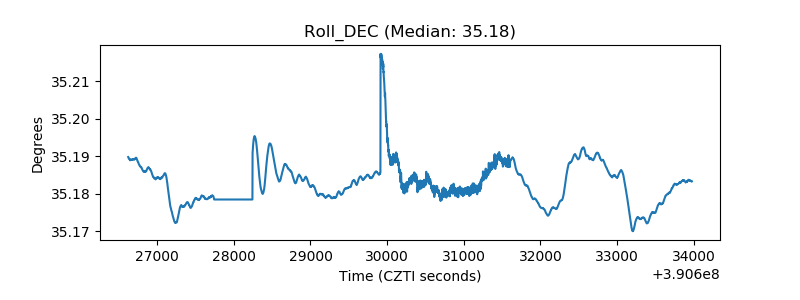 |
| _Roll_RA | 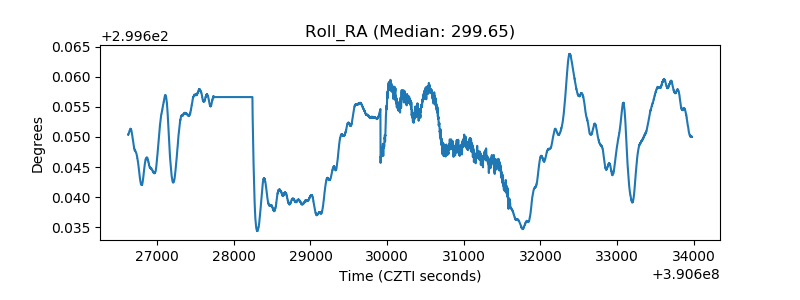 |
| Veto Counter | 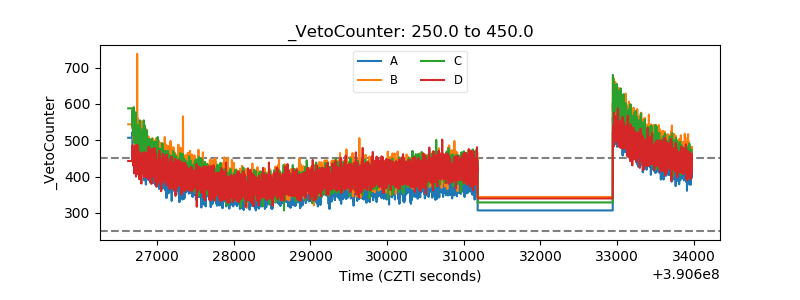 |