| Param | Original file | Final file |
|---|---|---|
| Filename | modeM0/AS1A11_080T01_9000005146_35894cztM0_level2.evt | modeM0/AS1A11_080T01_9000005146_35894cztM0_level2_quad_clean.evt |
| Size (bytes) | 489,798,720 | 80,588,160 |
| Size | 467.1 MB | 76.9 MB |
| Events in quadrant A | 2,798,340 | 529,009 |
| Events in quadrant B | 3,623,745 | 518,667 |
| Events in quadrant C | 3,100,254 | 517,441 |
| Events in quadrant D | 4,926,945 | 478,713 |
| Mode M9 | |||
|---|---|---|---|
| Quadrant | BADHDUFLAG | Total packets | Discarded packets |
| A | 0 | 16 | 0 |
| B | 0 | 16 | 0 |
| C | 0 | 16 | 0 |
| D | 0 | 16 | 0 |
| Mode SS | |||
|---|---|---|---|
| Quadrant | BADHDUFLAG | Total packets | Discarded packets |
| A | 0 | 116 | 0 |
| B | 0 | 116 | 0 |
| C | 0 | 116 | 0 |
| D | 0 | 116 | 0 |
| Mode M0 | |||
|---|---|---|---|
| Quadrant | BADHDUFLAG | Total packets | Discarded packets |
| A | 0 | 11827 | 3 |
| B | 0 | 14521 | 2 |
| C | 0 | 12595 | 2 |
| D | 0 | 18591 | 2 |
| Quadrant | Total seconds | Saturated seconds | Saturation percentage |
|---|---|---|---|
| A | 5664 | 7 | 0.123588% |
| B | 5664 | 354 | 6.250000% |
| C | 5664 | 36 | 0.635593% |
| D | 5664 | 240 | 4.237288% |
Noise dominated data is calculated using 1-second bins in cleaned event files. If a bin has >2000 counts, and if more than 50% of those come from <1% of pixels, then it is considered to be noise-dominated and hence unusable.
| Quadrant | # 1 sec bins | Bins with >0 counts | Bins with >2000 counts | High rate bins dominated by noise | Noise dominated (total time) | Noise dominated (detector-on time) | Marked lightcurve |
|---|---|---|---|---|---|---|---|
| A | 7306 | 5665 | 2 | 2 | 0.03% | 0.04% | 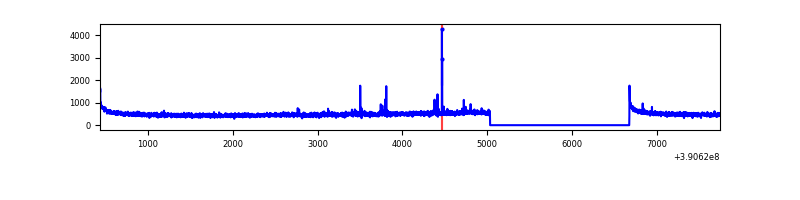 |
| B | 7306 | 5665 | 239 | 239 | 3.27% | 4.22% | 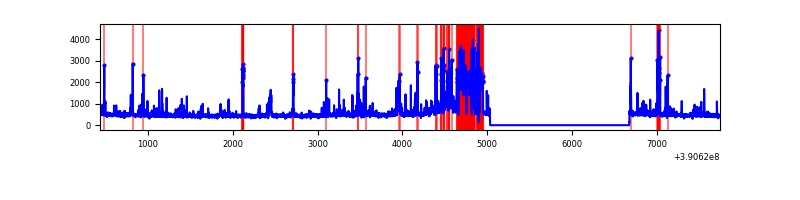 |
| C | 7306 | 5665 | 29 | 29 | 0.40% | 0.51% | 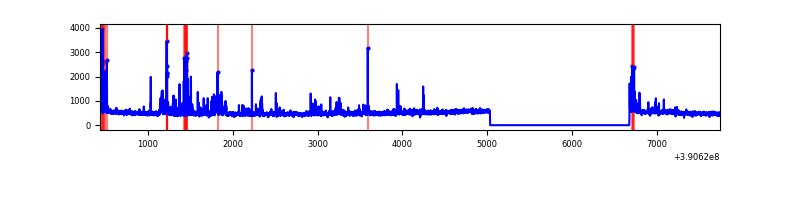 |
| D | 7306 | 5665 | 255 | 255 | 3.49% | 4.50% | 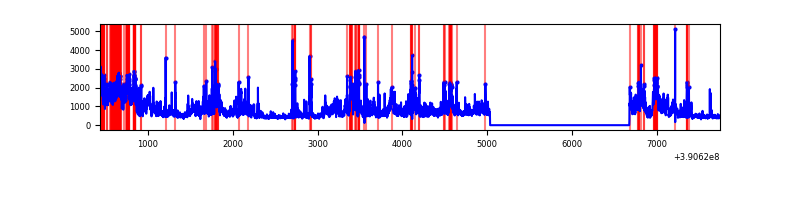 |
Top three noisy pixels from each quadrant. If the there are fewer than three noisy pixels in the level2.evt file, extra rows are filled as -1
| Pixel properties | Quadrant properties | ||||||
|---|---|---|---|---|---|---|---|
| Quadrant | DetID | PixID | Counts | Sigma | Mean | Median | Sigma |
| A | 10 | 83 | 171550 | 1257.92 | 666 | 655 | 135.9 |
| A | 7 | 3 | 32634 | 235.39 | 666 | 655 | 135.9 |
| A | 13 | 6 | 12668 | 88.43 | 666 | 655 | 135.9 |
| B | 5 | 172 | 606239 | 4937.9 | 642 | 627 | 122.6 |
| B | 5 | 63 | 323049 | 2628.89 | 642 | 627 | 122.6 |
| B | 5 | 255 | 84278 | 682.05 | 642 | 627 | 122.6 |
| C | 0 | 207 | 249027 | 1669.32 | 641 | 646 | 148.8 |
| C | 15 | 214 | 240476 | 1611.85 | 641 | 646 | 148.8 |
| C | 0 | 10 | 83579 | 557.38 | 641 | 646 | 148.8 |
| D | 12 | 227 | 1694532 | 10815.08 | 633 | 618 | 156.6 |
| D | 13 | 249 | 227311 | 1447.36 | 633 | 618 | 156.6 |
| D | 13 | 153 | 181667 | 1155.94 | 633 | 618 | 156.6 |
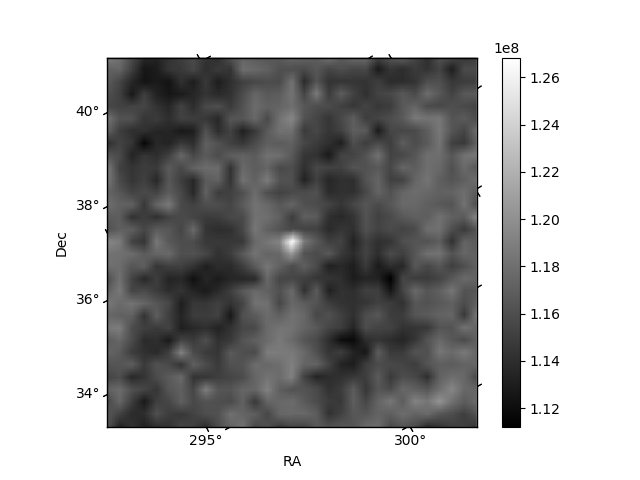
Histogram calculated using DETX and DETY for each event in the final _common_clean file
| Quadrant A | 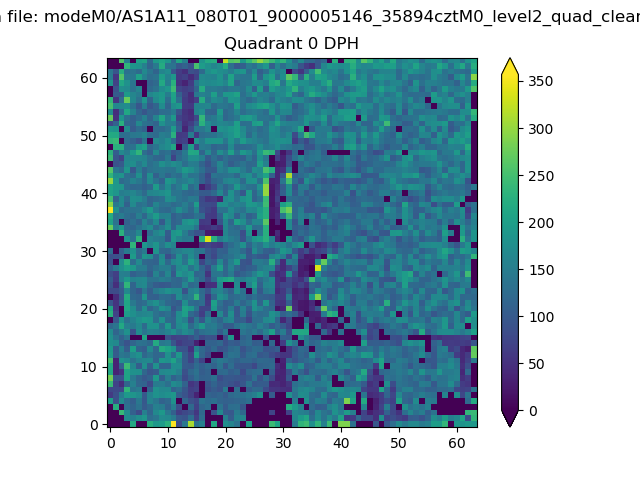 |
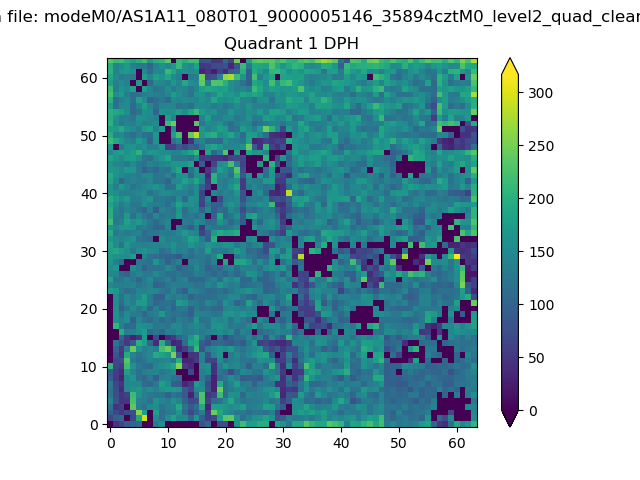 |
Quadrant B |
|---|---|---|---|
| Quadrant D |  |
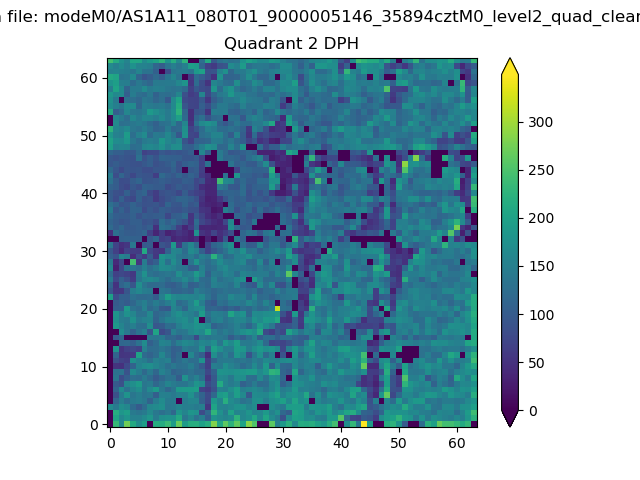 |
Quadrant C |
| Plot type | Count rate plots | Images |
|---|---|---|
| Comparison with Poisson distribution Blue bars denote a histogram of data divided into 1 sec bins. Red curve is a Poisson curve with rate = median count rate of data. |
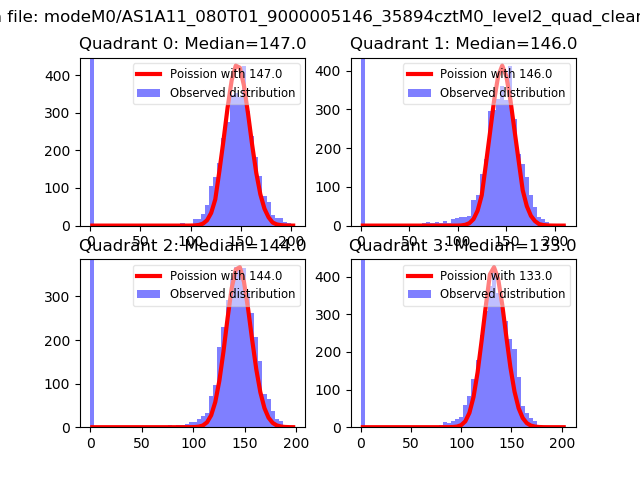 |
 |
| Quadrant-wise count rates Data is divided into 100 sec bins |
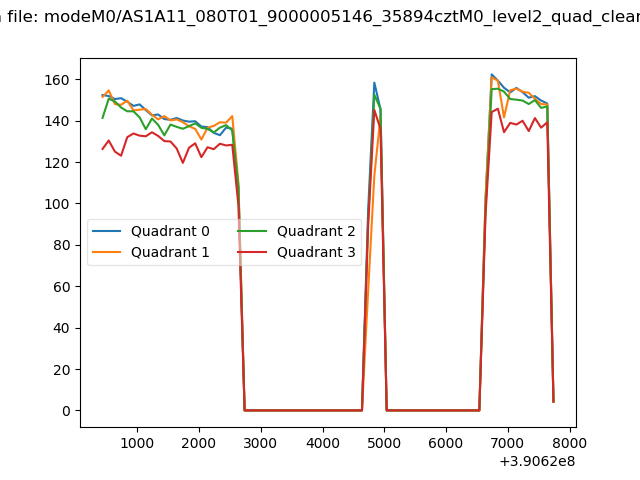 |
|
| Module-wise count rates for Quadrant A Data is divided into 100 sec bins |
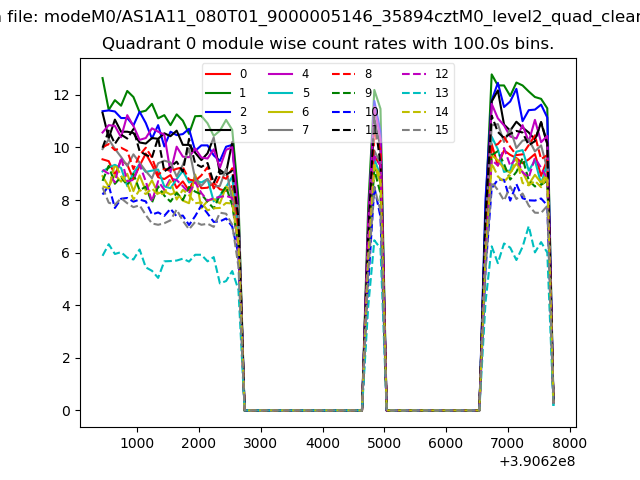 |
 |
| Module-wise count rates for Quadrant B Data is divided into 100 sec bins |
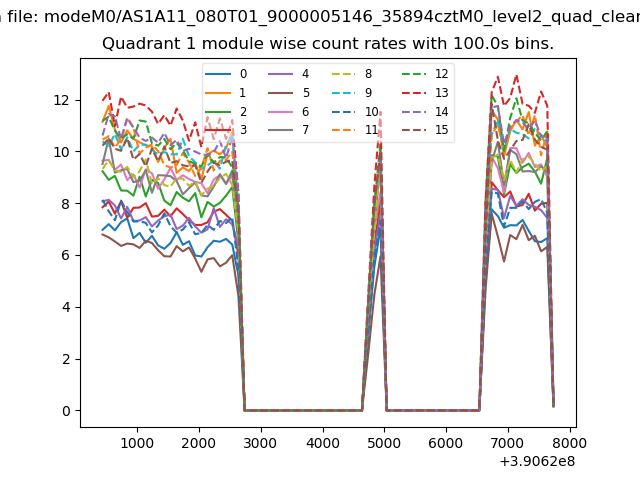 |
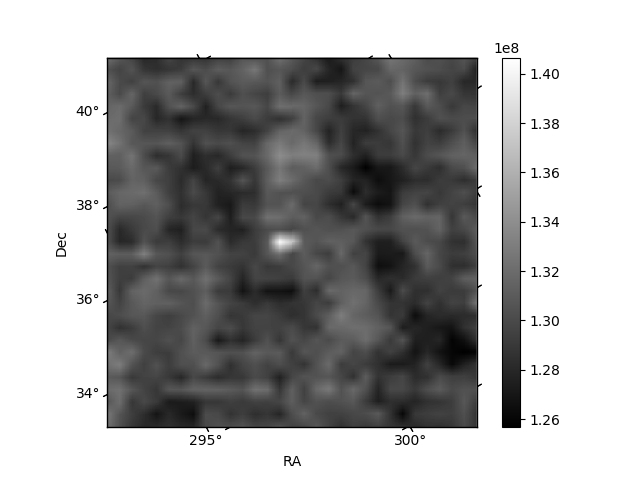 |
| Module-wise count rates for Quadrant C Data is divided into 100 sec bins |
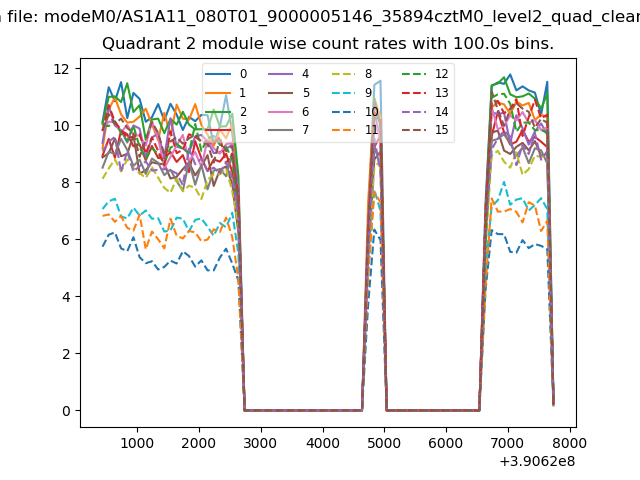 |
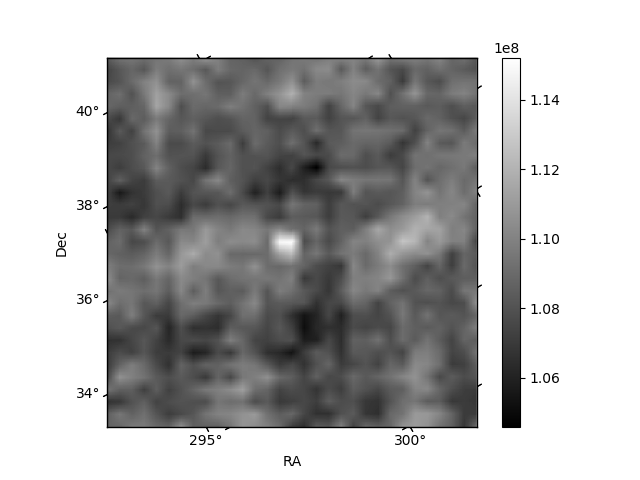 |
| Module-wise count rates for Quadrant D Data is divided into 100 sec bins |
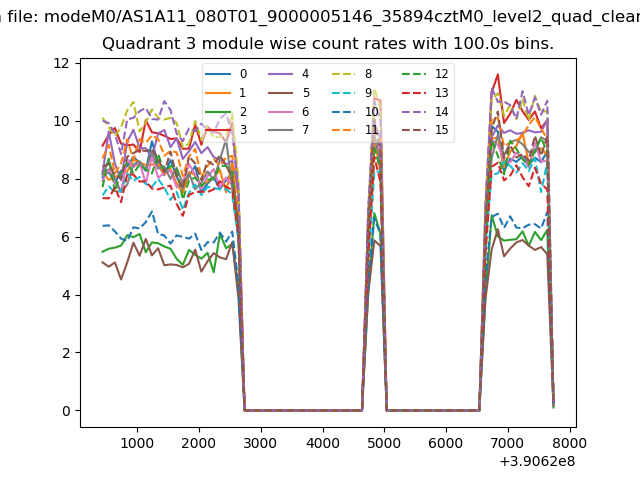 |
 |
| Parameter | Plot |
|---|---|
| CZT HV Monitor | 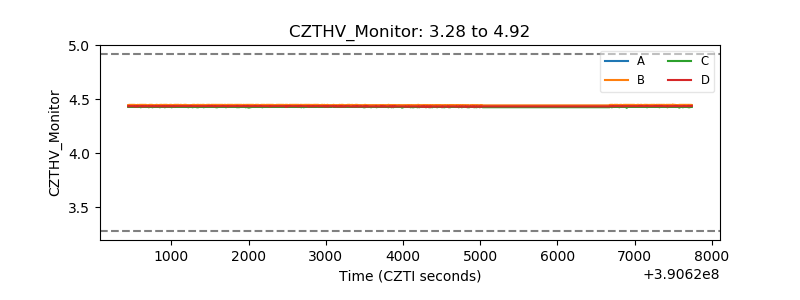 |
| D_VDD | 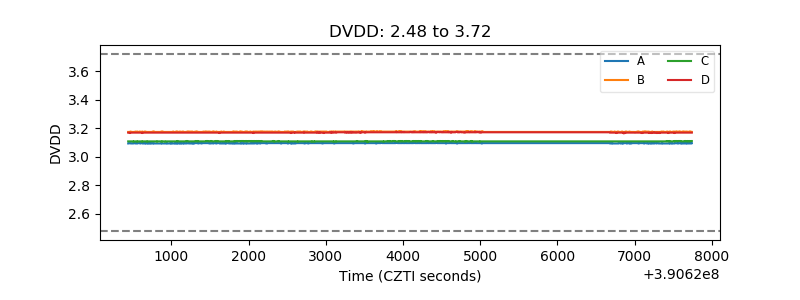 |
| Temperature 1 | 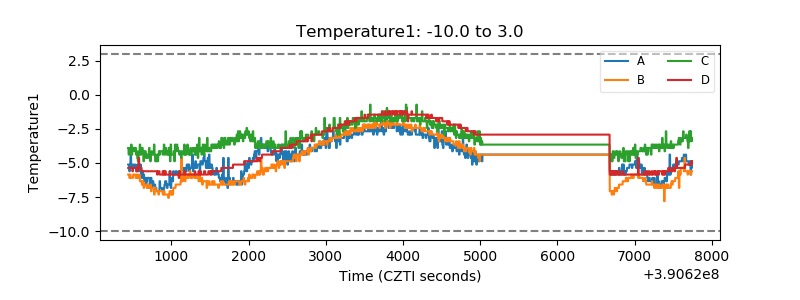 |
| Veto HV Monitor | 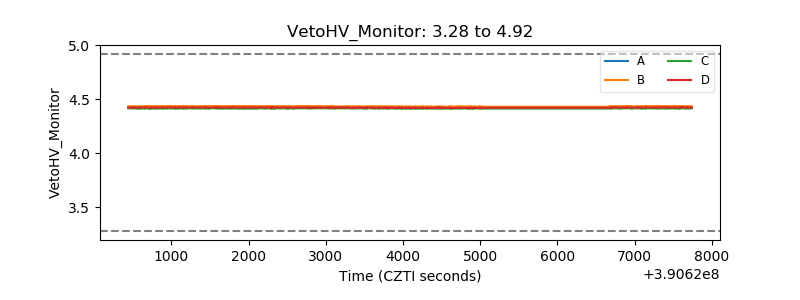 |
| Veto LLD | 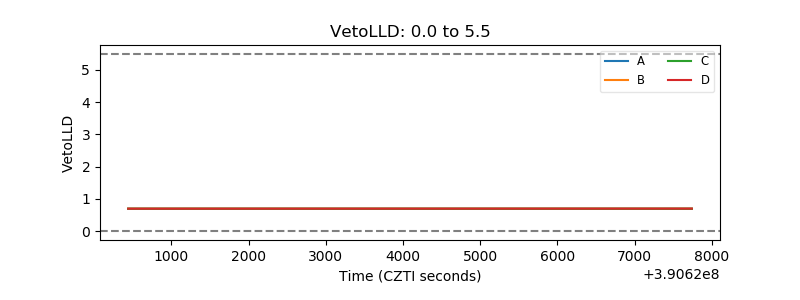 |
| Alpha Counter | 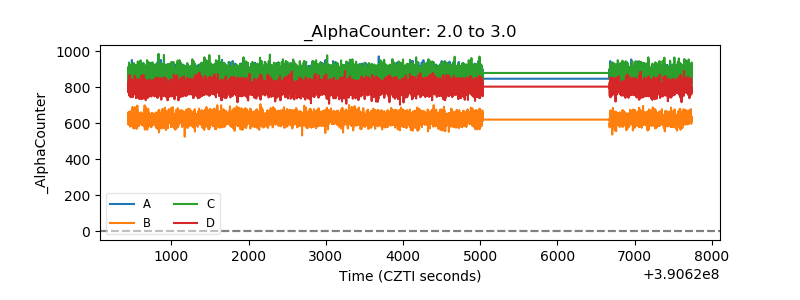 |
| _CPM_Rate | 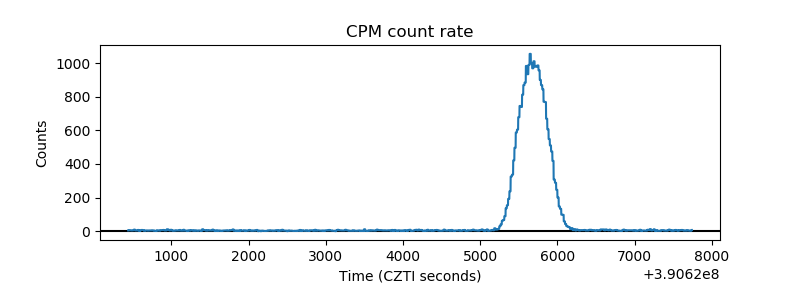 |
| CZT Counter | 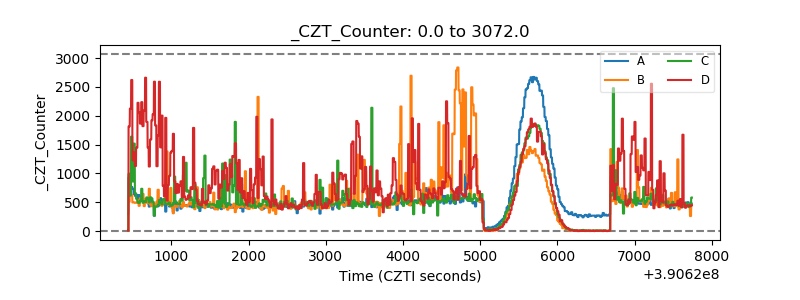 |
| +2.5 Volts monitor | 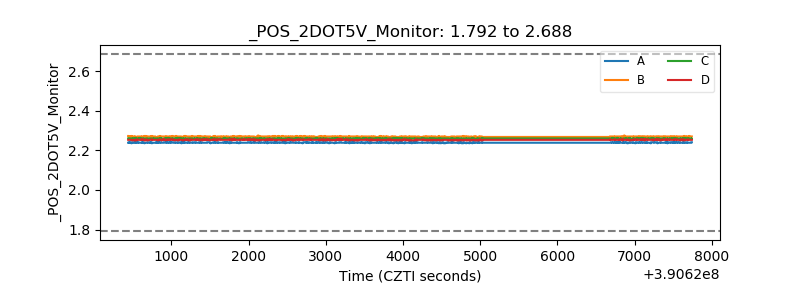 |
| +5 Volts monitor | 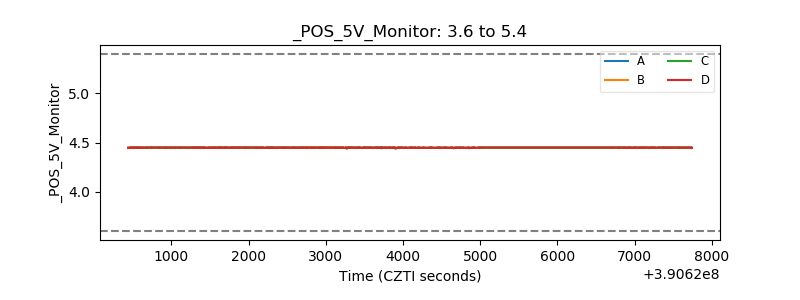 |
| _ROLL_ROT | 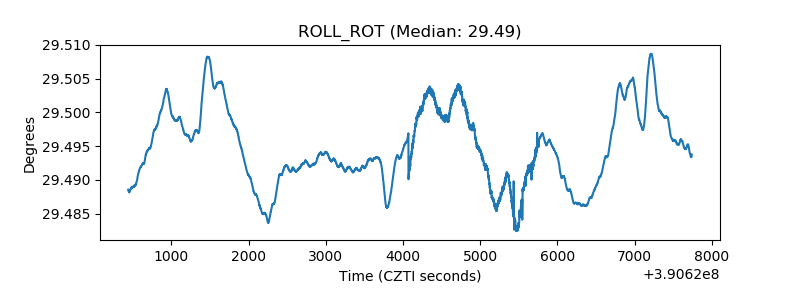 |
| _Roll_DEC | 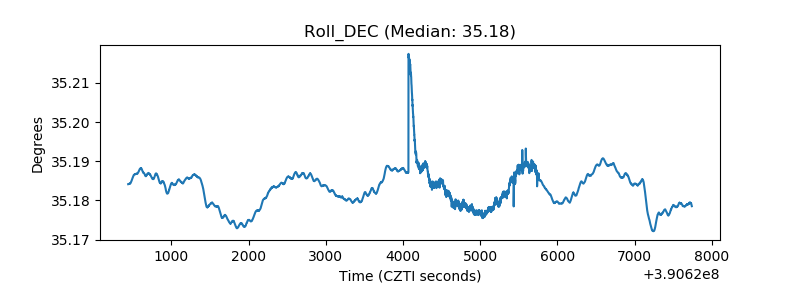 |
| _Roll_RA | 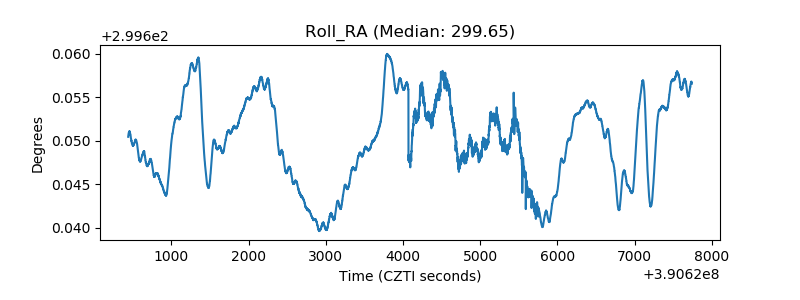 |
| Veto Counter | 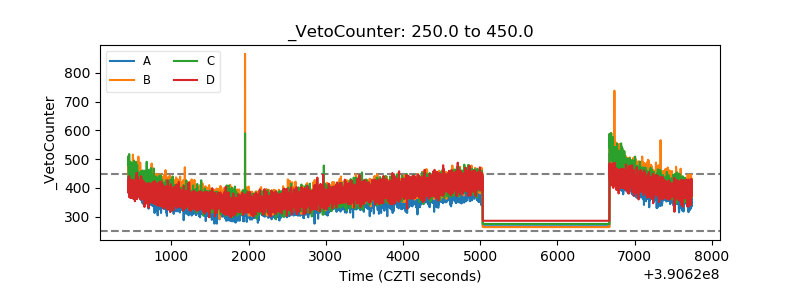 |