| Param | Original file | Final file |
|---|---|---|
| Filename | modeM0/AS1A11_080T01_9000005146_35892cztM0_level2.evt | modeM0/AS1A11_080T01_9000005146_35892cztM0_level2_quad_clean.evt |
| Size (bytes) | 1,008,933,120 | 165,214,080 |
| Size | 962.2 MB | 157.6 MB |
| Events in quadrant A | 5,513,321 | 1,110,084 |
| Events in quadrant B | 7,512,598 | 1,072,771 |
| Events in quadrant C | 5,762,811 | 1,090,748 |
| Events in quadrant D | 11,018,536 | 962,301 |
| Mode M9 | |||
|---|---|---|---|
| Quadrant | BADHDUFLAG | Total packets | Discarded packets |
| A | 0 | 40 | 0 |
| B | 0 | 40 | 0 |
| C | 0 | 40 | 0 |
| D | 0 | 40 | 0 |
| Mode SS | |||
|---|---|---|---|
| Quadrant | BADHDUFLAG | Total packets | Discarded packets |
| A | 0 | 228 | 0 |
| B | 0 | 228 | 0 |
| C | 0 | 228 | 0 |
| D | 0 | 228 | 0 |
| Mode M0 | |||
|---|---|---|---|
| Quadrant | BADHDUFLAG | Total packets | Discarded packets |
| A | 0 | 23244 | 4 |
| B | 0 | 29720 | 3 |
| C | 0 | 23665 | 3 |
| D | 0 | 40369 | 3 |
| Quadrant | Total seconds | Saturated seconds | Saturation percentage |
|---|---|---|---|
| A | 11084 | 22 | 0.198484% |
| B | 11084 | 664 | 5.990617% |
| C | 11084 | 100 | 0.902201% |
| D | 11084 | 1650 | 14.886323% |
Noise dominated data is calculated using 1-second bins in cleaned event files. If a bin has >2000 counts, and if more than 50% of those come from <1% of pixels, then it is considered to be noise-dominated and hence unusable.
| Quadrant | # 1 sec bins | Bins with >0 counts | Bins with >2000 counts | High rate bins dominated by noise | Noise dominated (total time) | Noise dominated (detector-on time) | Marked lightcurve |
|---|---|---|---|---|---|---|---|
| A | 15112 | 11087 | 4 | 4 | 0.03% | 0.04% | 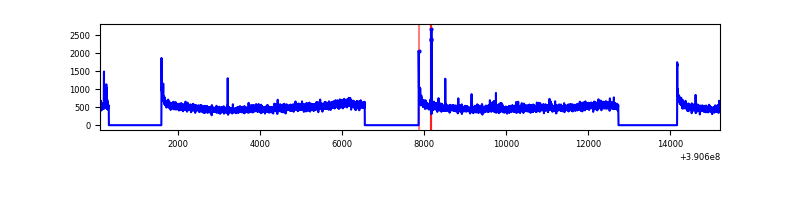 |
| B | 15112 | 11087 | 411 | 411 | 2.72% | 3.71% | 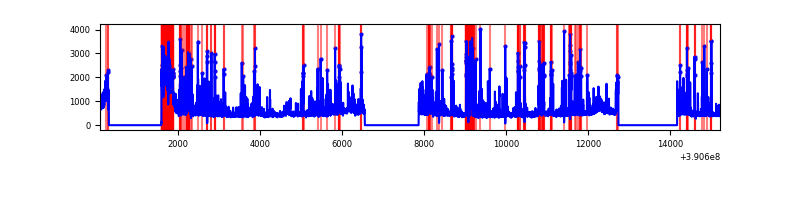 |
| C | 15112 | 11087 | 63 | 63 | 0.42% | 0.57% | 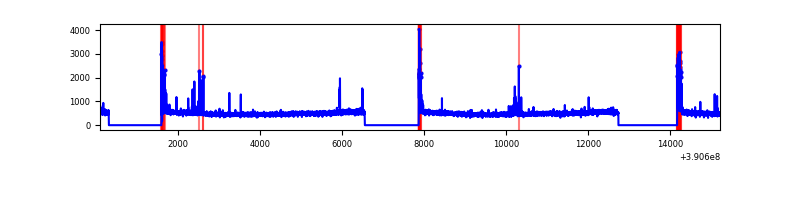 |
| D | 15112 | 11087 | 1743 | 1743 | 11.53% | 15.72% | 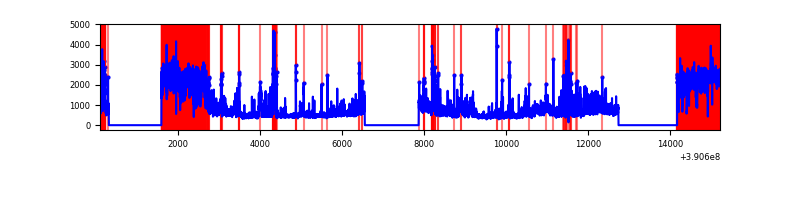 |
Top three noisy pixels from each quadrant. If the there are fewer than three noisy pixels in the level2.evt file, extra rows are filled as -1
| Pixel properties | Quadrant properties | ||||||
|---|---|---|---|---|---|---|---|
| Quadrant | DetID | PixID | Counts | Sigma | Mean | Median | Sigma |
| A | 10 | 83 | 284544 | 1071.9 | 1305 | 1282 | 264.3 |
| A | 15 | 169 | 114056 | 426.75 | 1305 | 1282 | 264.3 |
| A | 13 | 6 | 28131 | 101.6 | 1305 | 1282 | 264.3 |
| B | 5 | 172 | 869270 | 3556.26 | 1271 | 1242 | 244.1 |
| B | 5 | 63 | 760614 | 3111.1 | 1271 | 1242 | 244.1 |
| B | 5 | 255 | 560729 | 2292.18 | 1271 | 1242 | 244.1 |
| C | 15 | 214 | 461761 | 1560.39 | 1263 | 1276 | 295.1 |
| C | 0 | 10 | 259791 | 876.0 | 1263 | 1276 | 295.1 |
| C | 0 | 207 | 106472 | 356.47 | 1263 | 1276 | 295.1 |
| D | 1 | 52 | 2690321 | 9017.62 | 1212 | 1180 | 298.2 |
| D | 12 | 227 | 2401810 | 8050.15 | 1212 | 1180 | 298.2 |
| D | 2 | 250 | 393601 | 1315.92 | 1212 | 1180 | 298.2 |
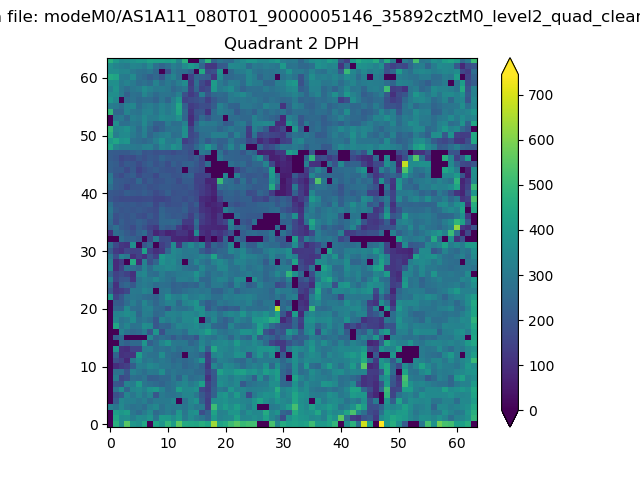
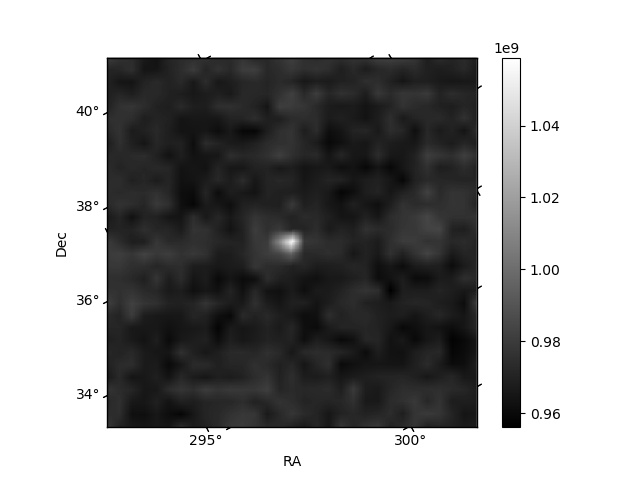
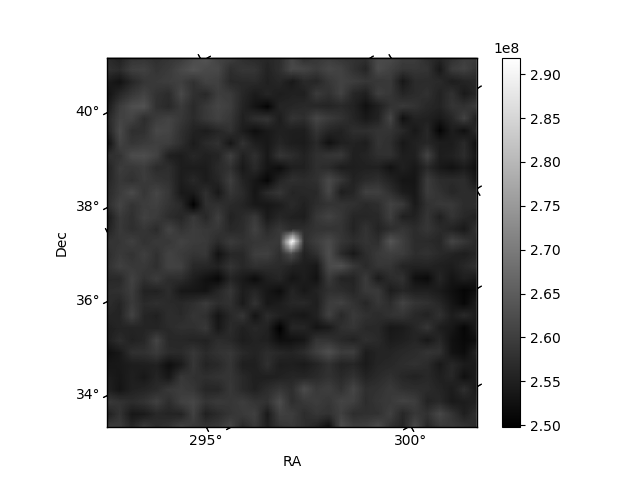
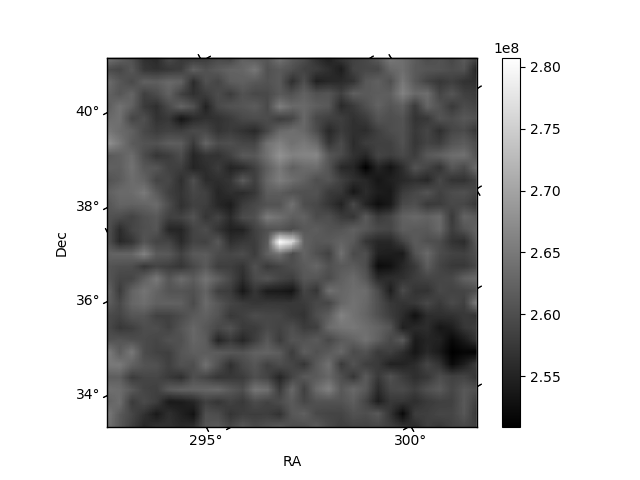
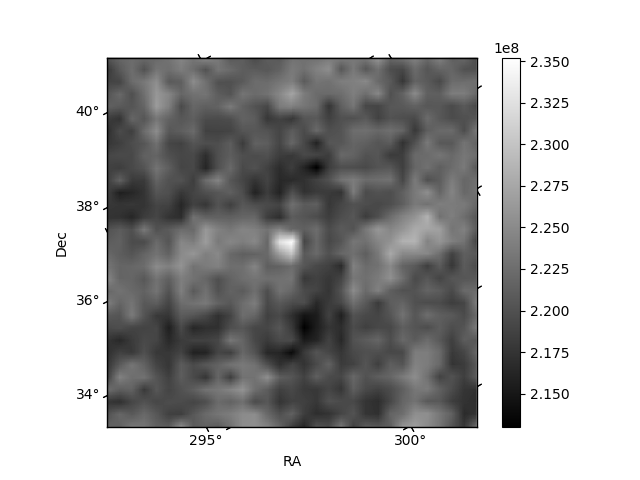
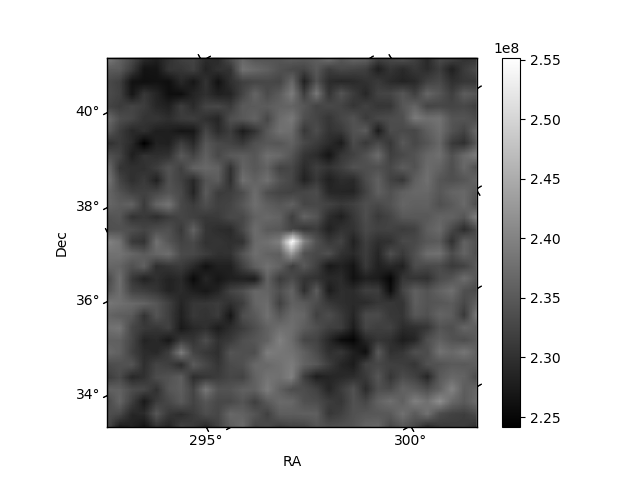
Histogram calculated using DETX and DETY for each event in the final _common_clean file
| Quadrant A | 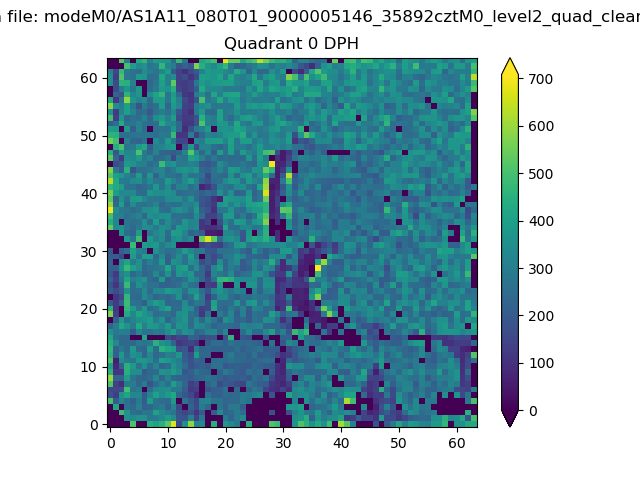 |
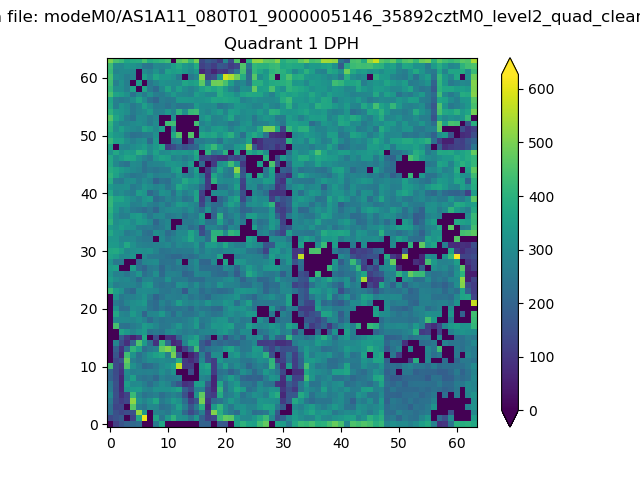 |
Quadrant B |
|---|---|---|---|
| Quadrant D | 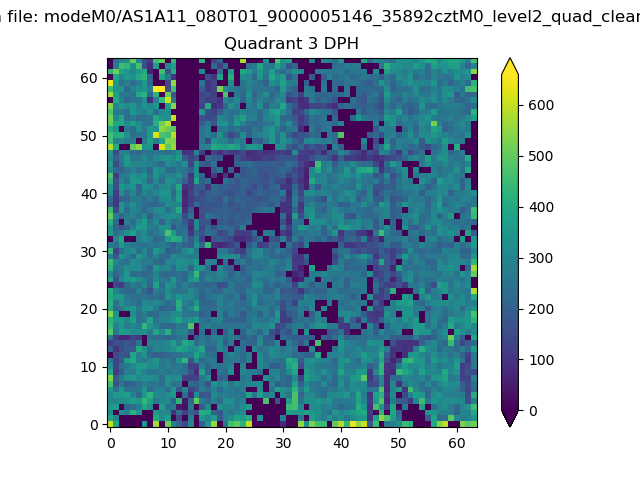 |
 |
Quadrant C |
| Plot type | Count rate plots | Images |
|---|---|---|
| Comparison with Poisson distribution Blue bars denote a histogram of data divided into 1 sec bins. Red curve is a Poisson curve with rate = median count rate of data. |
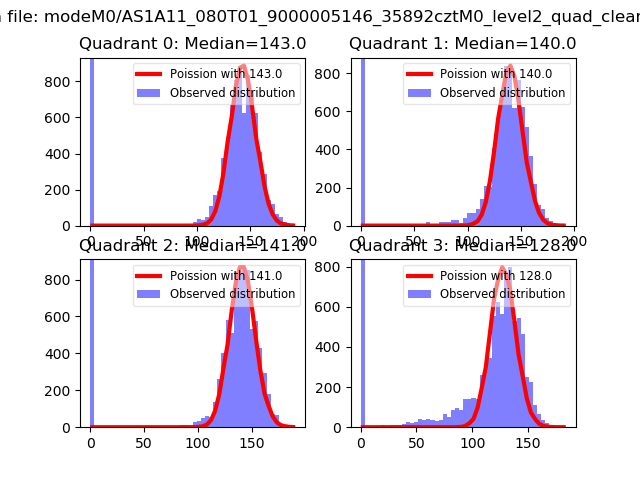 |
 |
| Quadrant-wise count rates Data is divided into 100 sec bins |
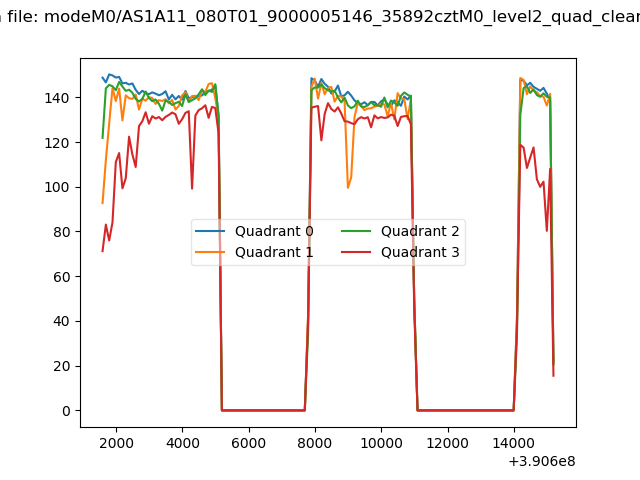 |
|
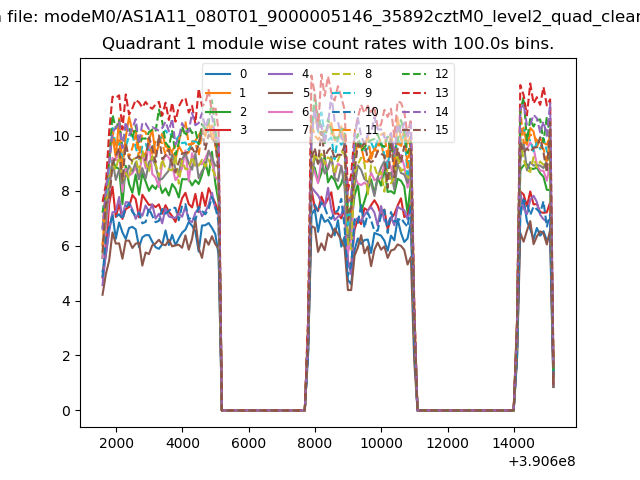
| Module-wise count rates for Quadrant A Data is divided into 100 sec bins |
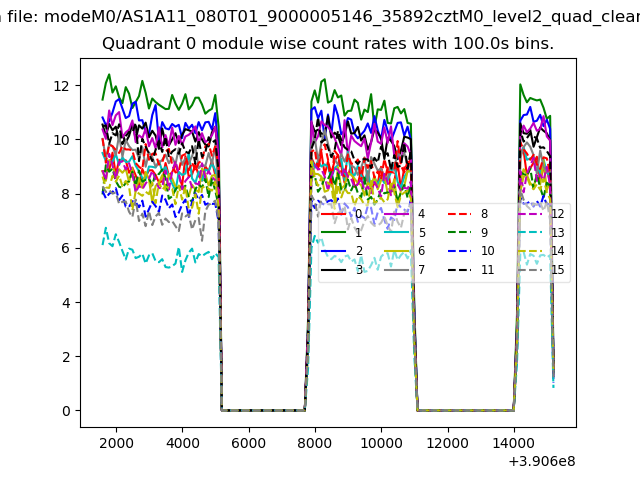 |
 |
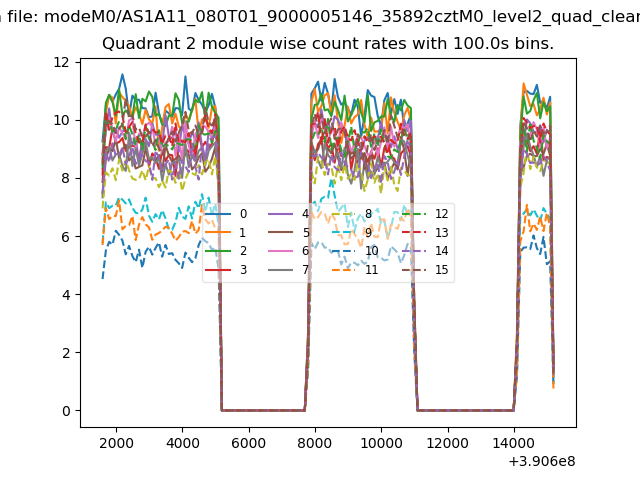
| Module-wise count rates for Quadrant B Data is divided into 100 sec bins |
 |
 |
| Module-wise count rates for Quadrant C Data is divided into 100 sec bins |
 |
 |
| Module-wise count rates for Quadrant D Data is divided into 100 sec bins |
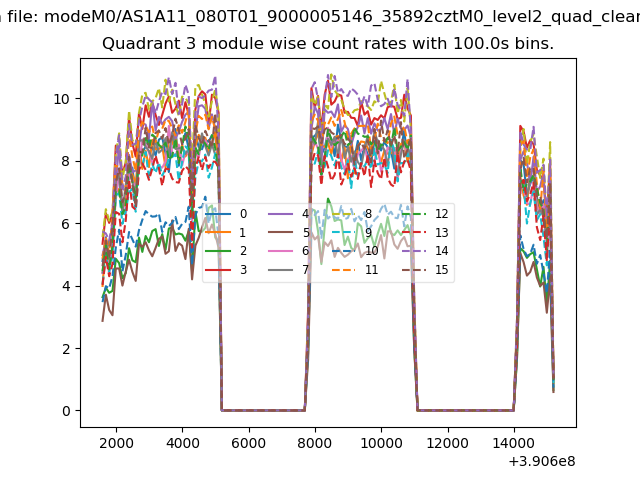 |
 |
| Parameter | Plot |
|---|---|
| CZT HV Monitor | 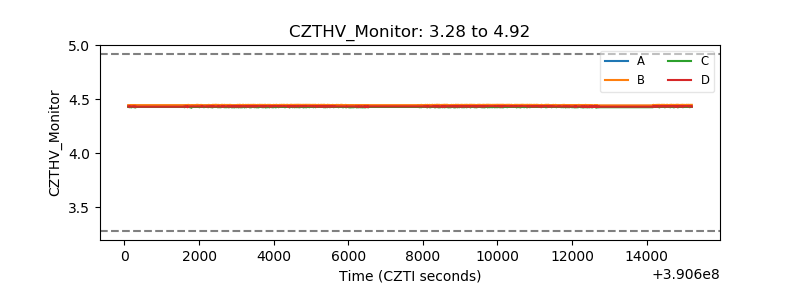 |
| D_VDD | 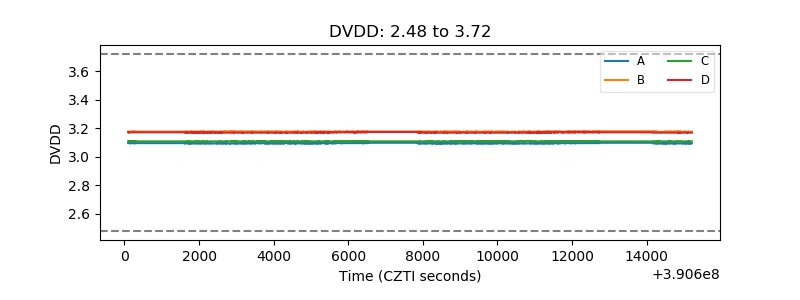 |
| Temperature 1 | 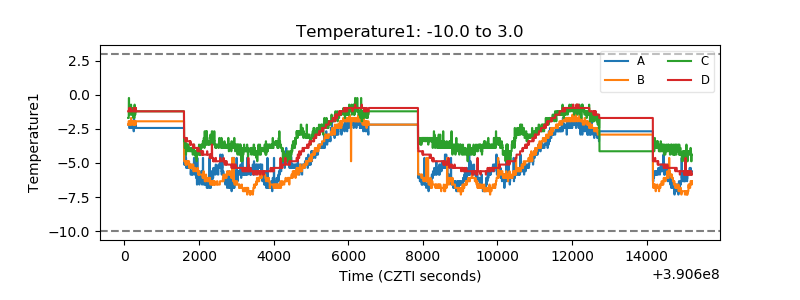 |
| Veto HV Monitor | 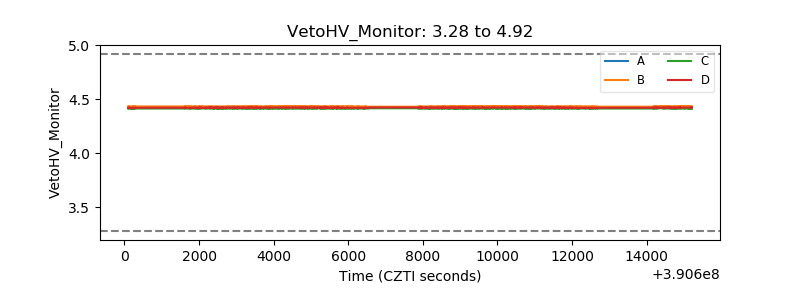 |
| Veto LLD | 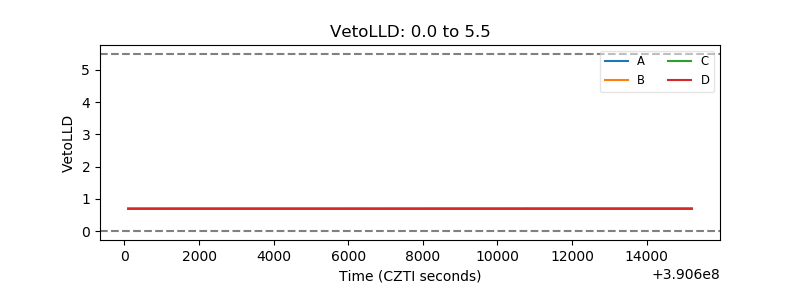 |
| Alpha Counter | 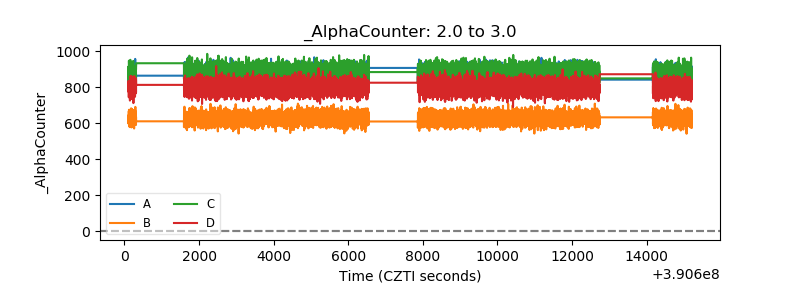 |
| _CPM_Rate | 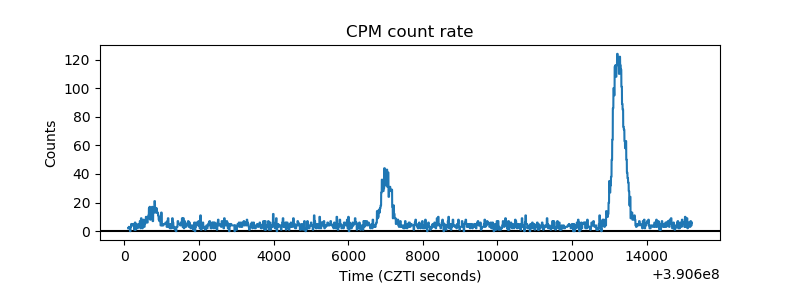 |
| CZT Counter | 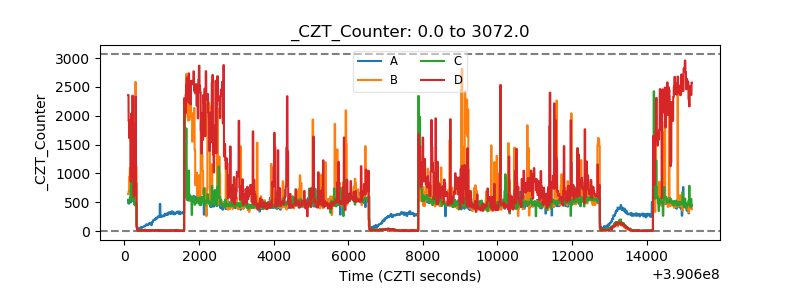 |
| +2.5 Volts monitor | 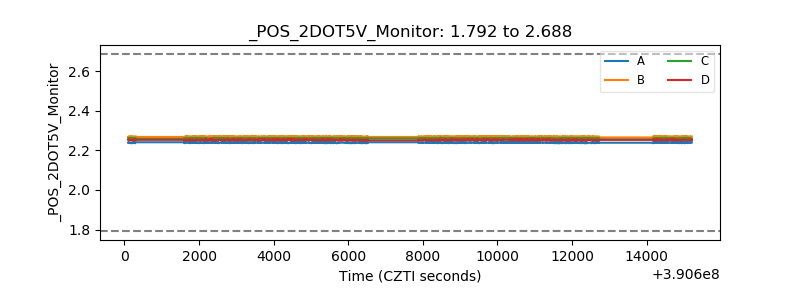 |
| +5 Volts monitor | 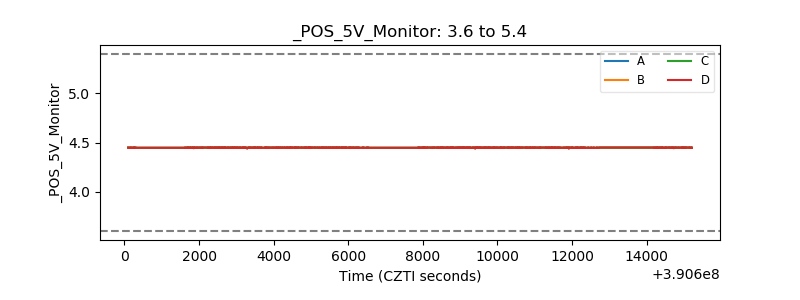 |
| _ROLL_ROT | 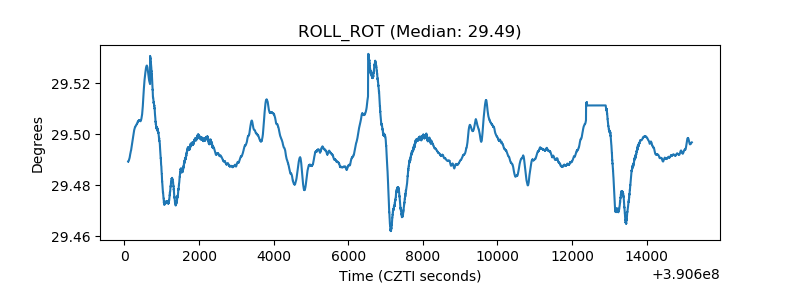 |
| _Roll_DEC | 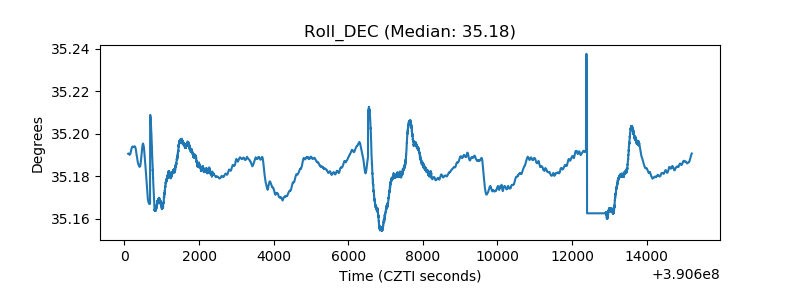 |
| _Roll_RA | 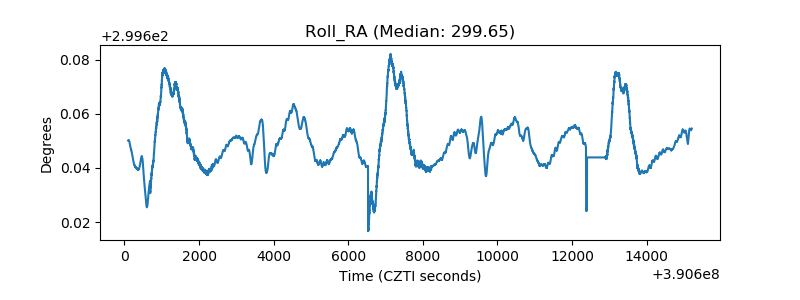 |
| Veto Counter | 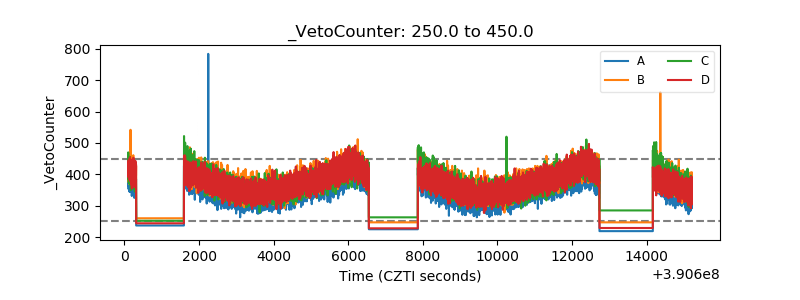 |