| Param | Original file | Final file |
|---|---|---|
| Filename | modeM0/AS1A11_080T01_9000005146_35888cztM0_level2.evt | modeM0/AS1A11_080T01_9000005146_35888cztM0_level2_quad_clean.evt |
| Size (bytes) | 553,279,680 | 83,468,160 |
| Size | 527.6 MB | 79.6 MB |
| Events in quadrant A | 2,724,588 | 561,288 |
| Events in quadrant B | 5,995,972 | 524,292 |
| Events in quadrant C | 2,861,661 | 549,455 |
| Events in quadrant D | 4,807,618 | 513,916 |
| Mode M9 | |||
|---|---|---|---|
| Quadrant | BADHDUFLAG | Total packets | Discarded packets |
| A | 0 | 31 | 0 |
| B | 0 | 31 | 0 |
| C | 0 | 31 | 0 |
| D | 0 | 32 | 0 |
| Mode SS | |||
|---|---|---|---|
| Quadrant | BADHDUFLAG | Total packets | Discarded packets |
| A | 0 | 112 | 0 |
| B | 0 | 112 | 0 |
| C | 0 | 112 | 0 |
| D | 0 | 112 | 0 |
| Mode M0 | |||
|---|---|---|---|
| Quadrant | BADHDUFLAG | Total packets | Discarded packets |
| A | 0 | 11267 | 3 |
| B | 0 | 21225 | 2 |
| C | 0 | 11430 | 2 |
| D | 0 | 17972 | 2 |
| Quadrant | Total seconds | Saturated seconds | Saturation percentage |
|---|---|---|---|
| A | 5401 | 8 | 0.148121% |
| B | 5401 | 1312 | 24.291798% |
| C | 5401 | 31 | 0.573968% |
| D | 5401 | 245 | 4.536197% |
Noise dominated data is calculated using 1-second bins in cleaned event files. If a bin has >2000 counts, and if more than 50% of those come from <1% of pixels, then it is considered to be noise-dominated and hence unusable.
| Quadrant | # 1 sec bins | Bins with >0 counts | Bins with >2000 counts | High rate bins dominated by noise | Noise dominated (total time) | Noise dominated (detector-on time) | Marked lightcurve |
|---|---|---|---|---|---|---|---|
| A | 7044 | 5402 | 0 | 0 | 0.00% | 0.00% | 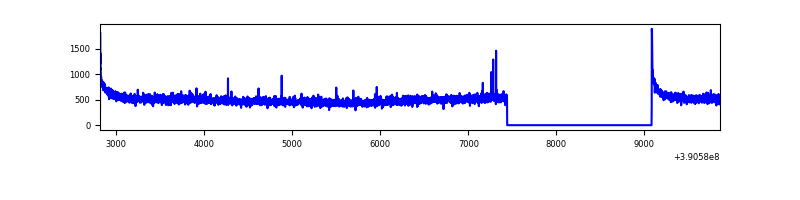 |
| B | 7044 | 5402 | 1223 | 1223 | 17.36% | 22.64% | 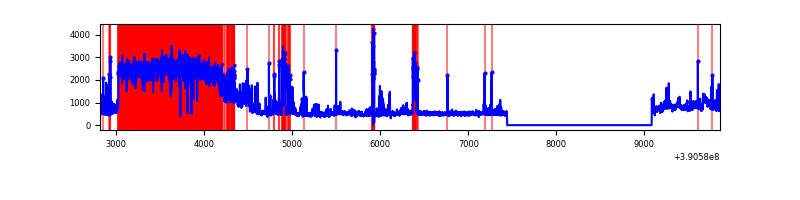 |
| C | 7044 | 5402 | 21 | 21 | 0.30% | 0.39% | 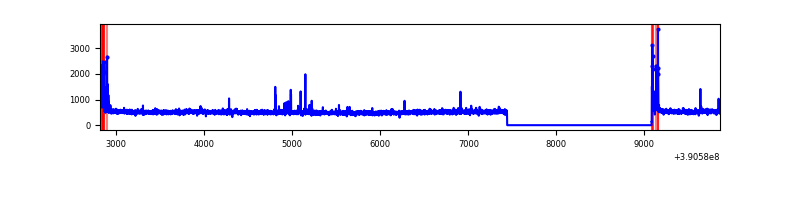 |
| D | 7044 | 5402 | 236 | 236 | 3.35% | 4.37% | 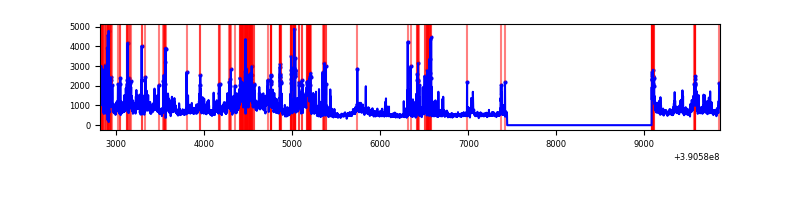 |
Top three noisy pixels from each quadrant. If the there are fewer than three noisy pixels in the level2.evt file, extra rows are filled as -1
| Pixel properties | Quadrant properties | ||||||
|---|---|---|---|---|---|---|---|
| Quadrant | DetID | PixID | Counts | Sigma | Mean | Median | Sigma |
| A | 10 | 83 | 165938 | 1222.11 | 655 | 643 | 135.3 |
| A | 13 | 6 | 12570 | 88.18 | 655 | 643 | 135.3 |
| A | 13 | 254 | 9682 | 66.83 | 655 | 643 | 135.3 |
| B | 5 | 63 | 3146339 | 28801.92 | 573 | 561 | 109.2 |
| B | 5 | 172 | 417007 | 3812.87 | 573 | 561 | 109.2 |
| B | 5 | 255 | 113386 | 1033.0 | 573 | 561 | 109.2 |
| C | 15 | 214 | 226402 | 1515.45 | 634 | 641 | 149.0 |
| C | 0 | 10 | 142777 | 954.11 | 634 | 641 | 149.0 |
| C | 0 | 207 | 21713 | 141.45 | 634 | 641 | 149.0 |
| D | 12 | 227 | 1099833 | 7113.35 | 625 | 610 | 154.5 |
| D | 8 | 195 | 486371 | 3143.48 | 625 | 610 | 154.5 |
| D | 13 | 249 | 449716 | 2906.28 | 625 | 610 | 154.5 |
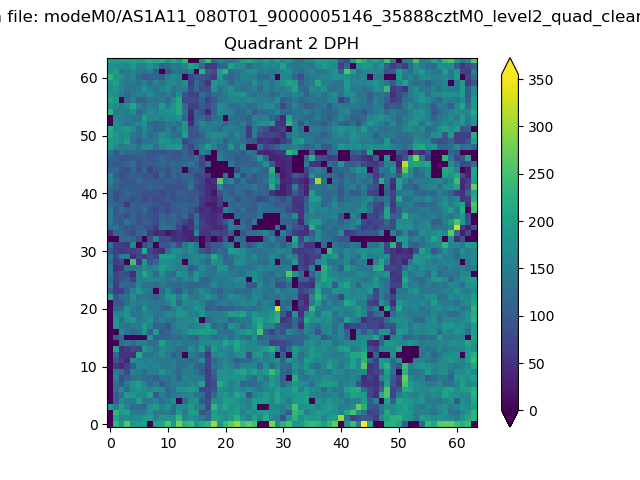
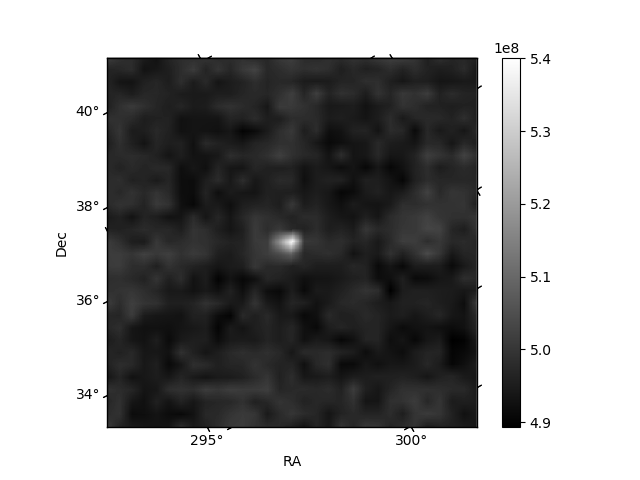
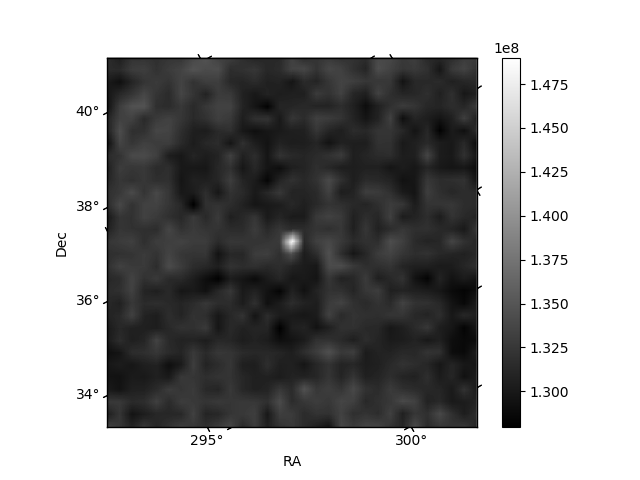
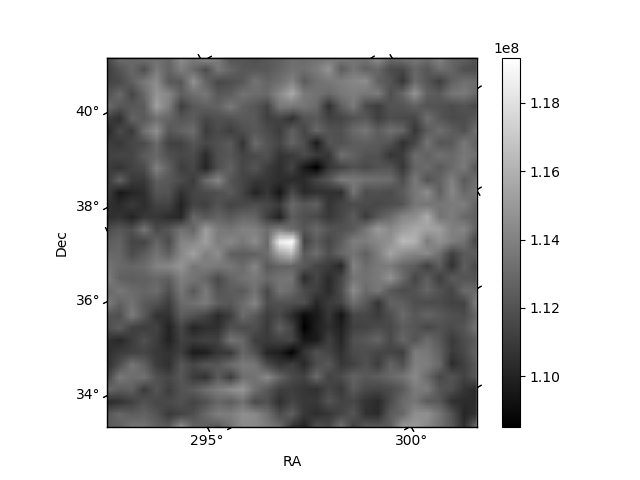
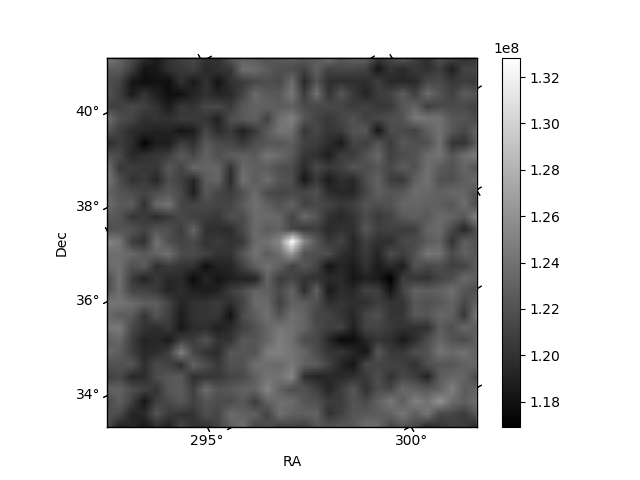
Histogram calculated using DETX and DETY for each event in the final _common_clean file
| Quadrant A | 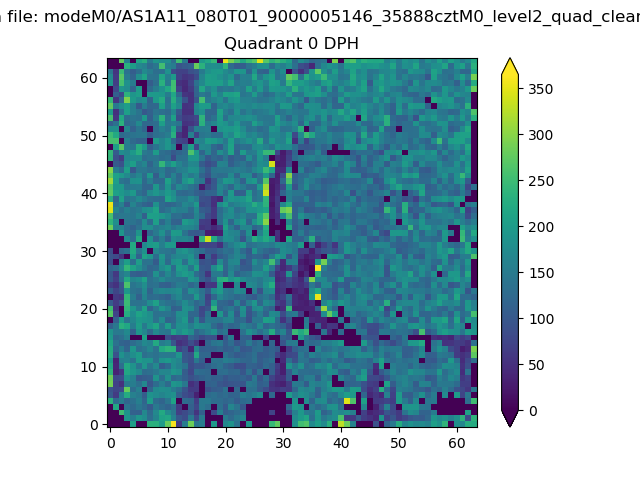 |
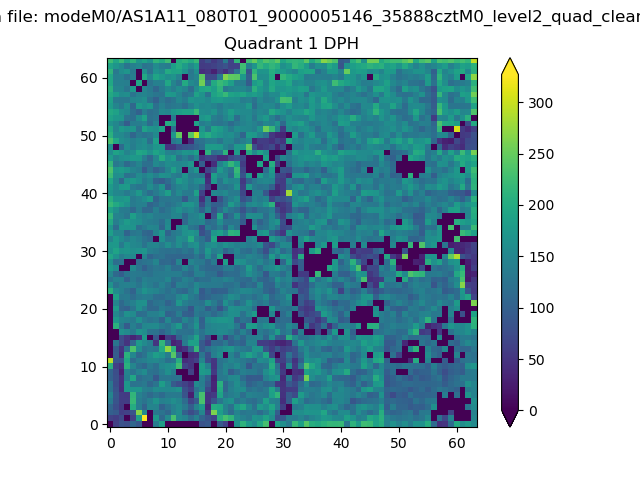 |
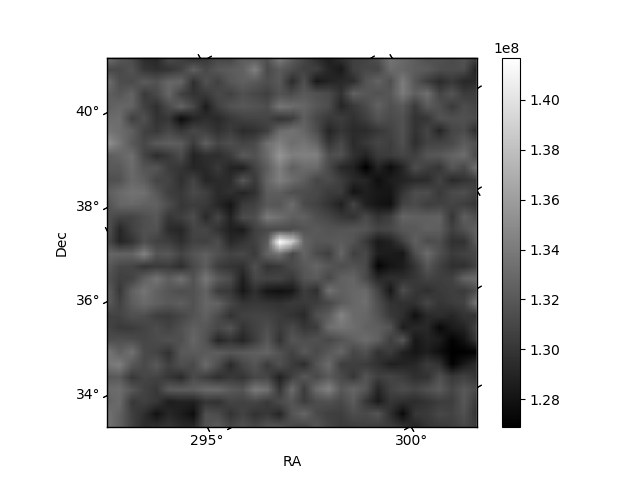
Quadrant B |
|---|---|---|---|
| Quadrant D | 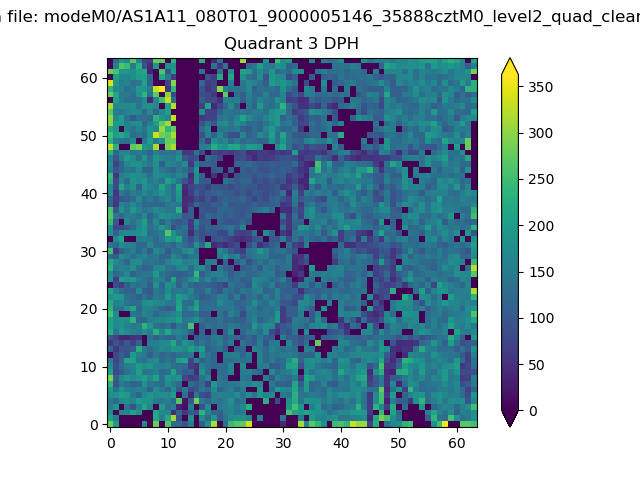 |
 |
Quadrant C |
| Plot type | Count rate plots | Images |
|---|---|---|
| Comparison with Poisson distribution Blue bars denote a histogram of data divided into 1 sec bins. Red curve is a Poisson curve with rate = median count rate of data. |
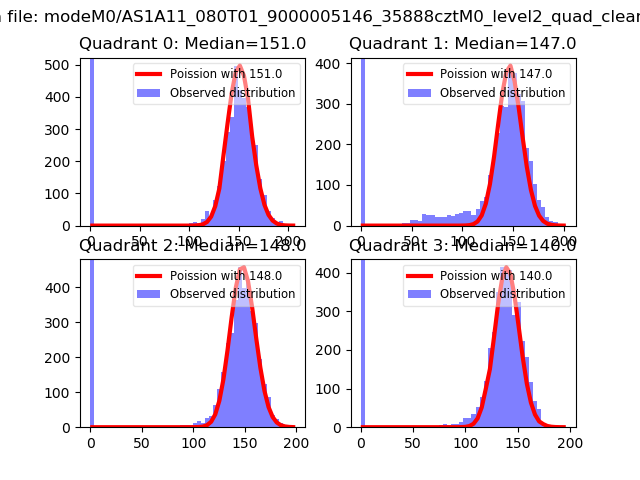 |
 |
| Quadrant-wise count rates Data is divided into 100 sec bins |
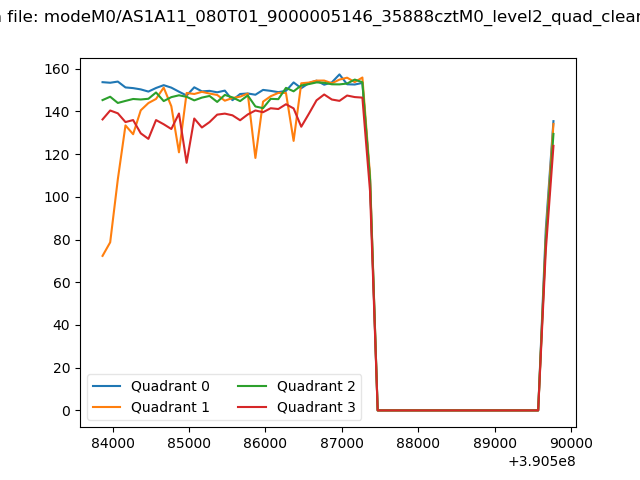 |
|
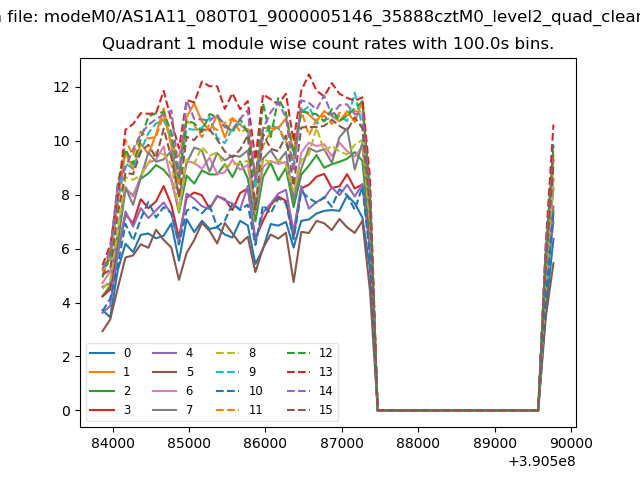
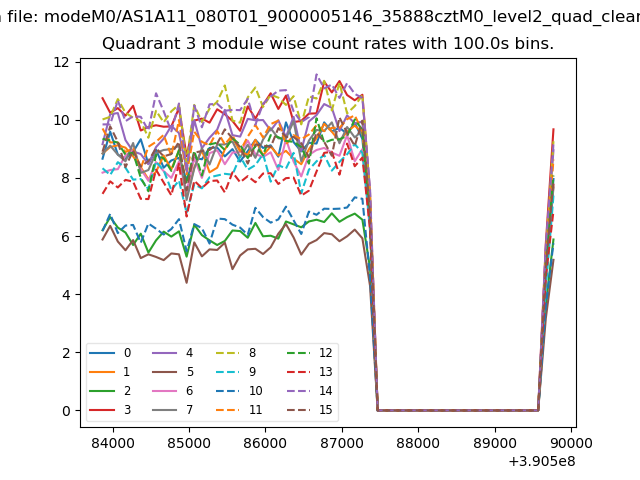
| Module-wise count rates for Quadrant A Data is divided into 100 sec bins |
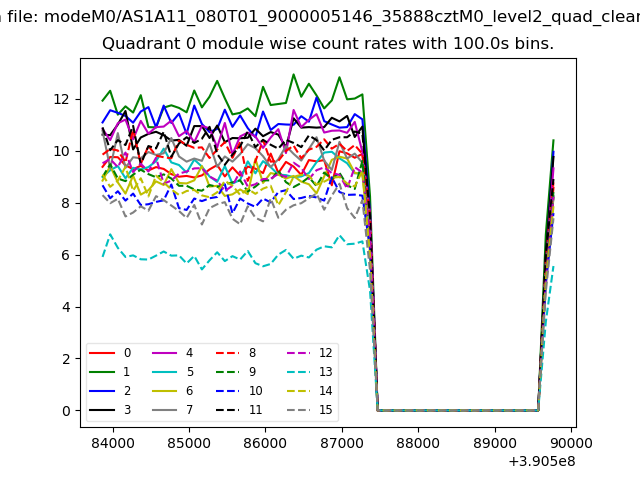 |
 |
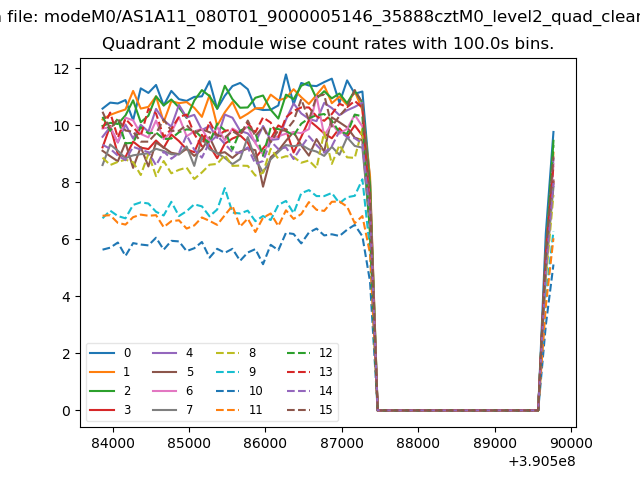
| Module-wise count rates for Quadrant B Data is divided into 100 sec bins |
 |
 |
| Module-wise count rates for Quadrant C Data is divided into 100 sec bins |
 |
 |
| Module-wise count rates for Quadrant D Data is divided into 100 sec bins |
 |
 |
| Parameter | Plot |
|---|---|
| CZT HV Monitor |  |
| D_VDD | 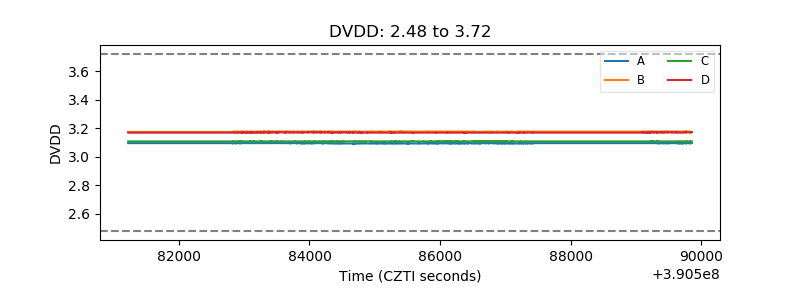 |
| Temperature 1 | 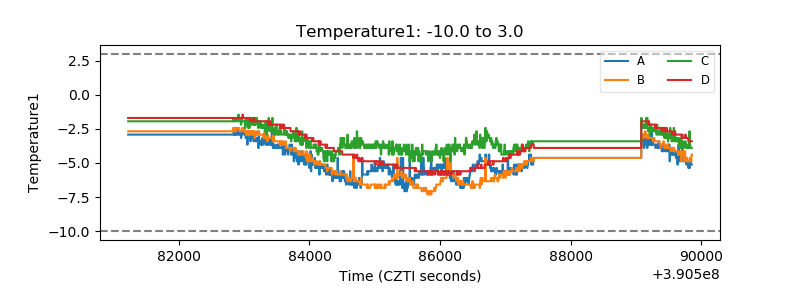 |
| Veto HV Monitor | 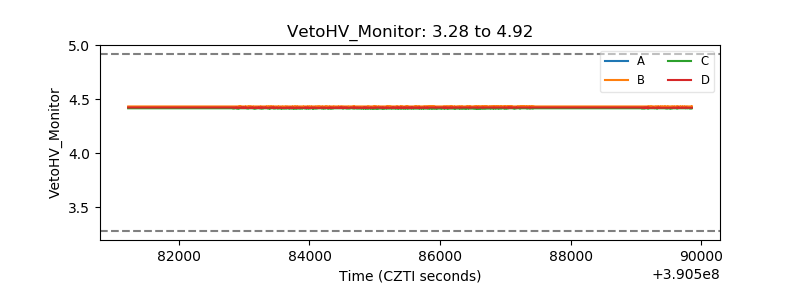 |
| Veto LLD | 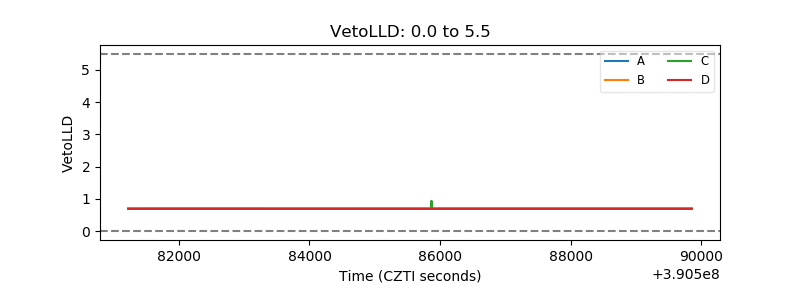 |
| Alpha Counter | 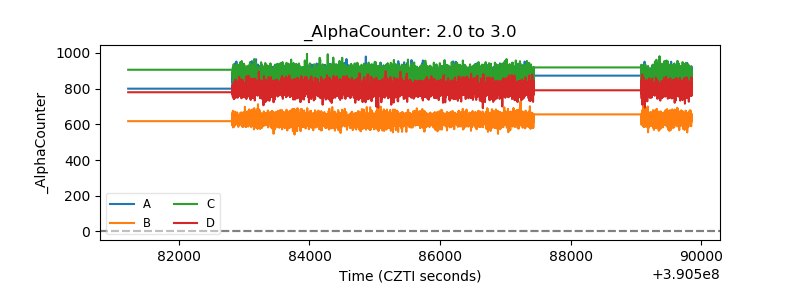 |
| _CPM_Rate | 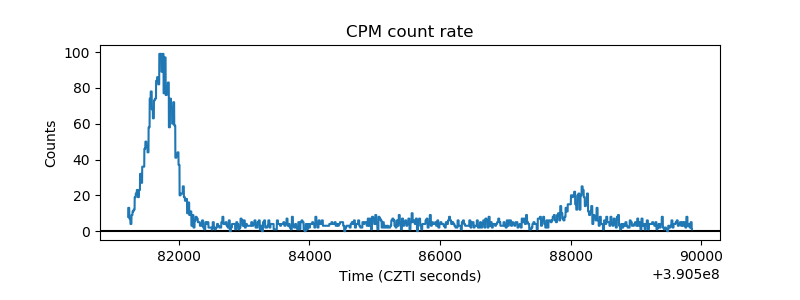 |
| CZT Counter | 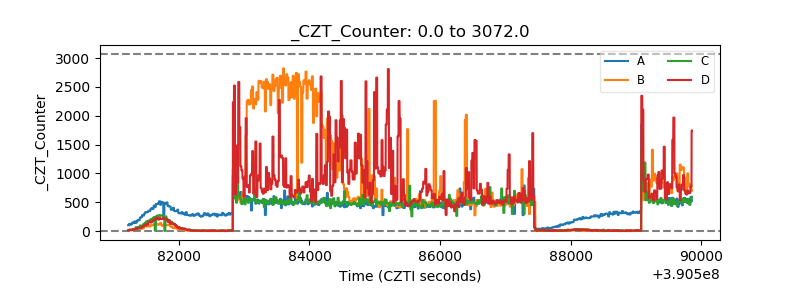 |
| +2.5 Volts monitor | 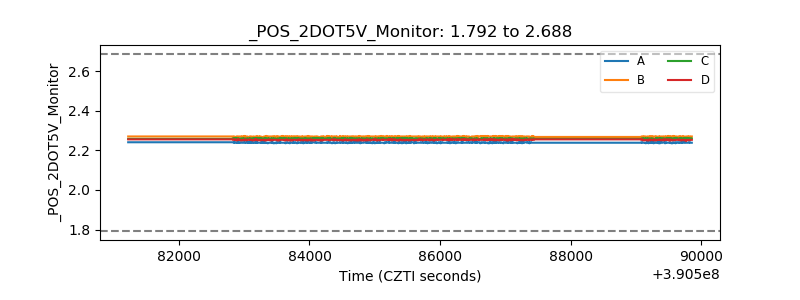 |
| +5 Volts monitor | 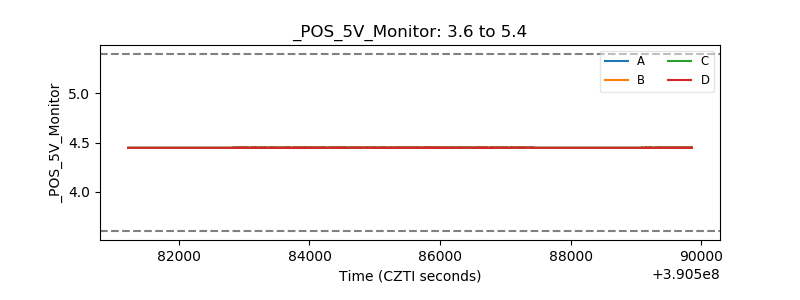 |
| _ROLL_ROT | 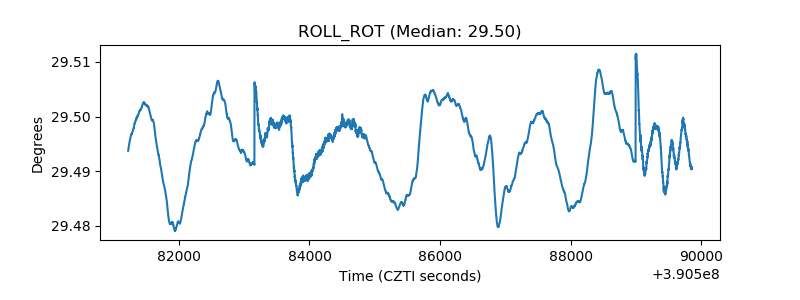 |
| _Roll_DEC | 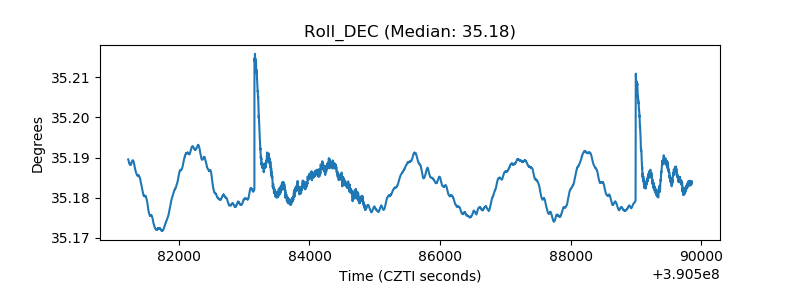 |
| _Roll_RA | 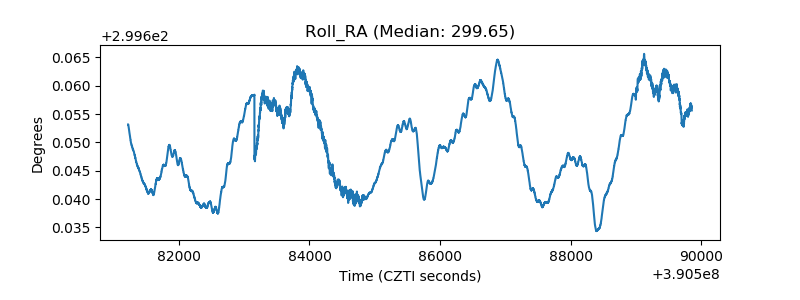 |
| Veto Counter | 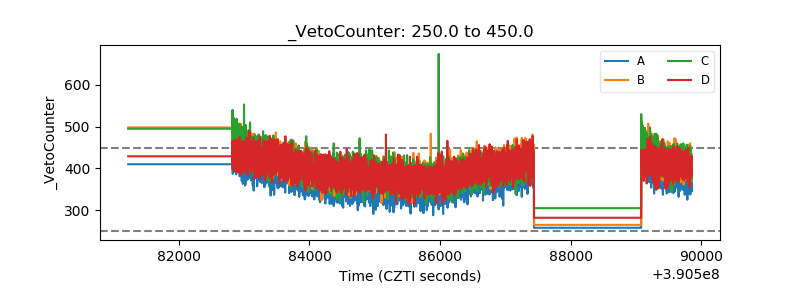 |