| Param | Original file | Final file |
|---|---|---|
| Filename | modeM0/AS1A11_080T01_9000005146_35886cztM0_level2.evt | modeM0/AS1A11_080T01_9000005146_35886cztM0_level2_quad_clean.evt |
| Size (bytes) | 526,507,200 | 56,934,720 |
| Size | 502.1 MB | 54.3 MB |
| Events in quadrant A | 2,757,691 | 370,227 |
| Events in quadrant B | 5,608,787 | 296,851 |
| Events in quadrant C | 2,965,558 | 359,617 |
| Events in quadrant D | 4,268,222 | 339,725 |
| Mode M9 | |||
|---|---|---|---|
| Quadrant | BADHDUFLAG | Total packets | Discarded packets |
| A | 0 | 31 | 0 |
| B | 0 | 31 | 0 |
| C | 0 | 31 | 0 |
| D | 0 | 32 | 0 |
| Mode SS | |||
|---|---|---|---|
| Quadrant | BADHDUFLAG | Total packets | Discarded packets |
| A | 0 | 104 | 0 |
| B | 0 | 104 | 0 |
| C | 0 | 104 | 0 |
| D | 0 | 104 | 0 |
| Mode M0 | |||
|---|---|---|---|
| Quadrant | BADHDUFLAG | Total packets | Discarded packets |
| A | 0 | 10956 | 3 |
| B | 0 | 19938 | 2 |
| C | 0 | 11517 | 2 |
| D | 0 | 16276 | 2 |
| Quadrant | Total seconds | Saturated seconds | Saturation percentage |
|---|---|---|---|
| A | 5093 | 12 | 0.235618% |
| B | 5093 | 1166 | 22.894168% |
| C | 5093 | 66 | 1.295896% |
| D | 5093 | 273 | 5.360298% |
Noise dominated data is calculated using 1-second bins in cleaned event files. If a bin has >2000 counts, and if more than 50% of those come from <1% of pixels, then it is considered to be noise-dominated and hence unusable.
| Quadrant | # 1 sec bins | Bins with >0 counts | Bins with >2000 counts | High rate bins dominated by noise | Noise dominated (total time) | Noise dominated (detector-on time) | Marked lightcurve |
|---|---|---|---|---|---|---|---|
| A | 7216 | 5094 | 1 | 1 | 0.01% | 0.02% | 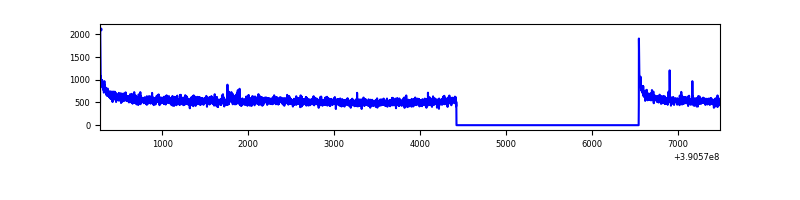 |
| B | 7216 | 5094 | 1038 | 1038 | 14.38% | 20.38% | 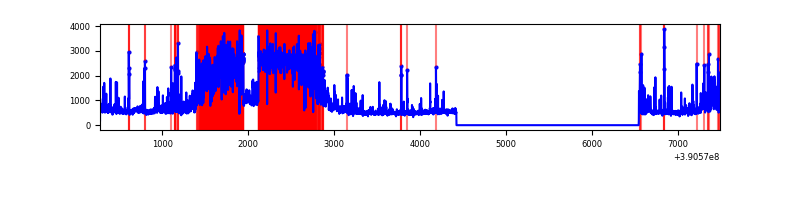 |
| C | 7216 | 5094 | 53 | 53 | 0.73% | 1.04% | 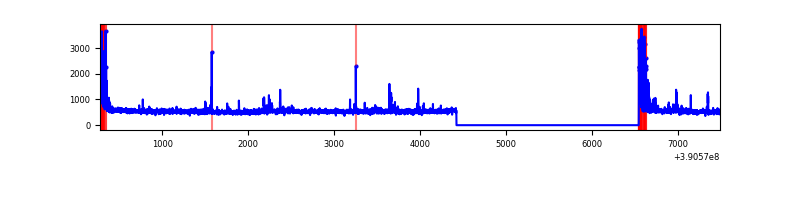 |
| D | 7216 | 5094 | 243 | 243 | 3.37% | 4.77% | 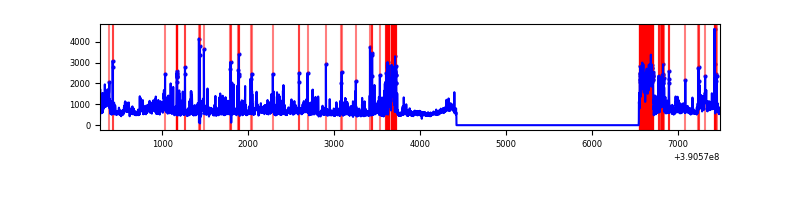 |
Top three noisy pixels from each quadrant. If the there are fewer than three noisy pixels in the level2.evt file, extra rows are filled as -1
| Pixel properties | Quadrant properties | ||||||
|---|---|---|---|---|---|---|---|
| Quadrant | DetID | PixID | Counts | Sigma | Mean | Median | Sigma |
| A | 10 | 83 | 164175 | 1230.7 | 660 | 651 | 132.9 |
| A | 15 | 169 | 19803 | 144.14 | 660 | 651 | 132.9 |
| A | 13 | 6 | 13002 | 92.96 | 660 | 651 | 132.9 |
| B | 5 | 63 | 2819035 | 25938.12 | 573 | 560 | 108.7 |
| B | 5 | 172 | 349231 | 3208.78 | 573 | 560 | 108.7 |
| B | 5 | 255 | 67868 | 619.42 | 573 | 560 | 108.7 |
| C | 0 | 10 | 219233 | 1510.16 | 627 | 633 | 144.8 |
| C | 15 | 214 | 213730 | 1472.14 | 627 | 633 | 144.8 |
| C | 0 | 207 | 45733 | 311.57 | 627 | 633 | 144.8 |
| D | 12 | 227 | 392486 | 2538.25 | 626 | 611 | 154.4 |
| D | 2 | 249 | 357346 | 2310.64 | 626 | 611 | 154.4 |
| D | 8 | 195 | 346959 | 2243.36 | 626 | 611 | 154.4 |
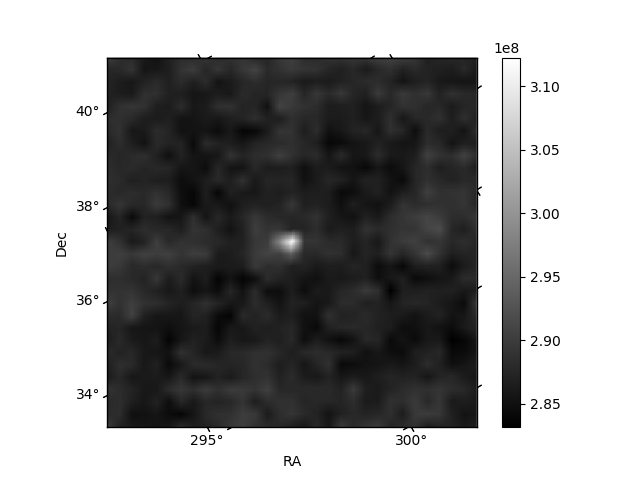
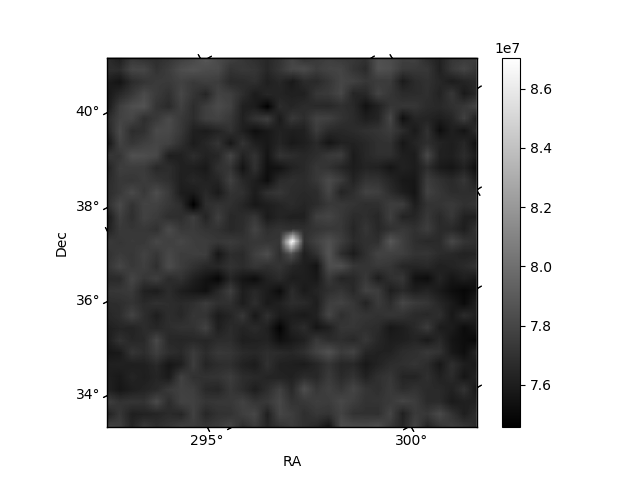
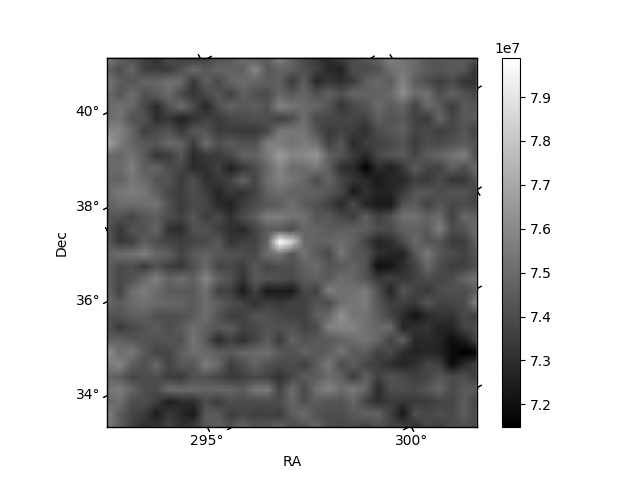
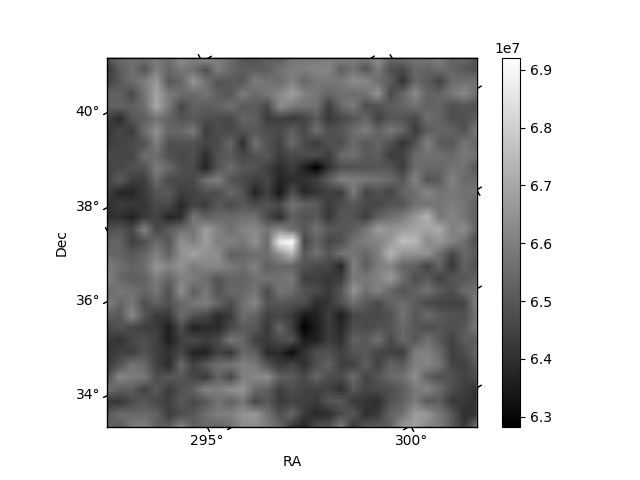
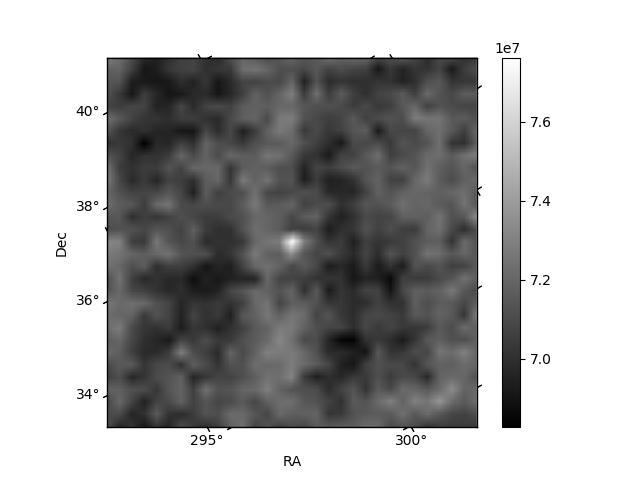
Histogram calculated using DETX and DETY for each event in the final _common_clean file
| Quadrant A | 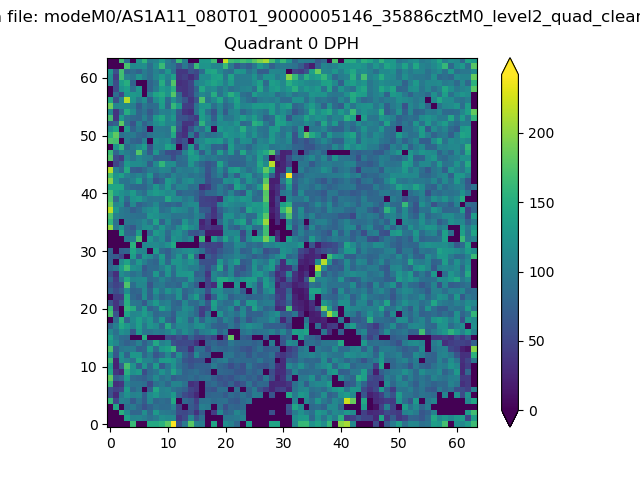 |
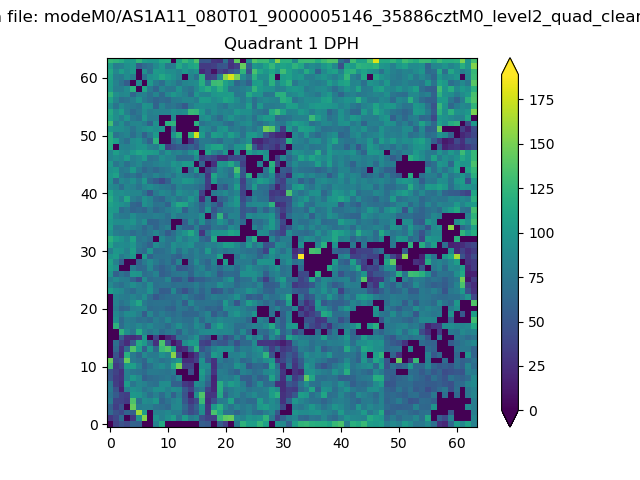 |
Quadrant B |
|---|---|---|---|
| Quadrant D |  |
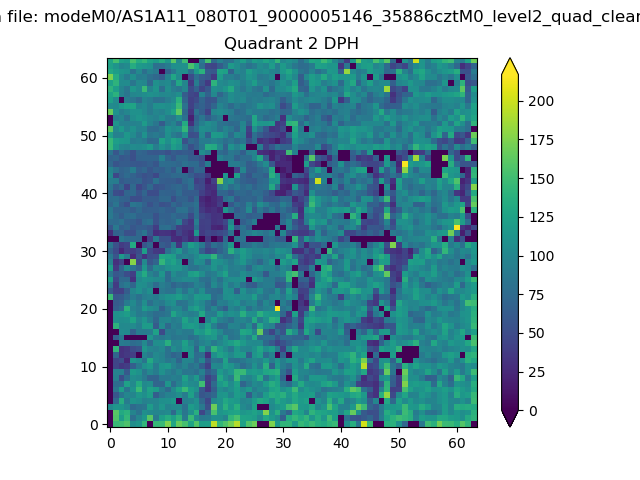 |
Quadrant C |
| Plot type | Count rate plots | Images |
|---|---|---|
| Comparison with Poisson distribution Blue bars denote a histogram of data divided into 1 sec bins. Red curve is a Poisson curve with rate = median count rate of data. |
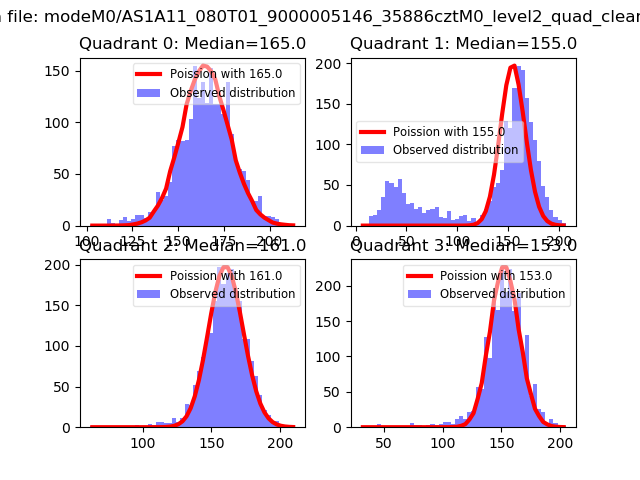 |
 |
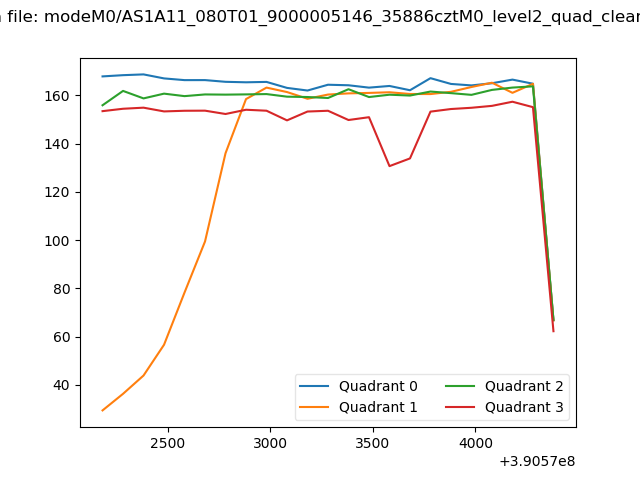
| Quadrant-wise count rates Data is divided into 100 sec bins |
 |
|
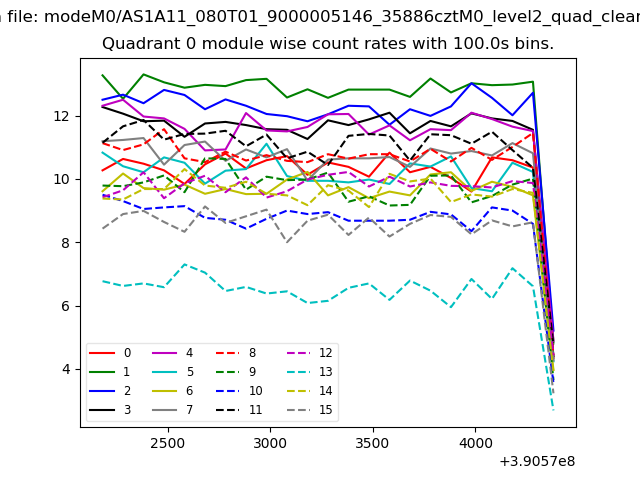
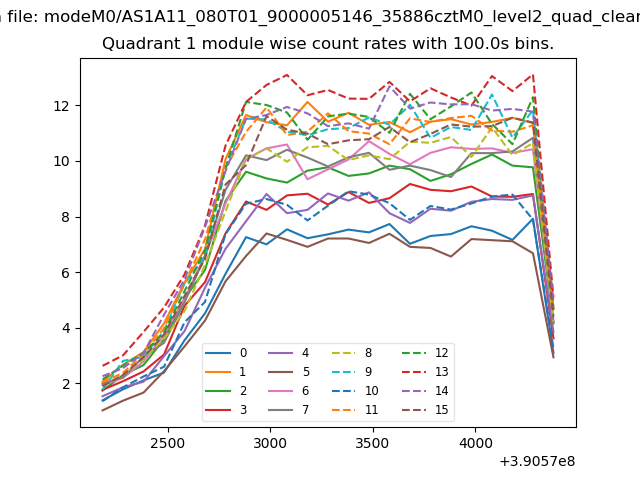
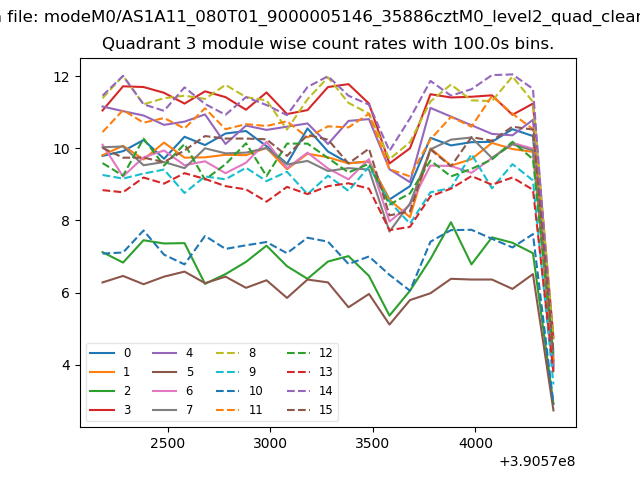
| Module-wise count rates for Quadrant A Data is divided into 100 sec bins |
 |
 |
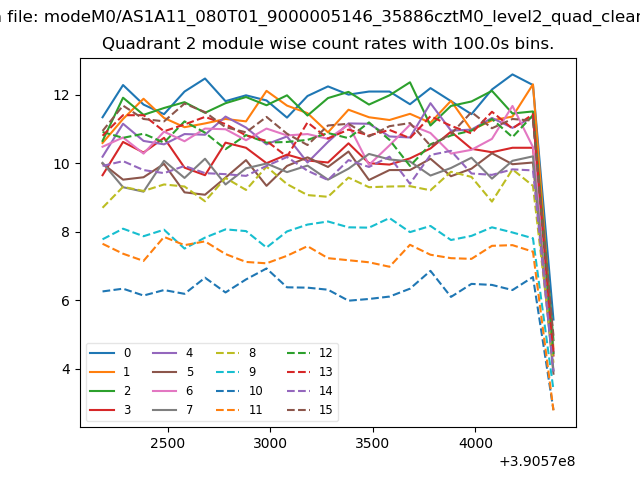
| Module-wise count rates for Quadrant B Data is divided into 100 sec bins |
 |
 |
| Module-wise count rates for Quadrant C Data is divided into 100 sec bins |
 |
 |
| Module-wise count rates for Quadrant D Data is divided into 100 sec bins |
 |
 |
| Parameter | Plot |
|---|---|
| CZT HV Monitor | 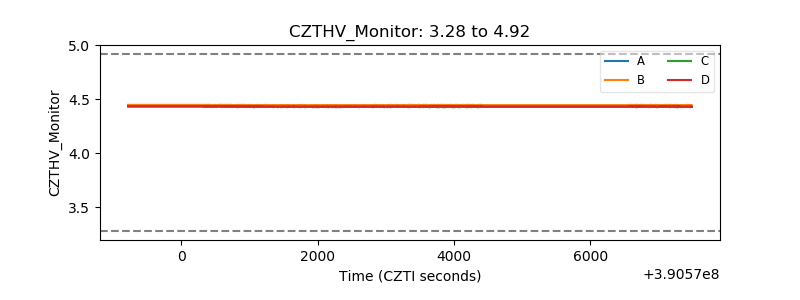 |
| D_VDD | 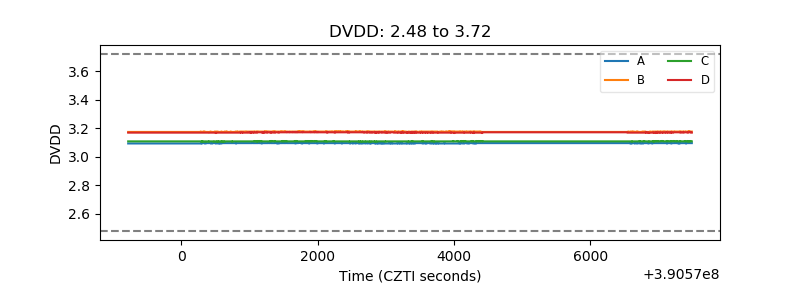 |
| Temperature 1 |  |
| Veto HV Monitor | 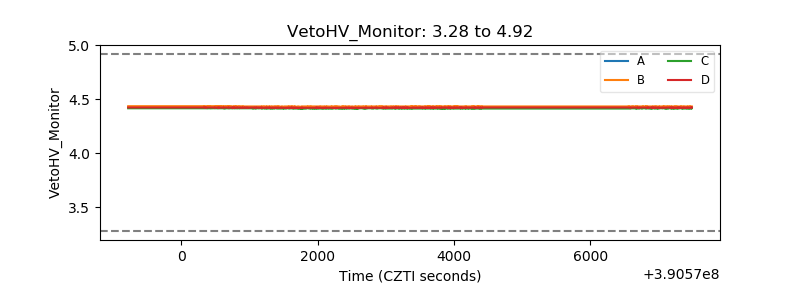 |
| Veto LLD | 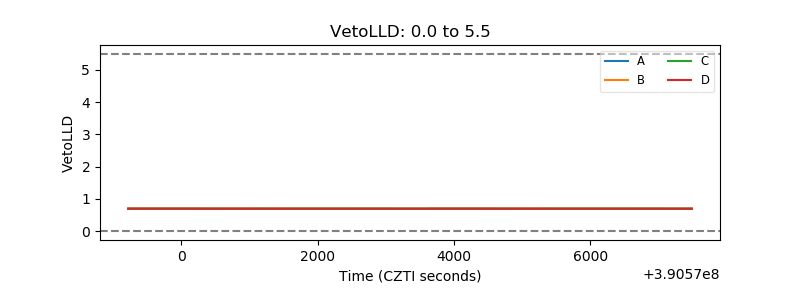 |
| Alpha Counter | 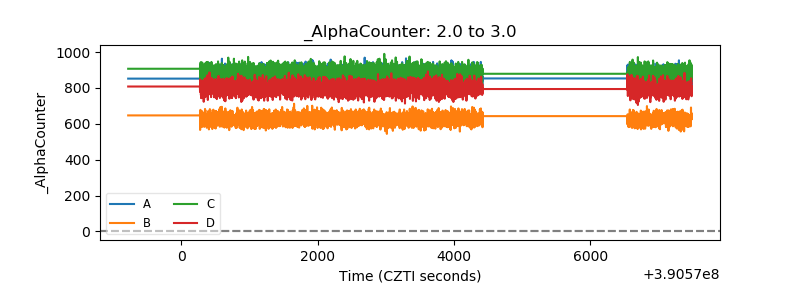 |
| _CPM_Rate | 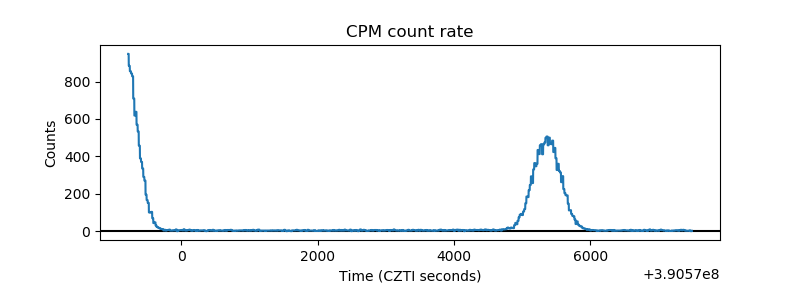 |
| CZT Counter | 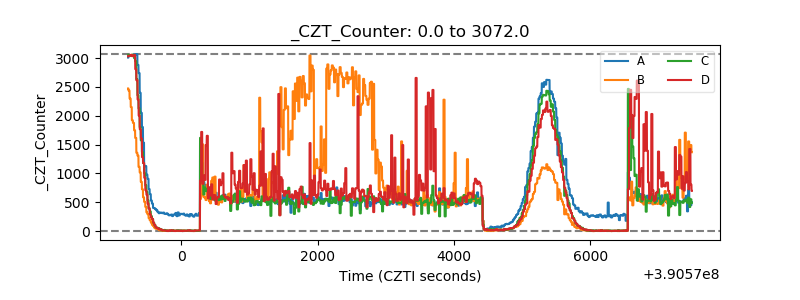 |
| +2.5 Volts monitor | 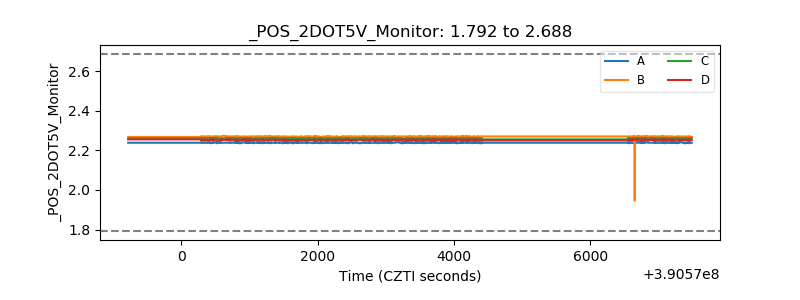 |
| +5 Volts monitor | 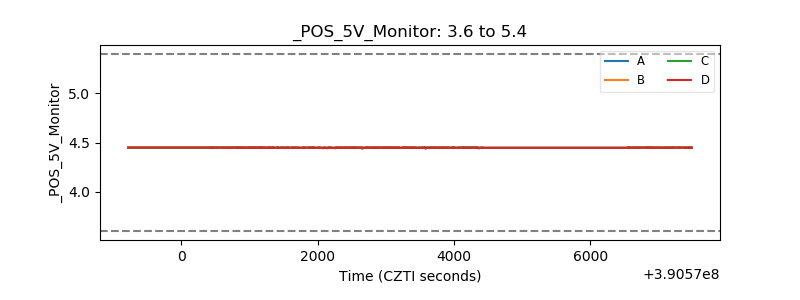 |
| _ROLL_ROT | 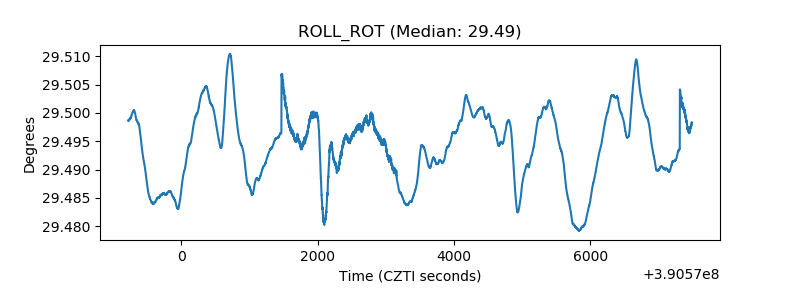 |
| _Roll_DEC | 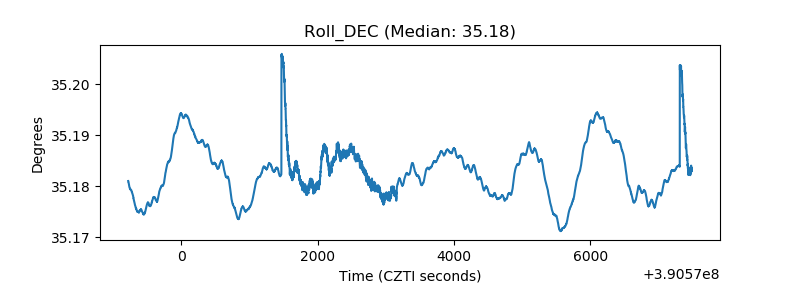 |
| _Roll_RA | 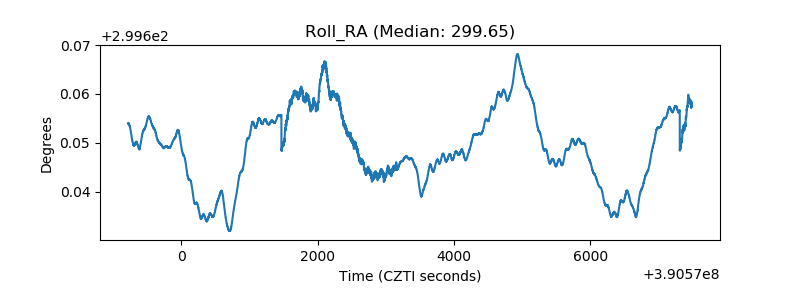 |
| Veto Counter |  |