| Param | Original file | Final file |
|---|---|---|
| Filename | modeM0/AS1A11_080T01_9000005146_35874cztM0_level2.evt | modeM0/AS1A11_080T01_9000005146_35874cztM0_level2_quad_clean.evt |
| Size (bytes) | 1,088,452,800 | 231,785,280 |
| Size | 1.0 GB | 221.0 MB |
| Events in quadrant A | 8,051,104 | 1,559,815 |
| Events in quadrant B | 7,940,635 | 1,536,062 |
| Events in quadrant C | 7,594,718 | 1,533,108 |
| Events in quadrant D | 8,471,201 | 1,464,208 |
| Mode M9 | |||
|---|---|---|---|
| Quadrant | BADHDUFLAG | Total packets | Discarded packets |
| A | 0 | 54 | 0 |
| B | 0 | 54 | 0 |
| C | 0 | 54 | 0 |
| D | 0 | 54 | 0 |
| Mode SS | |||
|---|---|---|---|
| Quadrant | BADHDUFLAG | Total packets | Discarded packets |
| A | 0 | 274 | 0 |
| B | 0 | 274 | 0 |
| C | 0 | 274 | 0 |
| D | 0 | 274 | 0 |
| Mode M0 | |||
|---|---|---|---|
| Quadrant | BADHDUFLAG | Total packets | Discarded packets |
| A | 0 | 32340 | 5 |
| B | 0 | 31583 | 3 |
| C | 0 | 30011 | 3 |
| D | 0 | 34180 | 3 |
| Quadrant | Total seconds | Saturated seconds | Saturation percentage |
|---|---|---|---|
| A | 13431 | 52 | 0.387164% |
| B | 13431 | 302 | 2.248530% |
| C | 13431 | 211 | 1.570992% |
| D | 13431 | 174 | 1.295510% |
Noise dominated data is calculated using 1-second bins in cleaned event files. If a bin has >2000 counts, and if more than 50% of those come from <1% of pixels, then it is considered to be noise-dominated and hence unusable.
| Quadrant | # 1 sec bins | Bins with >0 counts | Bins with >2000 counts | High rate bins dominated by noise | Noise dominated (total time) | Noise dominated (detector-on time) | Marked lightcurve |
|---|---|---|---|---|---|---|---|
| A | 18779 | 13435 | 26 | 26 | 0.14% | 0.19% | 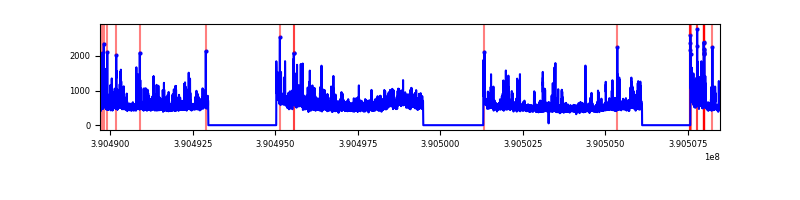 |
| B | 18779 | 13435 | 214 | 214 | 1.14% | 1.59% | 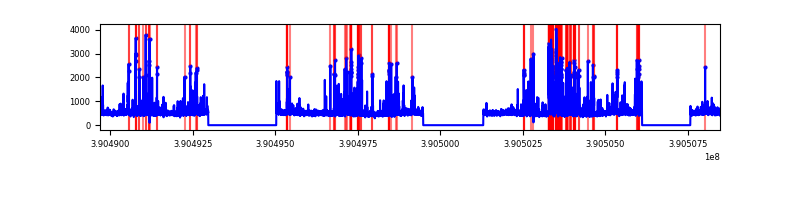 |
| C | 18779 | 13435 | 173 | 173 | 0.92% | 1.29% | 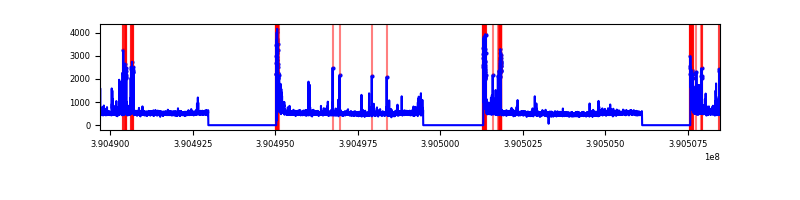 |
| D | 18779 | 13435 | 139 | 139 | 0.74% | 1.03% | 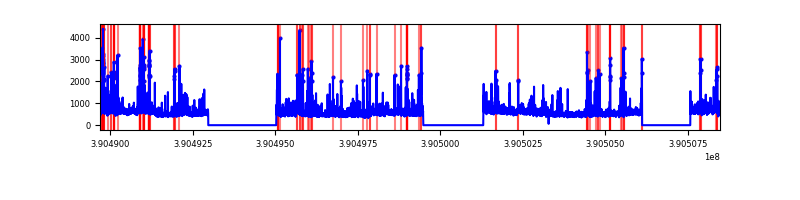 |
Top three noisy pixels from each quadrant. If the there are fewer than three noisy pixels in the level2.evt file, extra rows are filled as -1
| Pixel properties | Quadrant properties | ||||||
|---|---|---|---|---|---|---|---|
| Quadrant | DetID | PixID | Counts | Sigma | Mean | Median | Sigma |
| A | 7 | 48 | 881507 | 2666.47 | 1637 | 1613 | 330.0 |
| A | 15 | 169 | 483705 | 1460.95 | 1637 | 1613 | 330.0 |
| A | 10 | 83 | 318870 | 961.43 | 1637 | 1613 | 330.0 |
| B | 5 | 172 | 1243227 | 4087.43 | 1607 | 1569 | 303.8 |
| B | 5 | 255 | 131561 | 427.92 | 1607 | 1569 | 303.8 |
| B | 15 | 85 | 51674 | 164.94 | 1607 | 1569 | 303.8 |
| C | 15 | 214 | 546163 | 1487.16 | 1583 | 1605 | 366.2 |
| C | 0 | 10 | 345055 | 937.95 | 1583 | 1605 | 366.2 |
| C | 1 | 23 | 309292 | 840.28 | 1583 | 1605 | 366.2 |
| D | 8 | 195 | 1052227 | 2715.31 | 1586 | 1547 | 386.9 |
| D | 13 | 249 | 422508 | 1087.9 | 1586 | 1547 | 386.9 |
| D | 7 | 223 | 243777 | 626.0 | 1586 | 1547 | 386.9 |
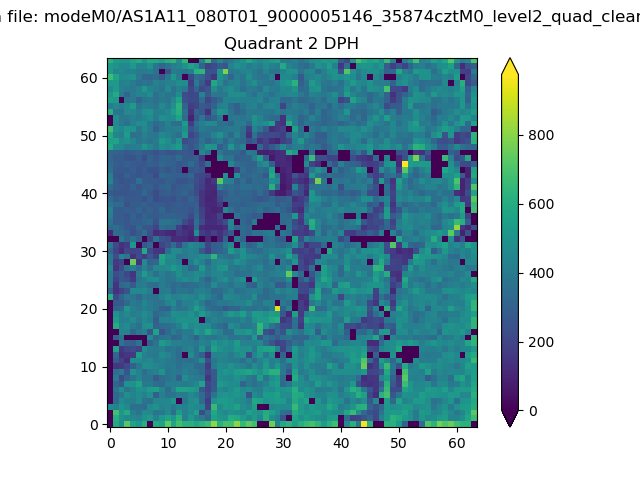
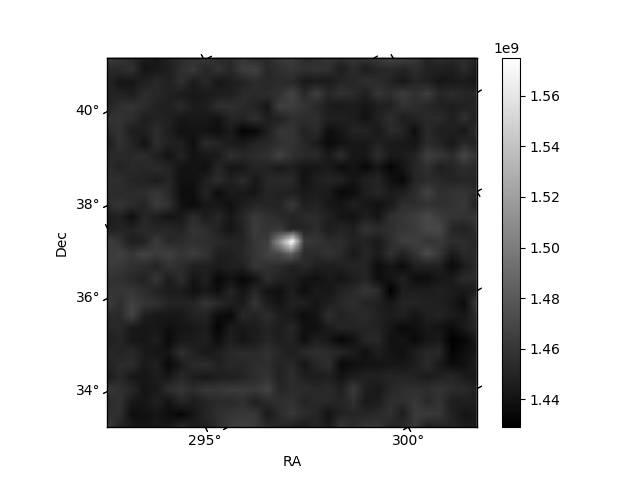
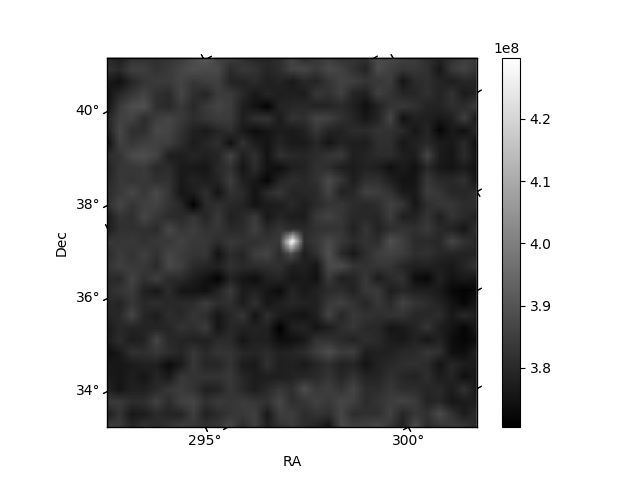
Histogram calculated using DETX and DETY for each event in the final _common_clean file
| Quadrant A | 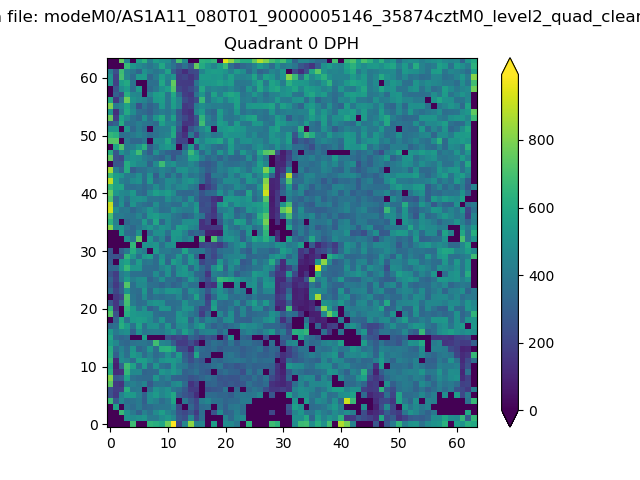 |
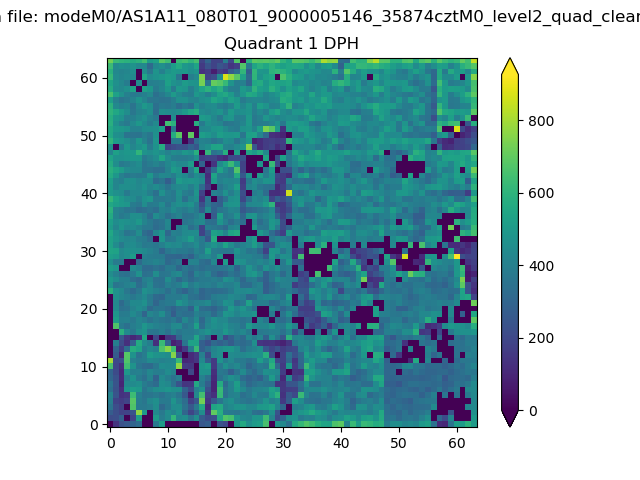 |
Quadrant B |
|---|---|---|---|
| Quadrant D | 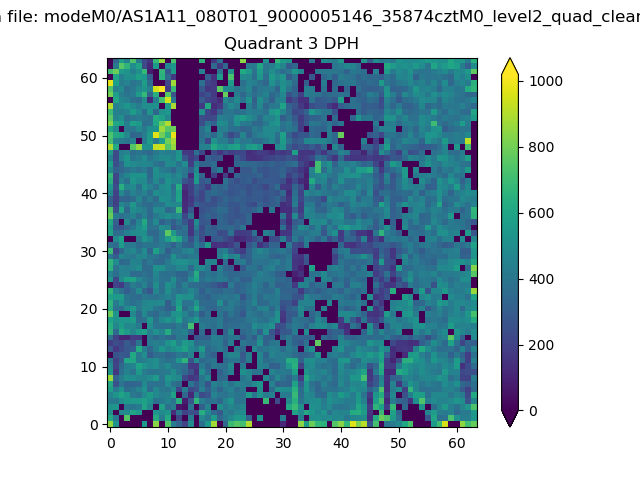 |
 |
Quadrant C |
| Plot type | Count rate plots | Images |
|---|---|---|
| Comparison with Poisson distribution Blue bars denote a histogram of data divided into 1 sec bins. Red curve is a Poisson curve with rate = median count rate of data. |
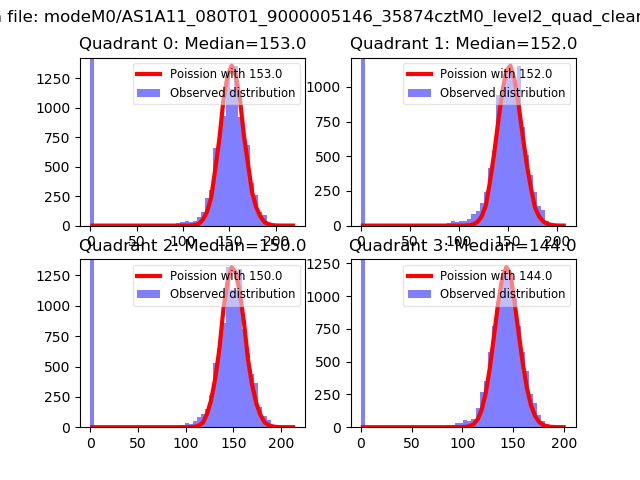 |
 |
| Quadrant-wise count rates Data is divided into 100 sec bins |
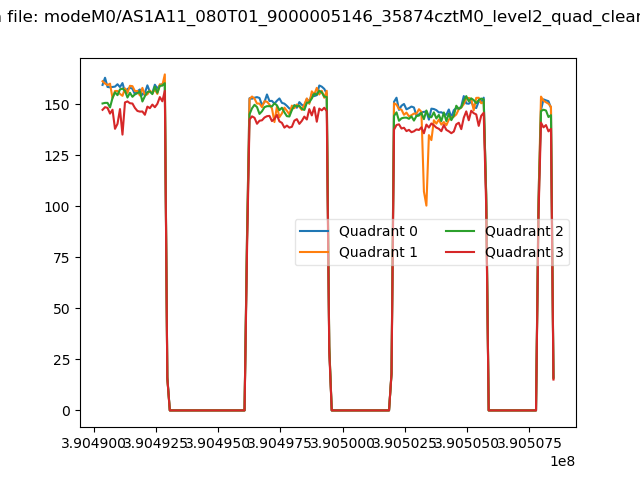 |
|
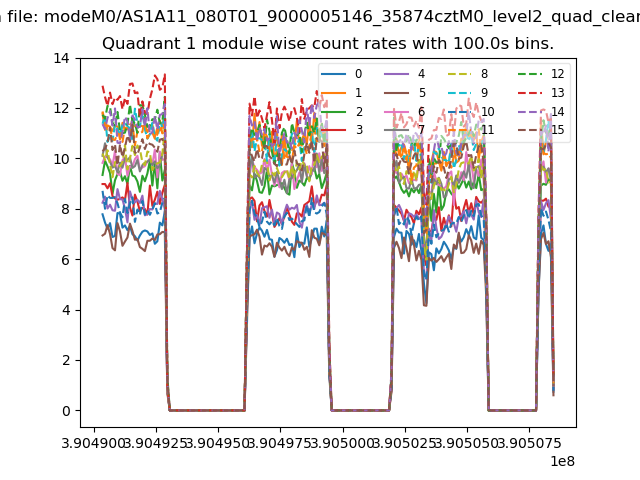
| Module-wise count rates for Quadrant A Data is divided into 100 sec bins |
 |
 |
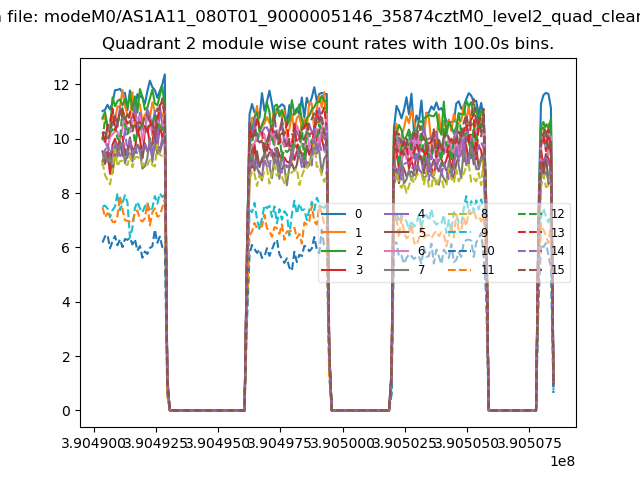
| Module-wise count rates for Quadrant B Data is divided into 100 sec bins |
 |
 |
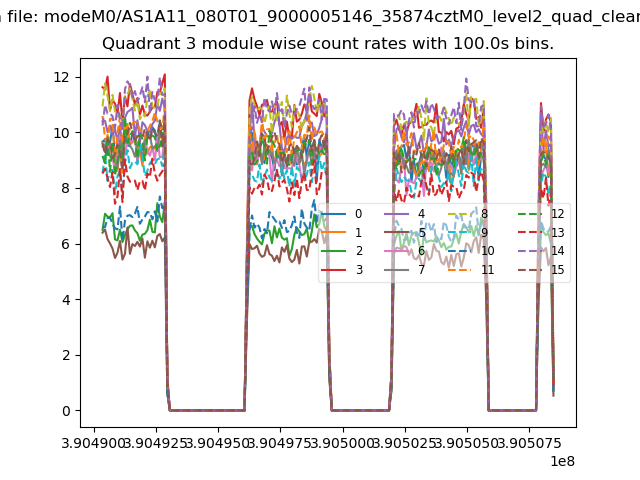
| Module-wise count rates for Quadrant C Data is divided into 100 sec bins |
 |
 |
| Module-wise count rates for Quadrant D Data is divided into 100 sec bins |
 |
 |
| Parameter | Plot |
|---|---|
| CZT HV Monitor | 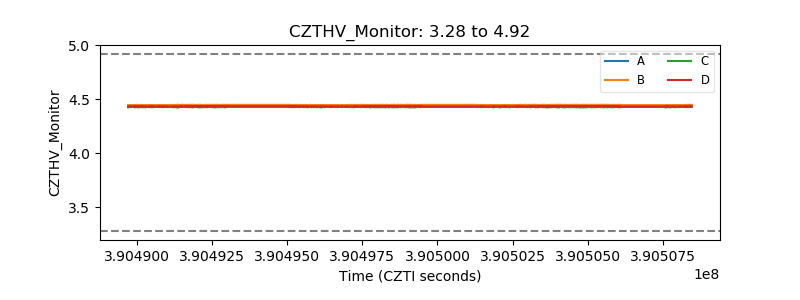 |
| D_VDD | 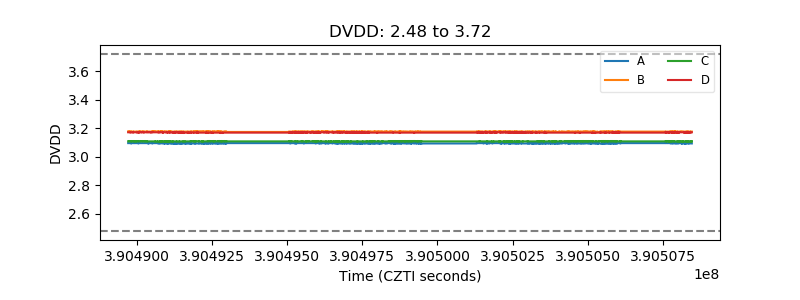 |
| Temperature 1 | 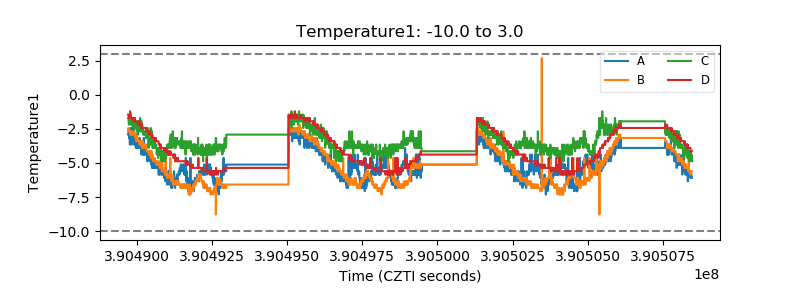 |
| Veto HV Monitor | 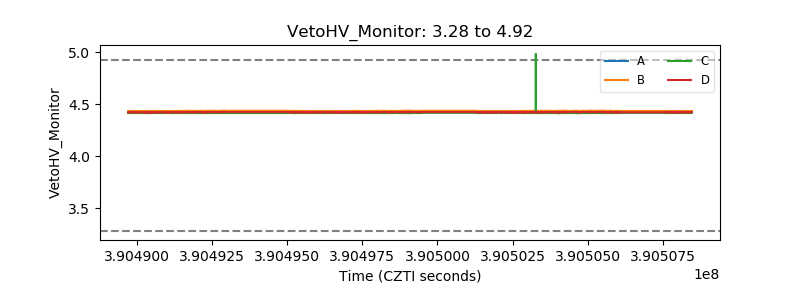 |
| Veto LLD | 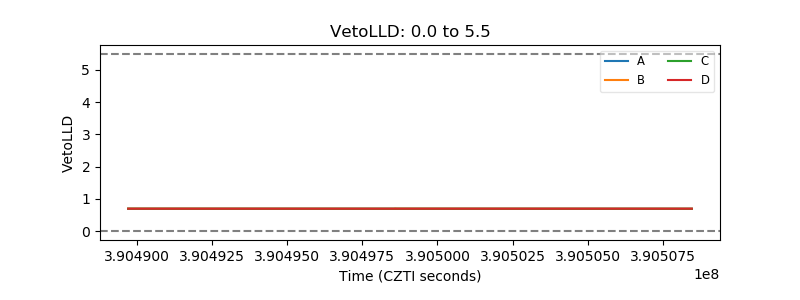 |
| Alpha Counter | 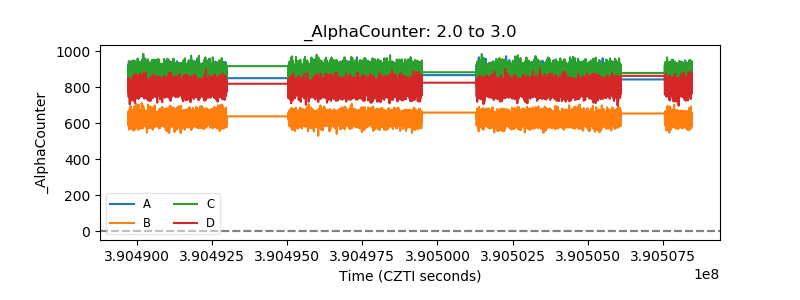 |
| _CPM_Rate | 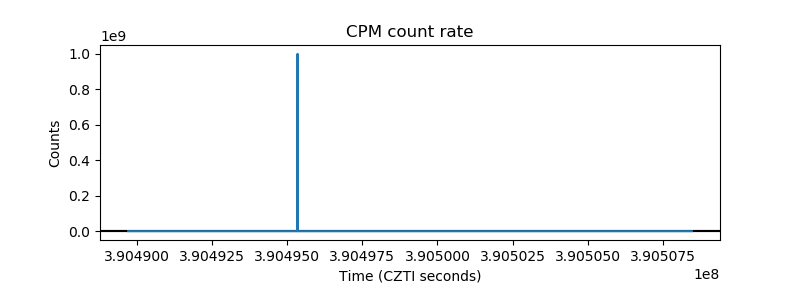 |
| CZT Counter | 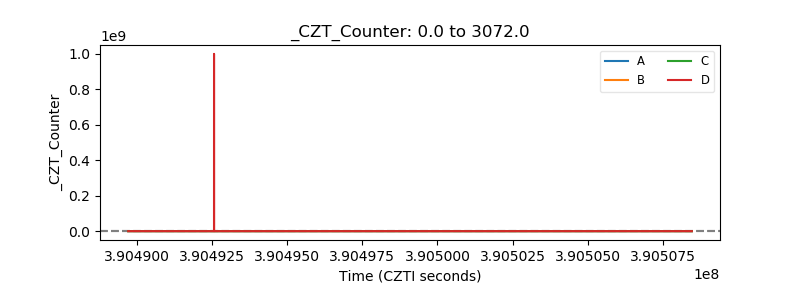 |
| +2.5 Volts monitor | 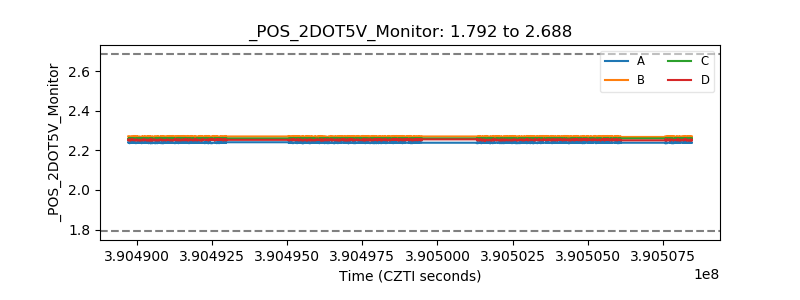 |
| +5 Volts monitor | 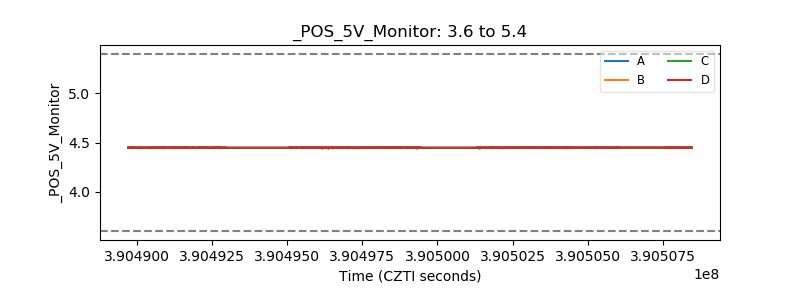 |
| _ROLL_ROT | 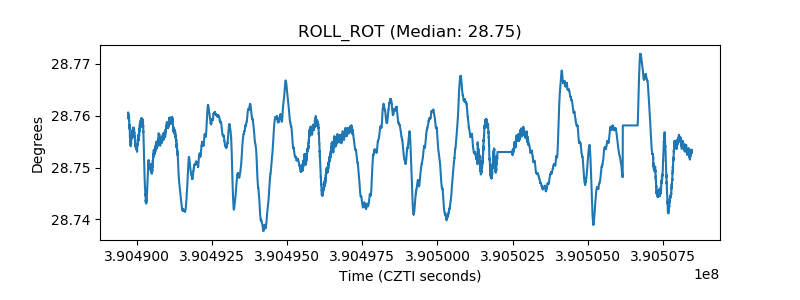 |
| _Roll_DEC | 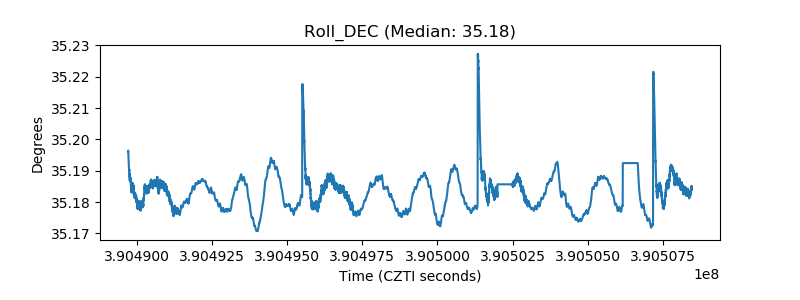 |
| _Roll_RA | 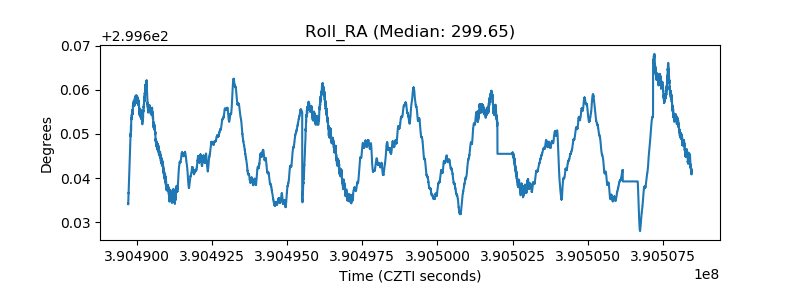 |
| Veto Counter | 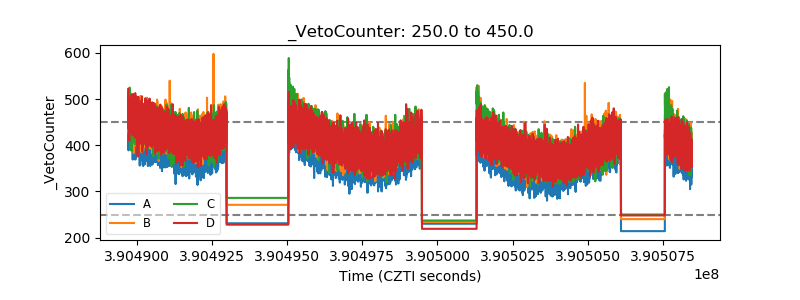 |