| Param | Original file | Final file |
|---|---|---|
| Filename | modeM0/AS1A11_080T01_9000005146_35861cztM0_level2.evt | modeM0/AS1A11_080T01_9000005146_35861cztM0_level2_quad_clean.evt |
| Size (bytes) | 723,271,680 | 96,629,760 |
| Size | 689.8 MB | 92.2 MB |
| Events in quadrant A | 10,391,571 | 479,450 |
| Events in quadrant B | 3,639,205 | 680,676 |
| Events in quadrant C | 3,546,195 | 679,152 |
| Events in quadrant D | 3,903,992 | 648,939 |
| Mode M9 | |||
|---|---|---|---|
| Quadrant | BADHDUFLAG | Total packets | Discarded packets |
| A | 0 | 26 | 0 |
| B | 0 | 26 | 0 |
| C | 0 | 26 | 0 |
| D | 0 | 26 | 0 |
| Mode SS | |||
|---|---|---|---|
| Quadrant | BADHDUFLAG | Total packets | Discarded packets |
| A | 0 | 130 | 0 |
| B | 0 | 130 | 0 |
| C | 0 | 130 | 0 |
| D | 0 | 130 | 0 |
| Mode M0 | |||
|---|---|---|---|
| Quadrant | BADHDUFLAG | Total packets | Discarded packets |
| A | 0 | 34989 | 3 |
| B | 0 | 14703 | 2 |
| C | 0 | 14207 | 2 |
| D | 0 | 15650 | 2 |
| Quadrant | Total seconds | Saturated seconds | Saturation percentage |
|---|---|---|---|
| A | 6248 | 3142 | 50.288092% |
| B | 6248 | 165 | 2.640845% |
| C | 6248 | 107 | 1.712548% |
| D | 6248 | 102 | 1.632522% |
Noise dominated data is calculated using 1-second bins in cleaned event files. If a bin has >2000 counts, and if more than 50% of those come from <1% of pixels, then it is considered to be noise-dominated and hence unusable.
| Quadrant | # 1 sec bins | Bins with >0 counts | Bins with >2000 counts | High rate bins dominated by noise | Noise dominated (total time) | Noise dominated (detector-on time) | Marked lightcurve |
|---|---|---|---|---|---|---|---|
| A | 8935 | 6250 | 2971 | 2971 | 33.25% | 47.54% | 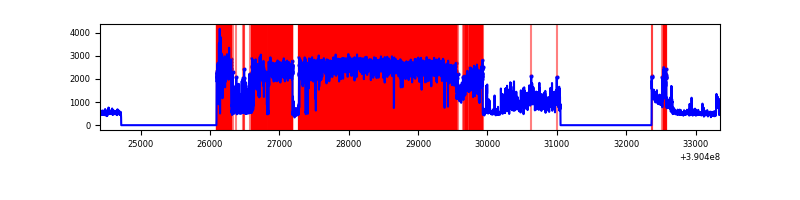 |
| B | 8935 | 6250 | 92 | 92 | 1.03% | 1.47% |  |
| C | 8935 | 6250 | 73 | 73 | 0.82% | 1.17% | 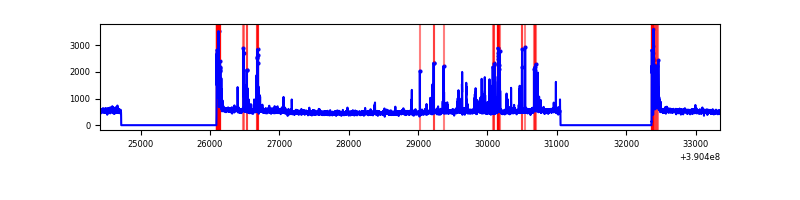 |
| D | 8935 | 6250 | 79 | 79 | 0.88% | 1.26% | 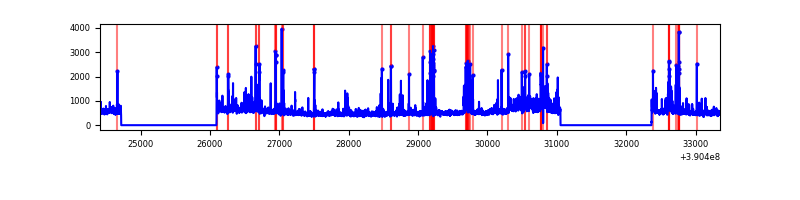 |
Top three noisy pixels from each quadrant. If the there are fewer than three noisy pixels in the level2.evt file, extra rows are filled as -1
| Pixel properties | Quadrant properties | ||||||
|---|---|---|---|---|---|---|---|
| Quadrant | DetID | PixID | Counts | Sigma | Mean | Median | Sigma |
| A | 15 | 169 | 7854963 | 62036.19 | 610 | 598 | 126.6 |
| A | 10 | 83 | 137975 | 1085.05 | 610 | 598 | 126.6 |
| A | 7 | 48 | 31598 | 244.85 | 610 | 598 | 126.6 |
| B | 5 | 172 | 386572 | 2756.3 | 735 | 720 | 140.0 |
| B | 0 | 213 | 243955 | 1737.53 | 735 | 720 | 140.0 |
| B | 4 | 232 | 37300 | 261.31 | 735 | 720 | 140.0 |
| C | 1 | 23 | 260902 | 1538.68 | 724 | 731 | 169.1 |
| C | 15 | 214 | 258502 | 1524.49 | 724 | 731 | 169.1 |
| C | 0 | 10 | 177675 | 1046.47 | 724 | 731 | 169.1 |
| D | 13 | 249 | 347651 | 1960.96 | 724 | 708 | 176.9 |
| D | 8 | 195 | 330538 | 1864.23 | 724 | 708 | 176.9 |
| D | 10 | 118 | 173943 | 979.14 | 724 | 708 | 176.9 |
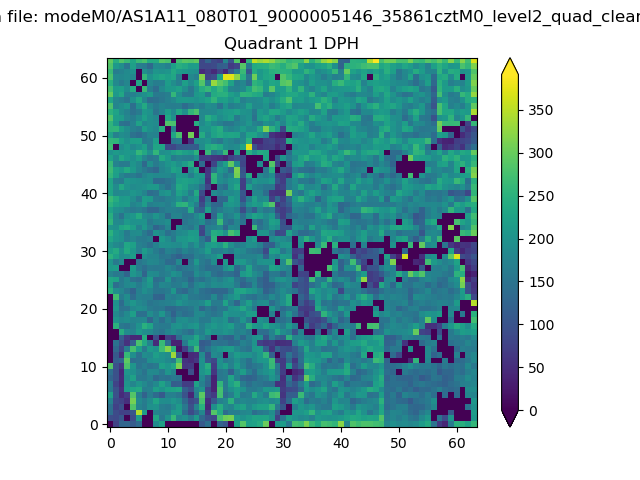
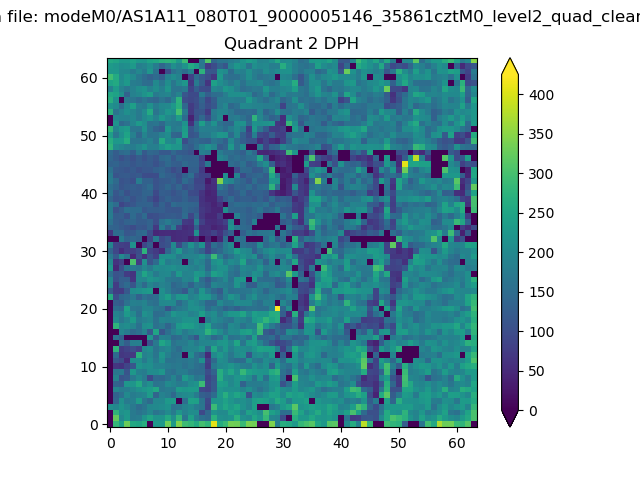
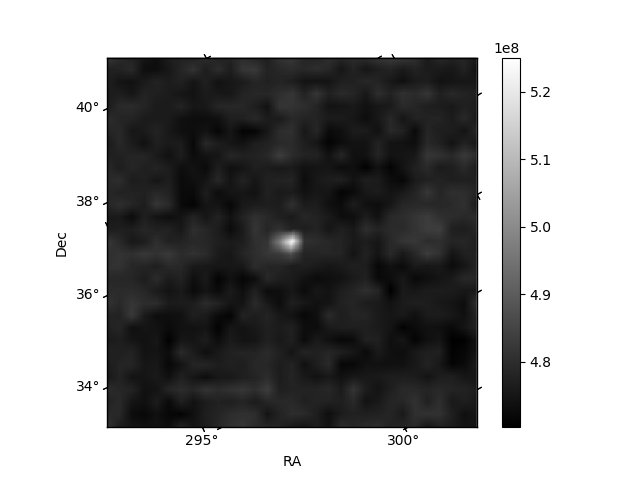
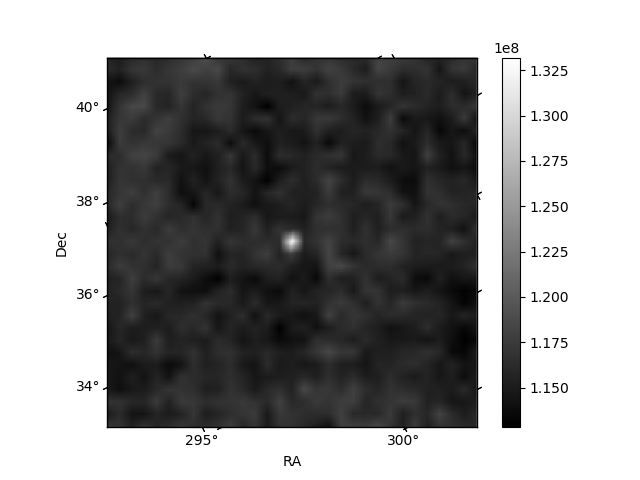
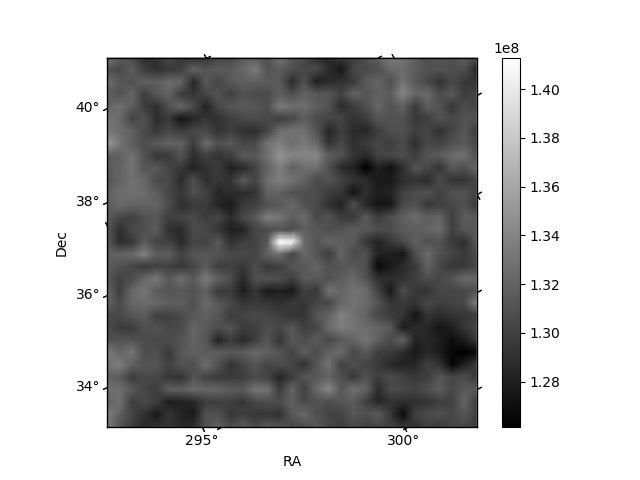
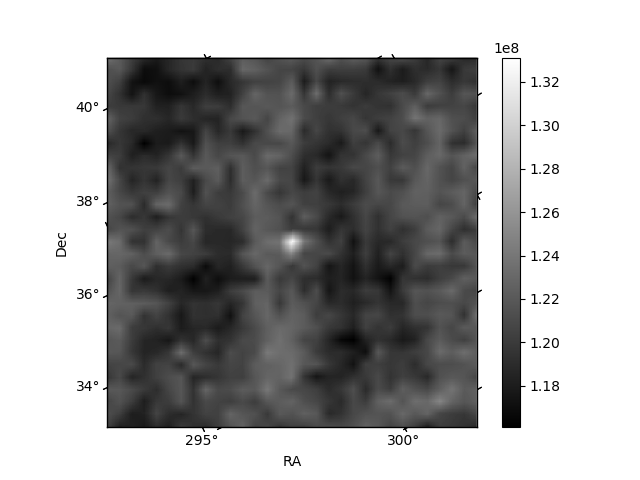
Histogram calculated using DETX and DETY for each event in the final _common_clean file
| Quadrant A | 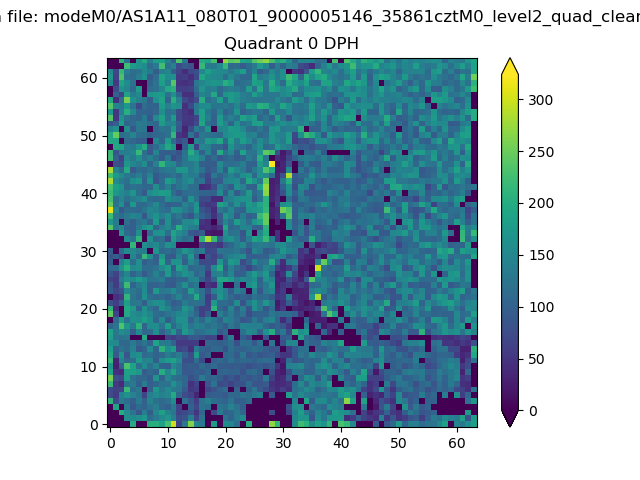 |
 |
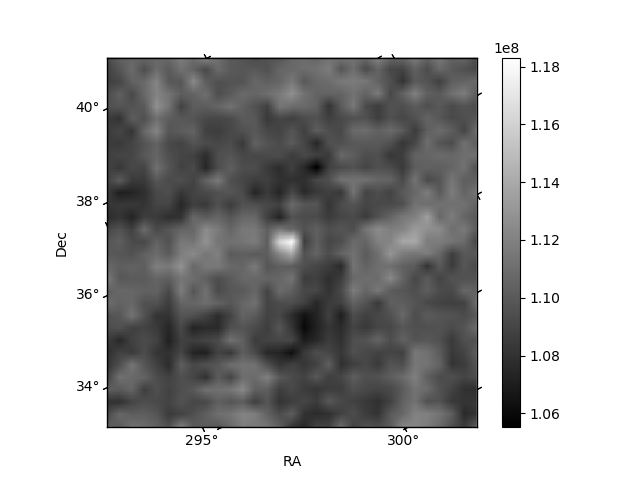
Quadrant B |
|---|---|---|---|
| Quadrant D | 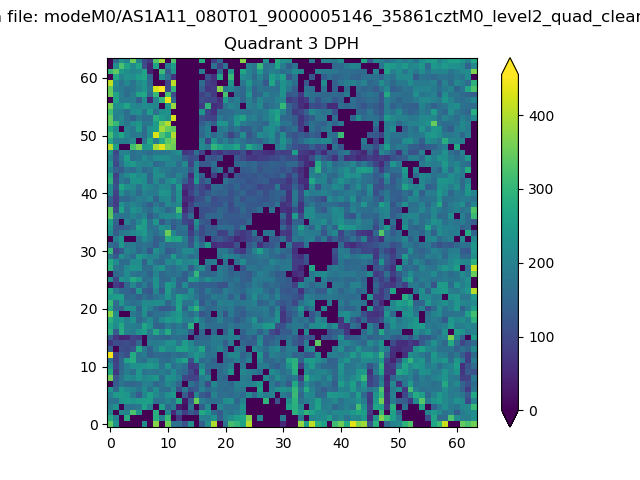 |
 |
Quadrant C |
| Plot type | Count rate plots | Images |
|---|---|---|
| Comparison with Poisson distribution Blue bars denote a histogram of data divided into 1 sec bins. Red curve is a Poisson curve with rate = median count rate of data. |
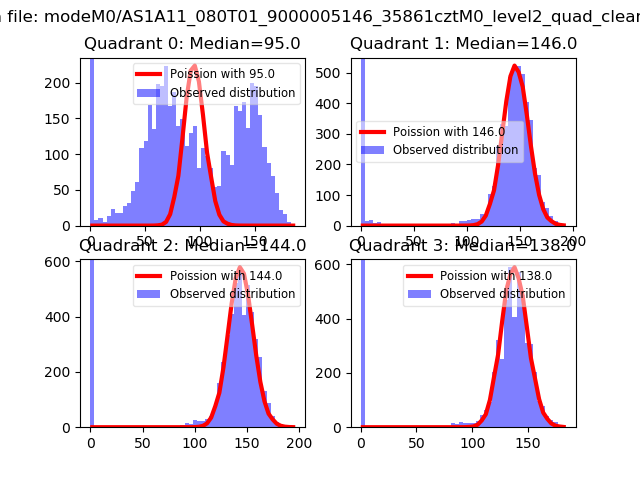 |
 |
| Quadrant-wise count rates Data is divided into 100 sec bins |
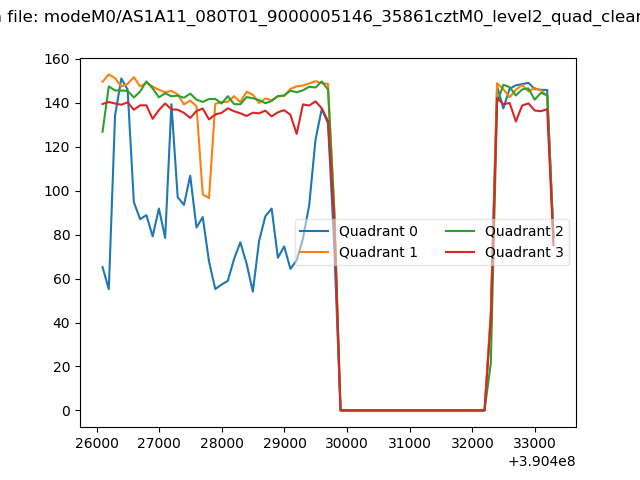 |
|
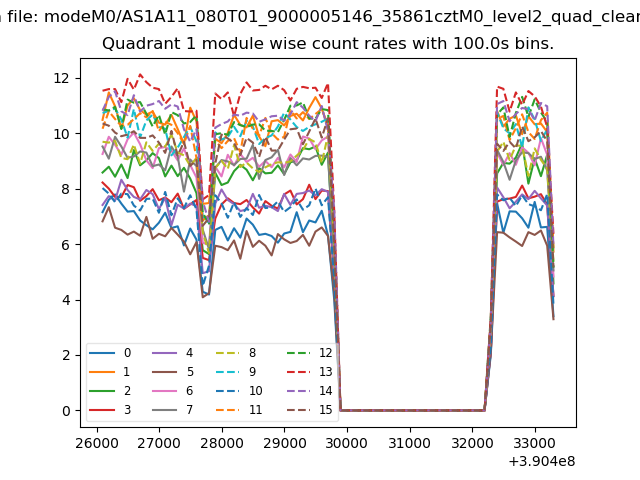
| Module-wise count rates for Quadrant A Data is divided into 100 sec bins |
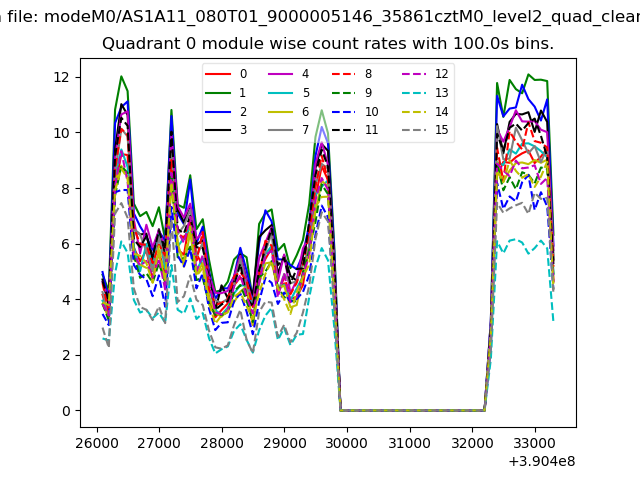 |
 |
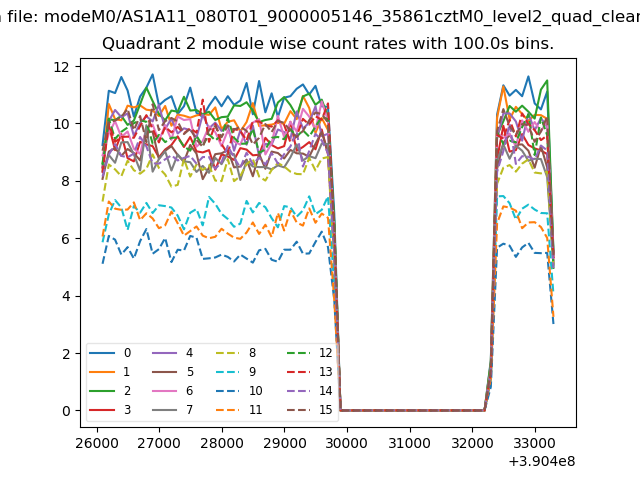
| Module-wise count rates for Quadrant B Data is divided into 100 sec bins |
 |
 |
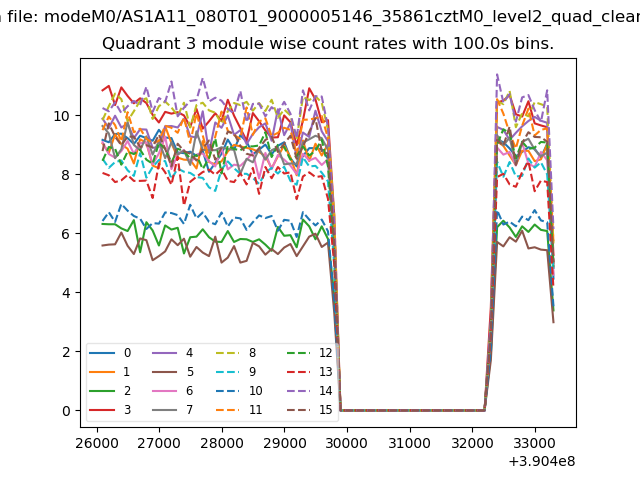
| Module-wise count rates for Quadrant C Data is divided into 100 sec bins |
 |
 |
| Module-wise count rates for Quadrant D Data is divided into 100 sec bins |
 |
 |
| Parameter | Plot |
|---|---|
| CZT HV Monitor | 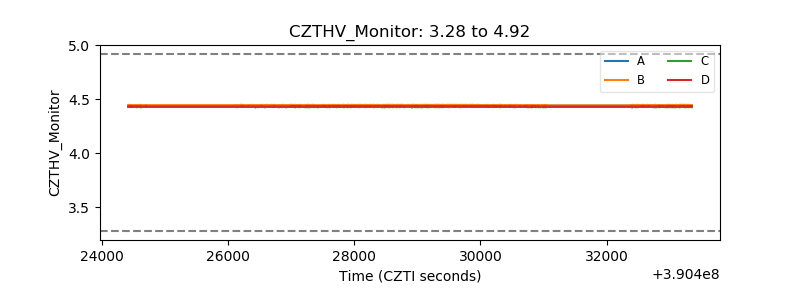 |
| D_VDD | 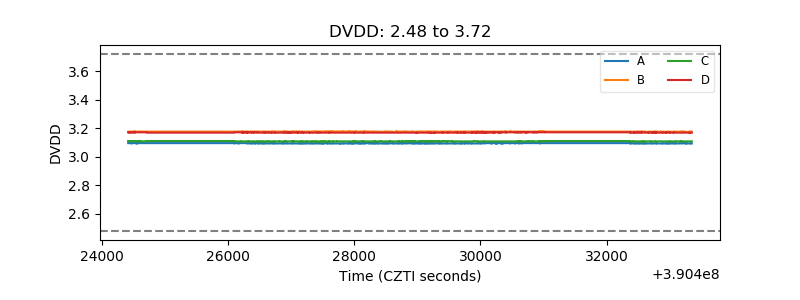 |
| Temperature 1 | 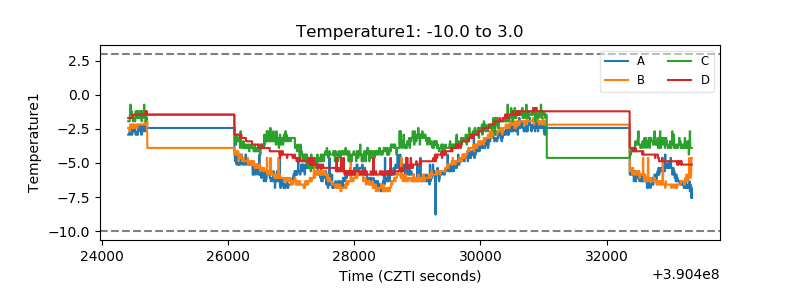 |
| Veto HV Monitor | 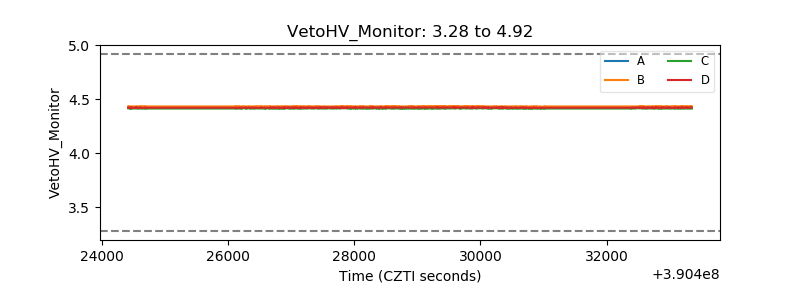 |
| Veto LLD | 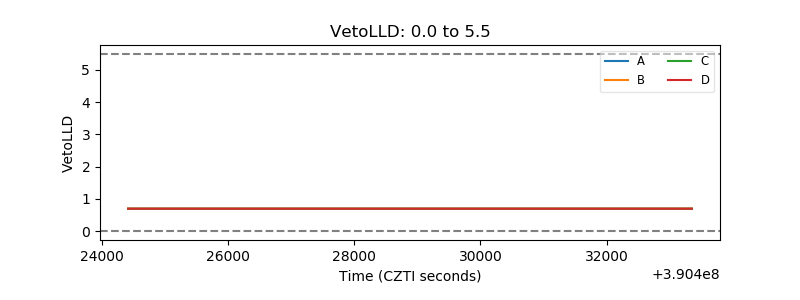 |
| Alpha Counter | 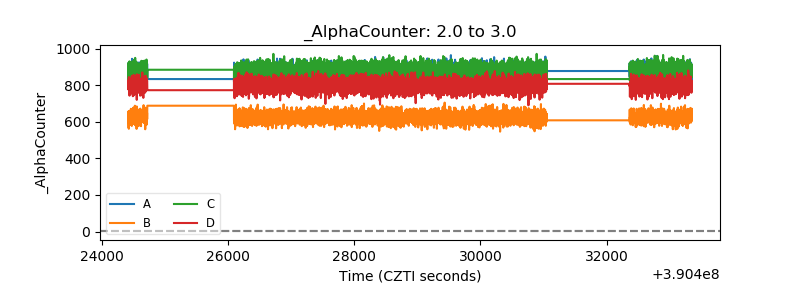 |
| _CPM_Rate | 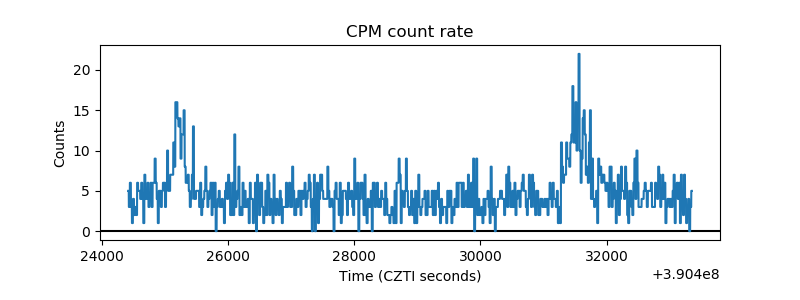 |
| CZT Counter | 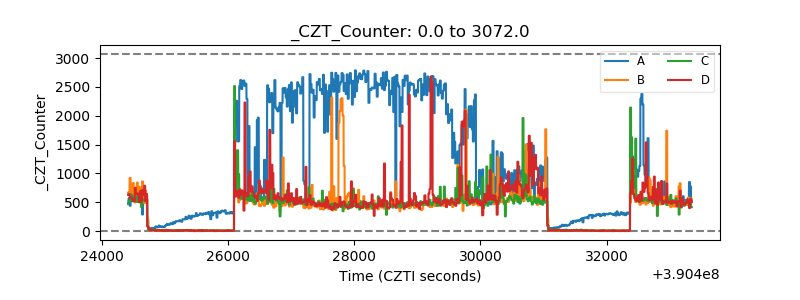 |
| +2.5 Volts monitor | 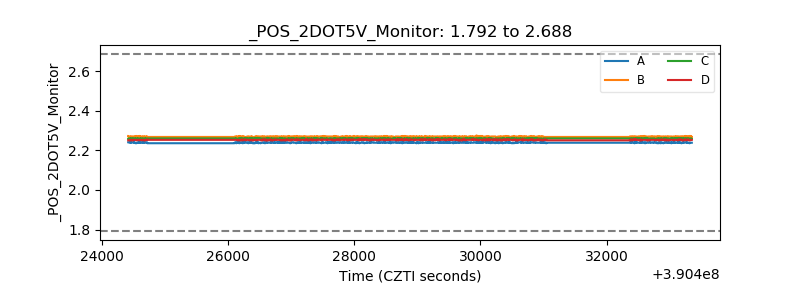 |
| +5 Volts monitor | 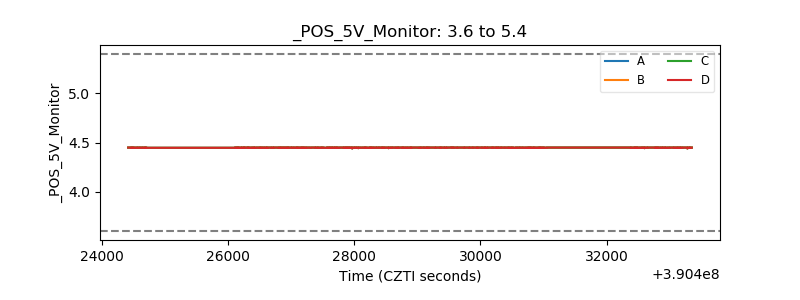 |
| _ROLL_ROT | 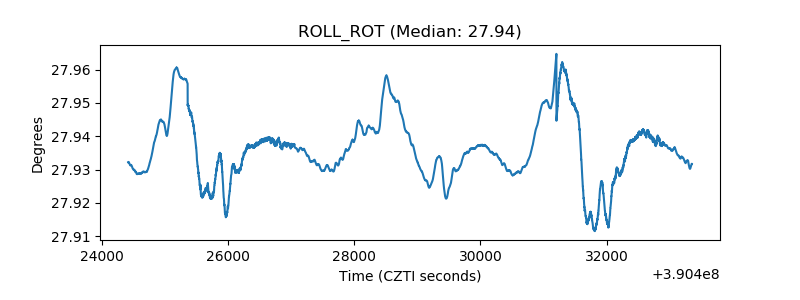 |
| _Roll_DEC | 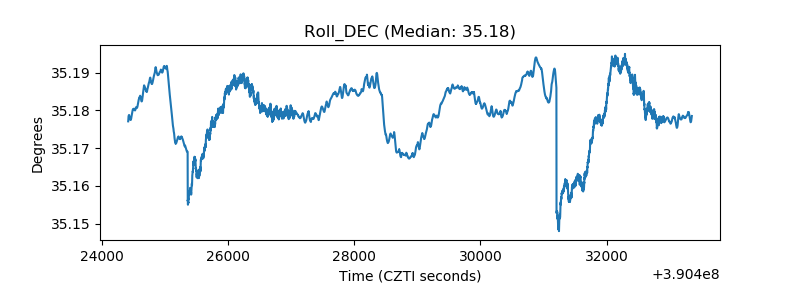 |
| _Roll_RA | 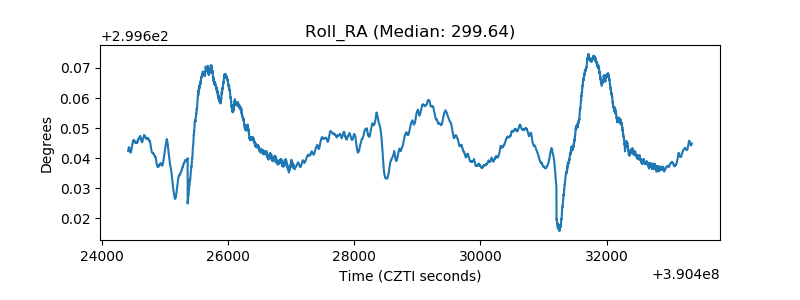 |
| Veto Counter | 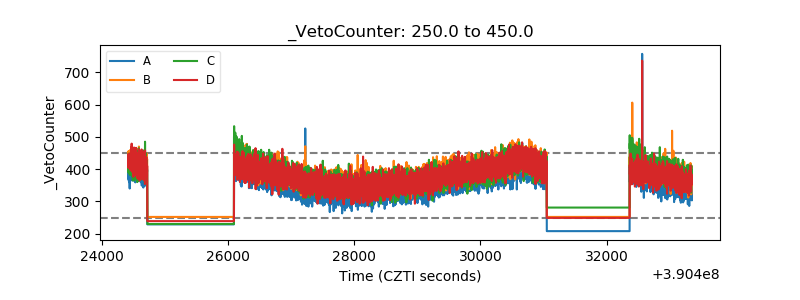 |