| Param | Original file | Final file |
|---|---|---|
| Filename | modeM0/AS1A11_080T01_9000005146_35856cztM0_level2.evt | modeM0/AS1A11_080T01_9000005146_35856cztM0_level2_quad_clean.evt |
| Size (bytes) | 420,269,760 | 56,586,240 |
| Size | 400.8 MB | 54.0 MB |
| Events in quadrant A | 2,930,630 | 351,149 |
| Events in quadrant B | 3,247,381 | 340,770 |
| Events in quadrant C | 3,105,115 | 338,107 |
| Events in quadrant D | 3,098,810 | 325,933 |
| Mode M9 | |||
|---|---|---|---|
| Quadrant | BADHDUFLAG | Total packets | Discarded packets |
| A | 0 | 33 | 0 |
| B | 0 | 33 | 0 |
| C | 0 | 33 | 0 |
| D | 0 | 34 | 0 |
| Mode SS | |||
|---|---|---|---|
| Quadrant | BADHDUFLAG | Total packets | Discarded packets |
| A | 0 | 104 | 0 |
| B | 0 | 104 | 0 |
| C | 0 | 104 | 0 |
| D | 0 | 104 | 0 |
| Mode M0 | |||
|---|---|---|---|
| Quadrant | BADHDUFLAG | Total packets | Discarded packets |
| A | 0 | 11671 | 3 |
| B | 0 | 12658 | 2 |
| C | 0 | 11928 | 2 |
| D | 0 | 12278 | 2 |
| Quadrant | Total seconds | Saturated seconds | Saturation percentage |
|---|---|---|---|
| A | 5095 | 6 | 0.117763% |
| B | 5095 | 114 | 2.237488% |
| C | 5095 | 129 | 2.531894% |
| D | 5095 | 75 | 1.472031% |
Noise dominated data is calculated using 1-second bins in cleaned event files. If a bin has >2000 counts, and if more than 50% of those come from <1% of pixels, then it is considered to be noise-dominated and hence unusable.
| Quadrant | # 1 sec bins | Bins with >0 counts | Bins with >2000 counts | High rate bins dominated by noise | Noise dominated (total time) | Noise dominated (detector-on time) | Marked lightcurve |
|---|---|---|---|---|---|---|---|
| A | 7218 | 5096 | 2 | 2 | 0.03% | 0.04% | 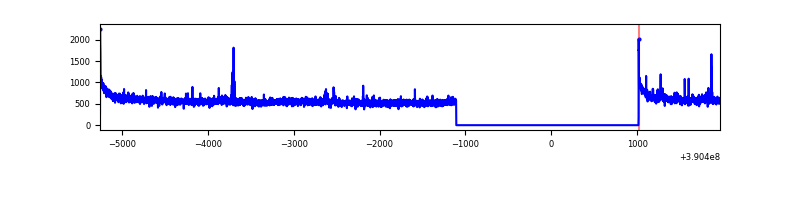 |
| B | 7218 | 5096 | 81 | 81 | 1.12% | 1.59% | 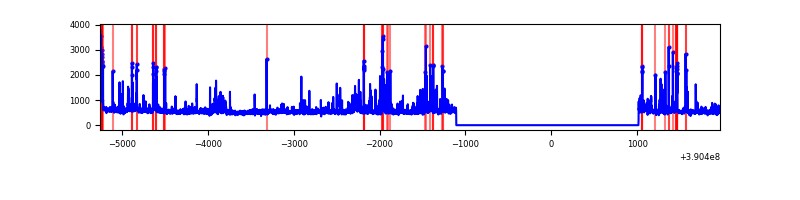 |
| C | 7218 | 5096 | 112 | 112 | 1.55% | 2.20% | 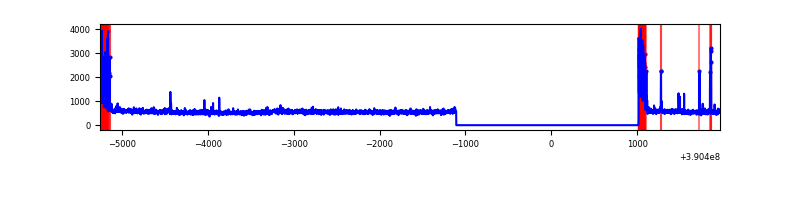 |
| D | 7218 | 5096 | 55 | 55 | 0.76% | 1.08% | 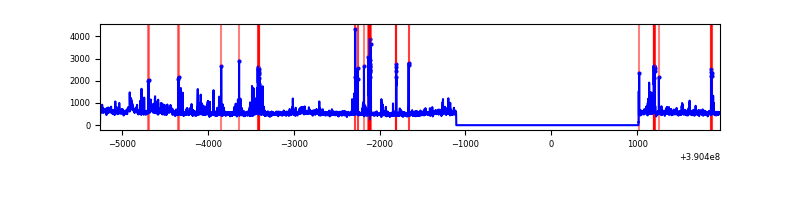 |
Top three noisy pixels from each quadrant. If the there are fewer than three noisy pixels in the level2.evt file, extra rows are filled as -1
| Pixel properties | Quadrant properties | ||||||
|---|---|---|---|---|---|---|---|
| Quadrant | DetID | PixID | Counts | Sigma | Mean | Median | Sigma |
| A | 10 | 83 | 160180 | 1167.33 | 685 | 675 | 136.6 |
| A | 15 | 169 | 78751 | 571.39 | 685 | 675 | 136.6 |
| A | 7 | 48 | 24802 | 176.57 | 685 | 675 | 136.6 |
| B | 5 | 172 | 361686 | 2924.7 | 665 | 653 | 123.4 |
| B | 0 | 213 | 189396 | 1528.99 | 665 | 653 | 123.4 |
| B | 0 | 190 | 39956 | 318.39 | 665 | 653 | 123.4 |
| C | 0 | 10 | 310031 | 2098.48 | 644 | 651 | 147.4 |
| C | 15 | 214 | 212275 | 1435.42 | 644 | 651 | 147.4 |
| C | 1 | 23 | 31636 | 210.17 | 644 | 651 | 147.4 |
| D | 13 | 249 | 166270 | 1022.1 | 658 | 641 | 162.0 |
| D | 8 | 195 | 92066 | 564.19 | 658 | 641 | 162.0 |
| D | 2 | 250 | 80858 | 495.02 | 658 | 641 | 162.0 |
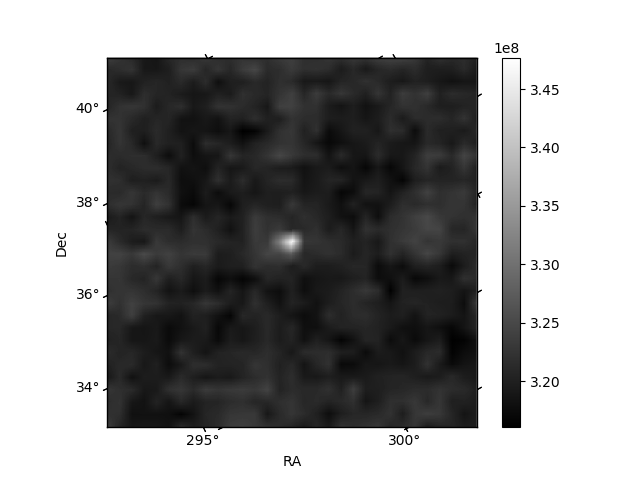
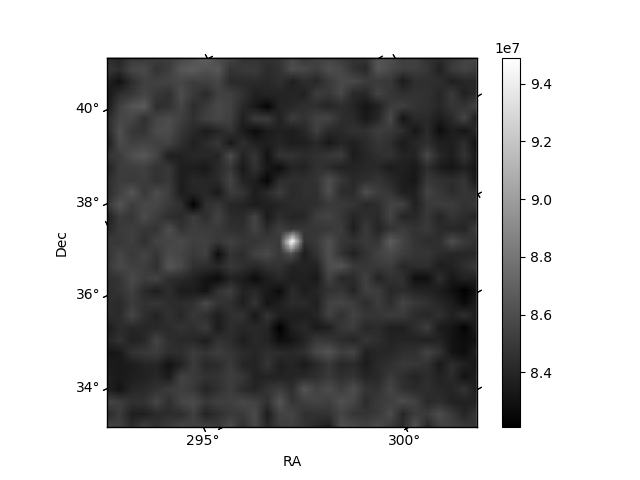
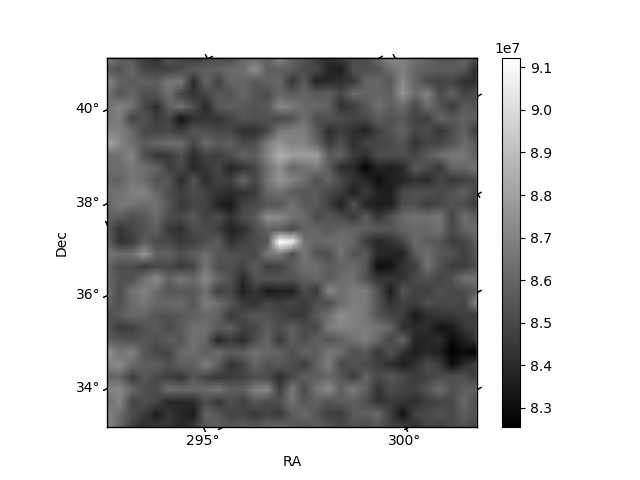
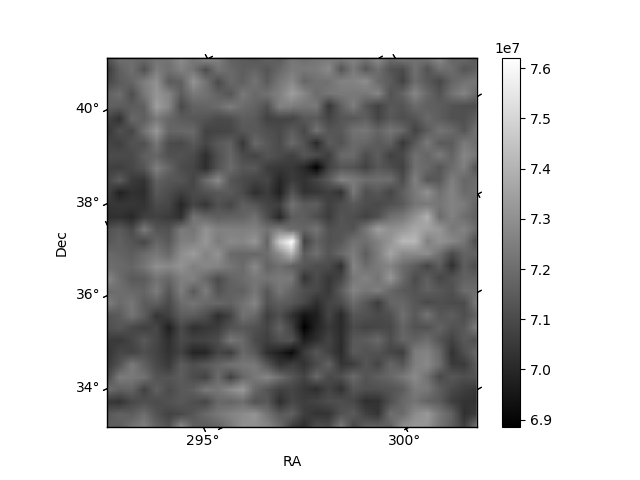
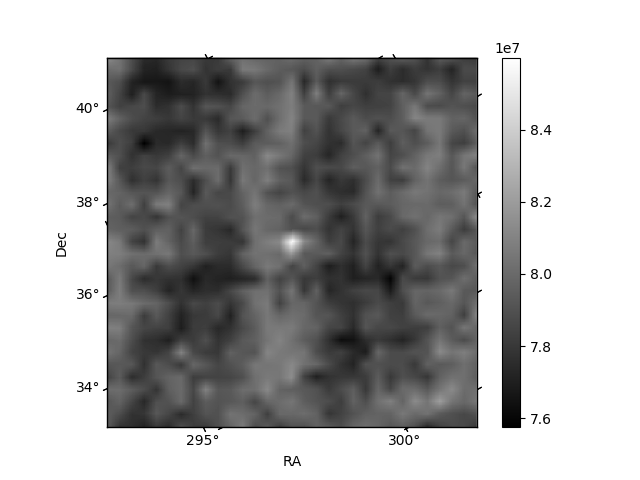
Histogram calculated using DETX and DETY for each event in the final _common_clean file
| Quadrant A | 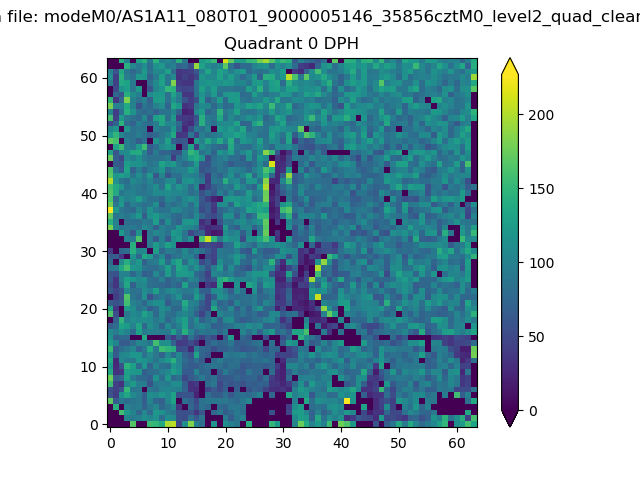 |
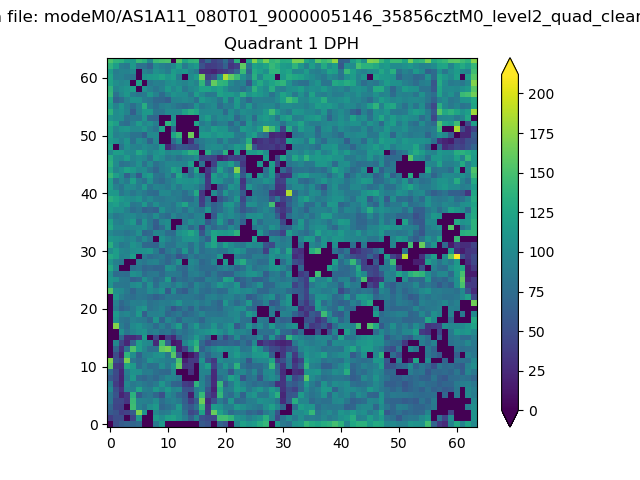 |
Quadrant B |
|---|---|---|---|
| Quadrant D | 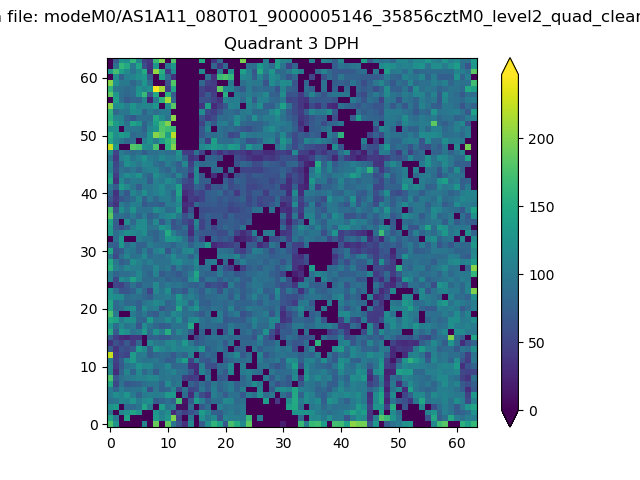 |
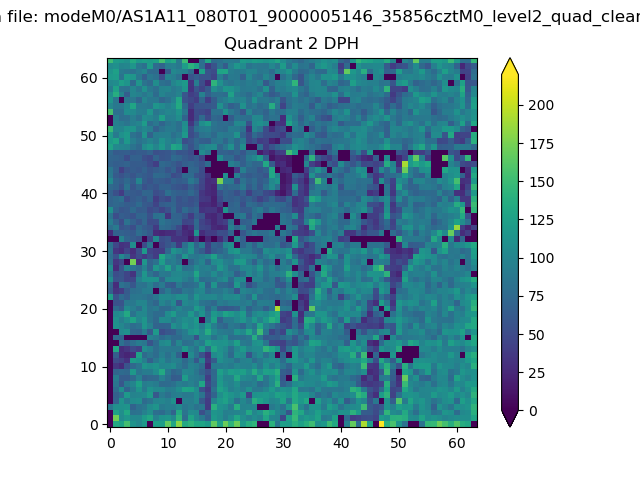 |
Quadrant C |
| Plot type | Count rate plots | Images |
|---|---|---|
| Comparison with Poisson distribution Blue bars denote a histogram of data divided into 1 sec bins. Red curve is a Poisson curve with rate = median count rate of data. |
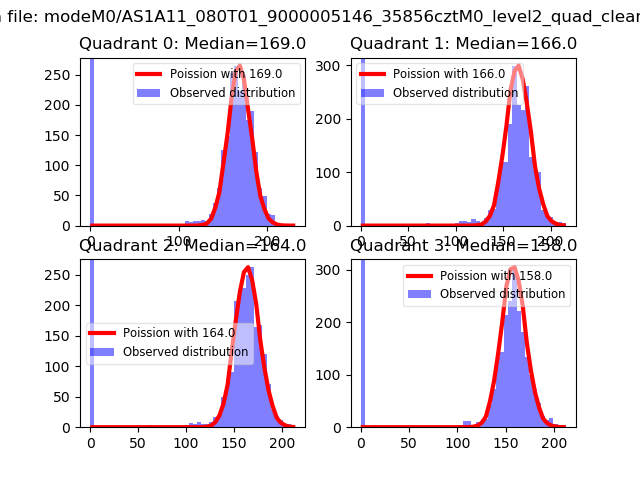 |
 |
| Quadrant-wise count rates Data is divided into 100 sec bins |
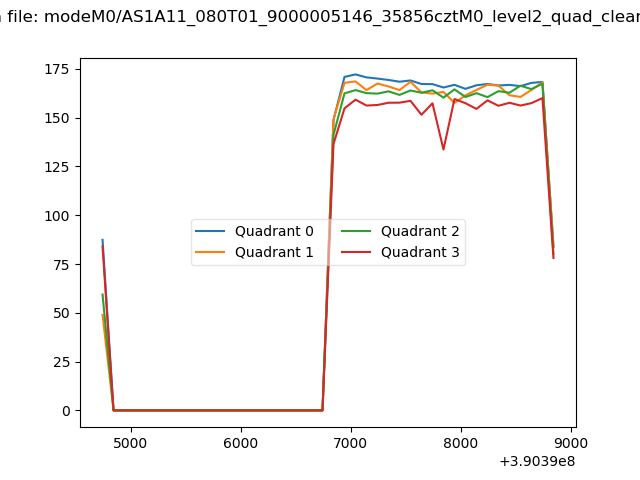 |
|
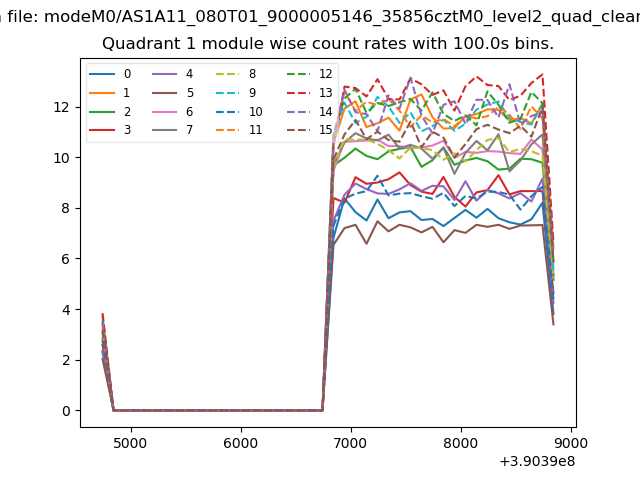
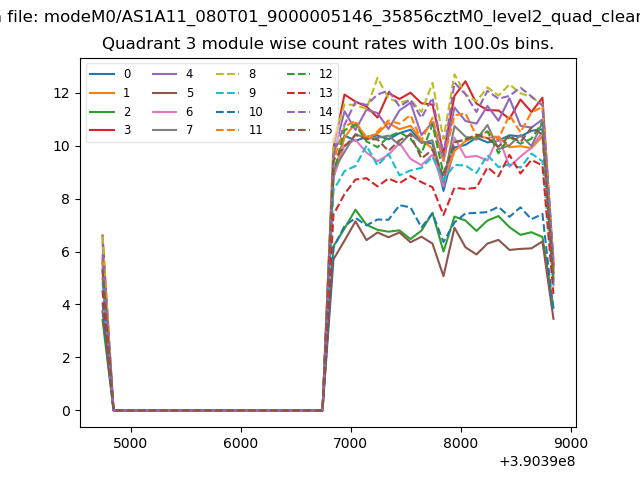
| Module-wise count rates for Quadrant A Data is divided into 100 sec bins |
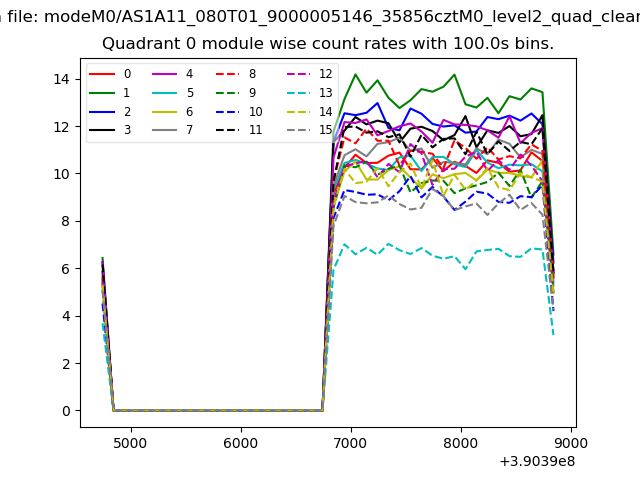 |
 |
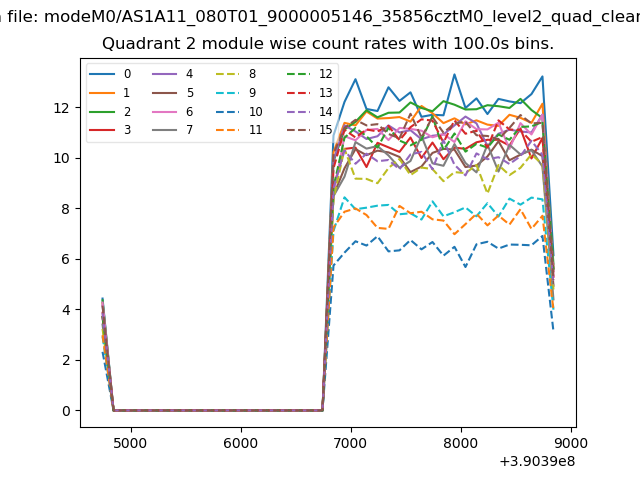
| Module-wise count rates for Quadrant B Data is divided into 100 sec bins |
 |
 |
| Module-wise count rates for Quadrant C Data is divided into 100 sec bins |
 |
 |
| Module-wise count rates for Quadrant D Data is divided into 100 sec bins |
 |
 |
| Parameter | Plot |
|---|---|
| CZT HV Monitor | 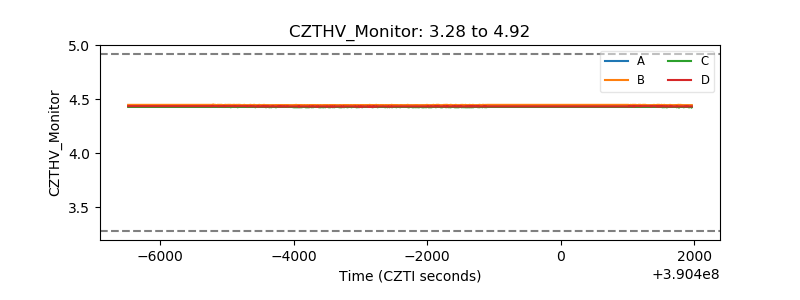 |
| D_VDD | 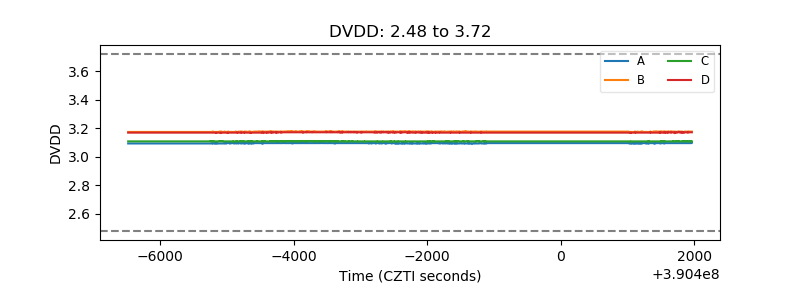 |
| Temperature 1 | 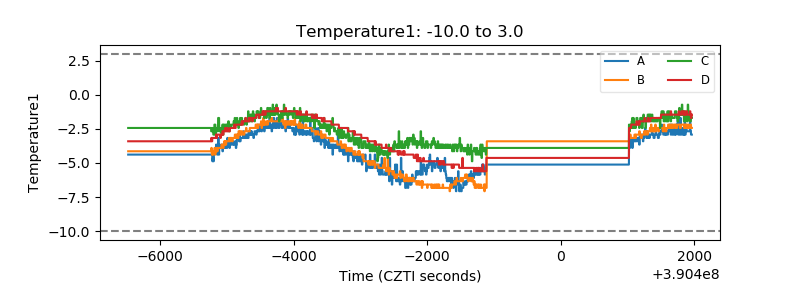 |
| Veto HV Monitor | 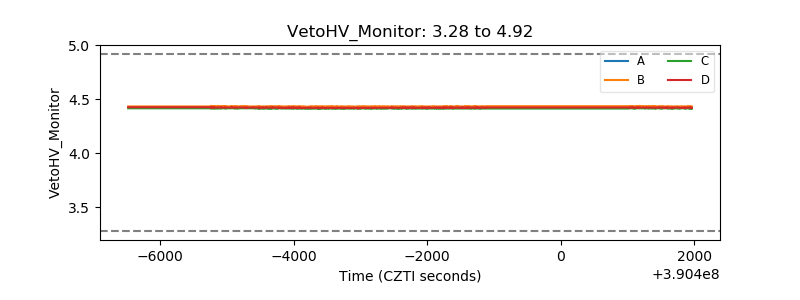 |
| Veto LLD | 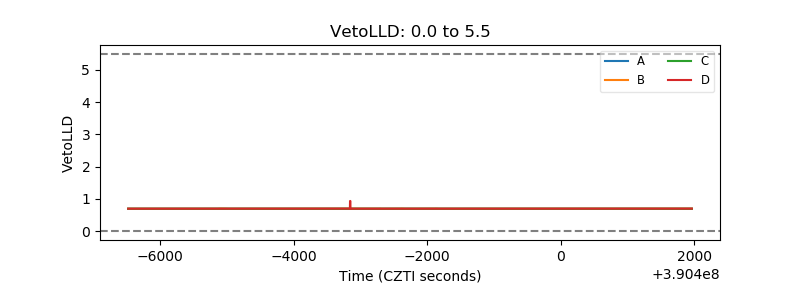 |
| Alpha Counter | 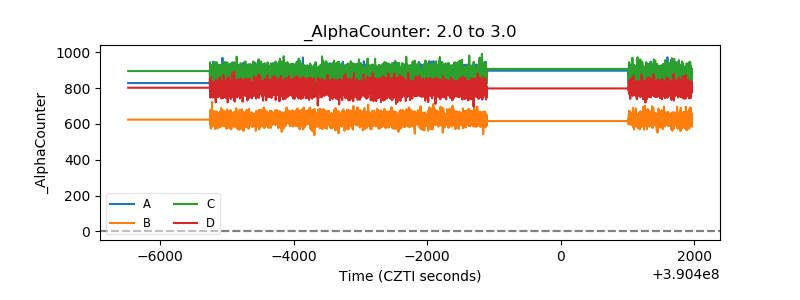 |
| _CPM_Rate | 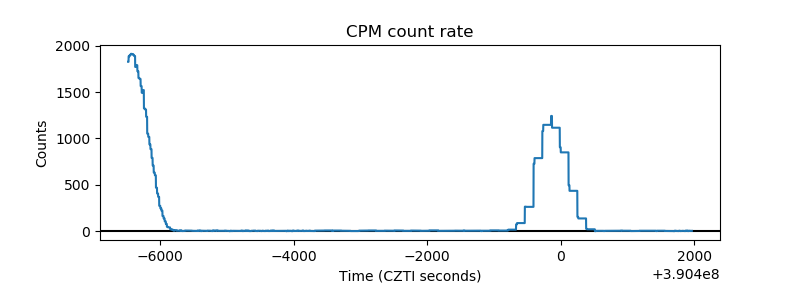 |
| CZT Counter | 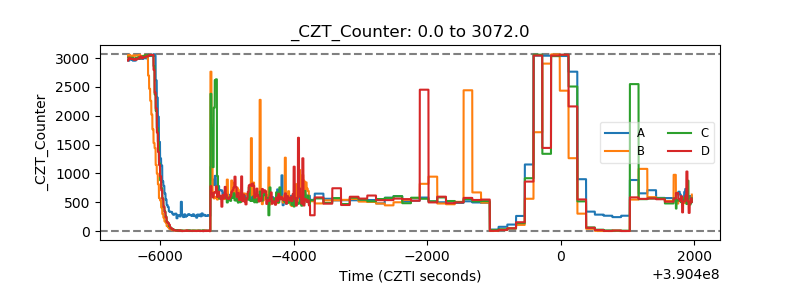 |
| +2.5 Volts monitor | 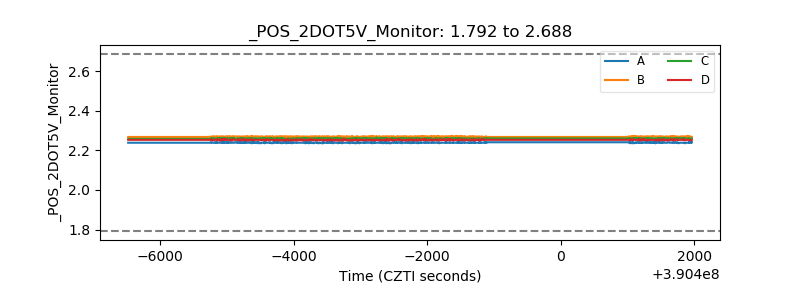 |
| +5 Volts monitor | 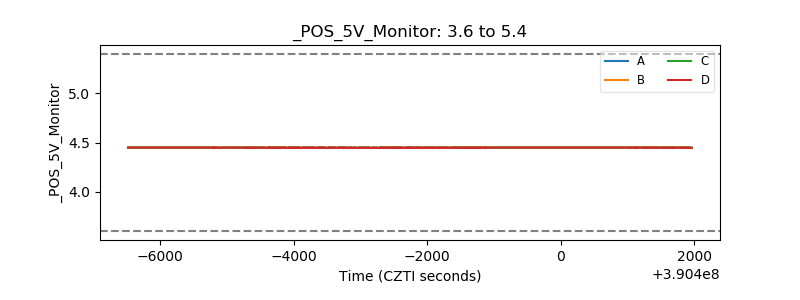 |
| _ROLL_ROT | 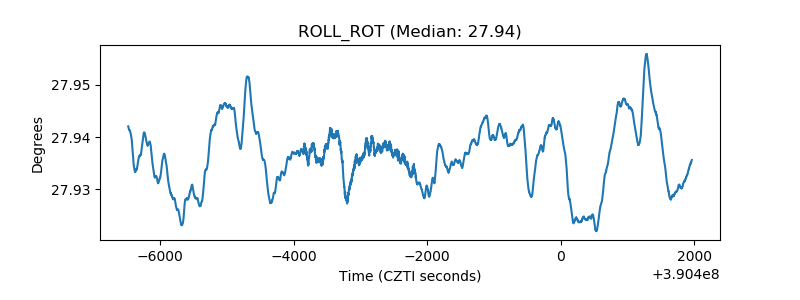 |
| _Roll_DEC | 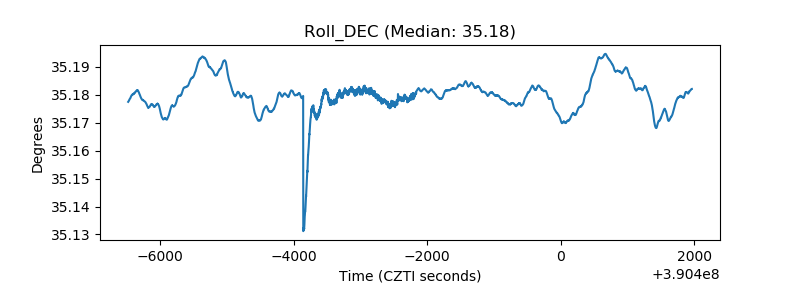 |
| _Roll_RA | 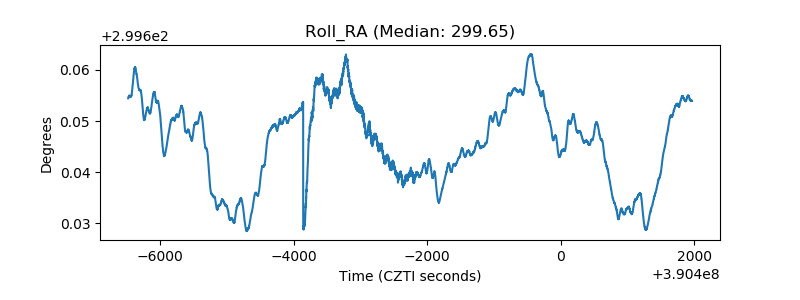 |
| Veto Counter | 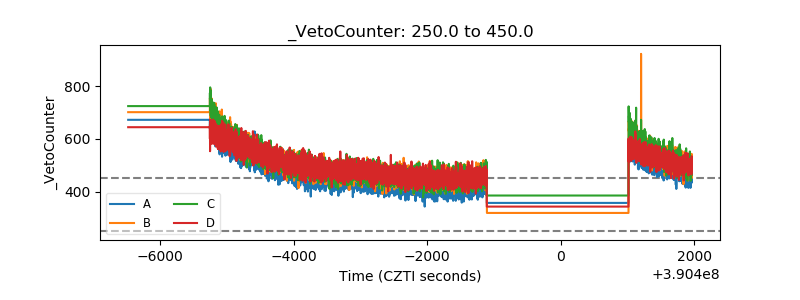 |