| Param | Original file | Final file |
|---|---|---|
| Filename | modeM0/AS1A11_080T01_9000005146_35853cztM0_level2.evt | modeM0/AS1A11_080T01_9000005146_35853cztM0_level2_quad_clean.evt |
| Size (bytes) | 369,299,520 | 73,379,520 |
| Size | 352.2 MB | 70.0 MB |
| Events in quadrant A | 2,604,972 | 487,032 |
| Events in quadrant B | 2,666,518 | 483,436 |
| Events in quadrant C | 2,729,807 | 470,213 |
| Events in quadrant D | 2,857,315 | 445,925 |
| Mode M9 | |||
|---|---|---|---|
| Quadrant | BADHDUFLAG | Total packets | Discarded packets |
| A | 0 | 33 | 0 |
| B | 0 | 31 | 0 |
| C | 0 | 32 | 1 |
| D | 0 | 34 | 0 |
| Mode SS | |||
|---|---|---|---|
| Quadrant | BADHDUFLAG | Total packets | Discarded packets |
| A | 0 | 106 | 4 |
| B | 0 | 105 | 5 |
| C | 0 | 107 | 3 |
| D | 0 | 106 | 3 |
| Mode M0 | |||
|---|---|---|---|
| Quadrant | BADHDUFLAG | Total packets | Discarded packets |
| A | 0 | 11460 | 942 |
| B | 0 | 12150 | 1356 |
| C | 0 | 11795 | 966 |
| D | 0 | 13092 | 1680 |
| Quadrant | Total seconds | Saturated seconds | Saturation percentage |
|---|---|---|---|
| A | 4807 | 7 | 0.145621% |
| B | 4737 | 32 | 0.675533% |
| C | 4794 | 87 | 1.814768% |
| D | 4705 | 75 | 1.594049% |
Noise dominated data is calculated using 1-second bins in cleaned event files. If a bin has >2000 counts, and if more than 50% of those come from <1% of pixels, then it is considered to be noise-dominated and hence unusable.
| Quadrant | # 1 sec bins | Bins with >0 counts | Bins with >2000 counts | High rate bins dominated by noise | Noise dominated (total time) | Noise dominated (detector-on time) | Marked lightcurve |
|---|---|---|---|---|---|---|---|
| A | 7162 | 5122 | 1 | 1 | 0.01% | 0.02% | 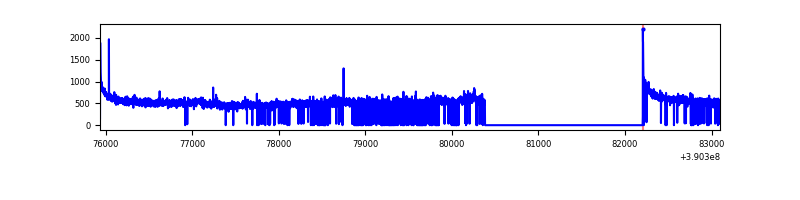 |
| B | 7162 | 5052 | 21 | 21 | 0.29% | 0.42% |  |
| C | 7162 | 5109 | 81 | 81 | 1.13% | 1.59% | 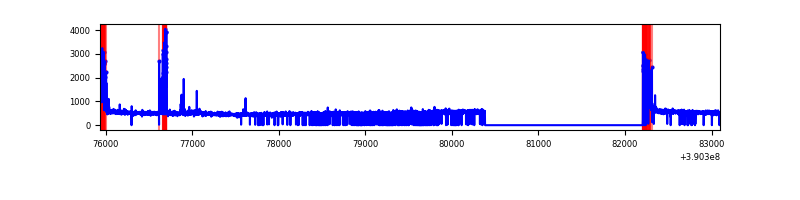 |
| D | 7162 | 5052 | 70 | 70 | 0.98% | 1.39% | 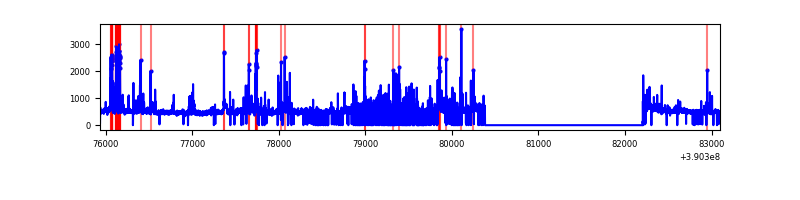 |
Top three noisy pixels from each quadrant. If the there are fewer than three noisy pixels in the level2.evt file, extra rows are filled as -1
| Pixel properties | Quadrant properties | ||||||
|---|---|---|---|---|---|---|---|
| Quadrant | DetID | PixID | Counts | Sigma | Mean | Median | Sigma |
| A | 10 | 83 | 152106 | 1246.21 | 604 | 595 | 121.6 |
| A | 15 | 169 | 91926 | 751.21 | 604 | 595 | 121.6 |
| A | 13 | 6 | 17555 | 139.5 | 604 | 595 | 121.6 |
| B | 5 | 172 | 190772 | 1715.51 | 583 | 571 | 110.9 |
| B | 0 | 213 | 87377 | 782.94 | 583 | 571 | 110.9 |
| B | 15 | 85 | 27921 | 246.68 | 583 | 571 | 110.9 |
| C | 0 | 10 | 216337 | 1639.63 | 566 | 573 | 131.6 |
| C | 15 | 214 | 204202 | 1547.42 | 566 | 573 | 131.6 |
| C | 9 | 69 | 80019 | 603.73 | 566 | 573 | 131.6 |
| D | 7 | 223 | 184980 | 1349.7 | 563 | 551 | 136.6 |
| D | 13 | 200 | 99092 | 721.15 | 563 | 551 | 136.6 |
| D | 8 | 195 | 88749 | 645.46 | 563 | 551 | 136.6 |
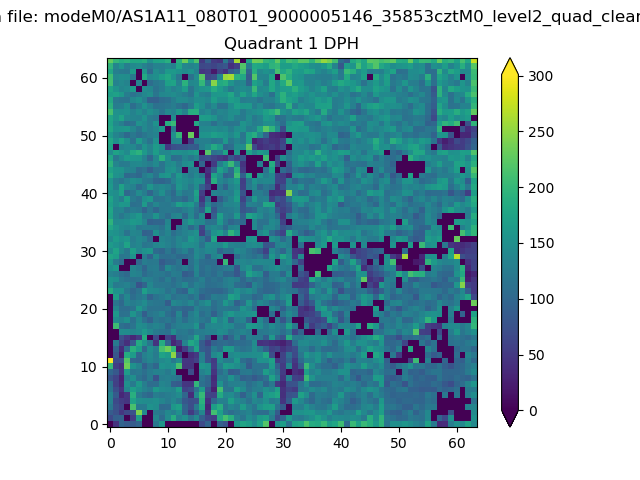
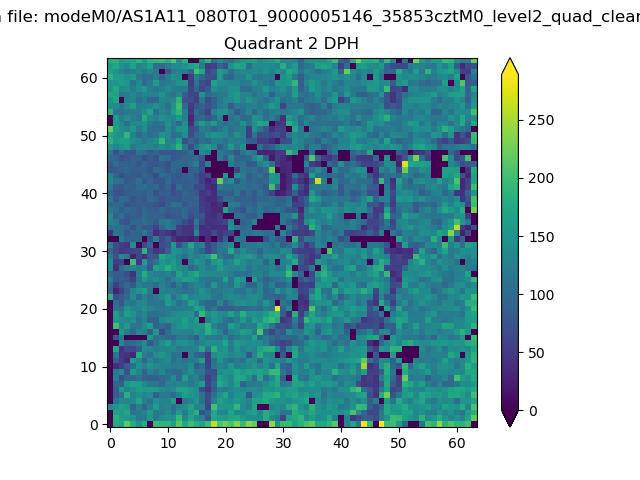
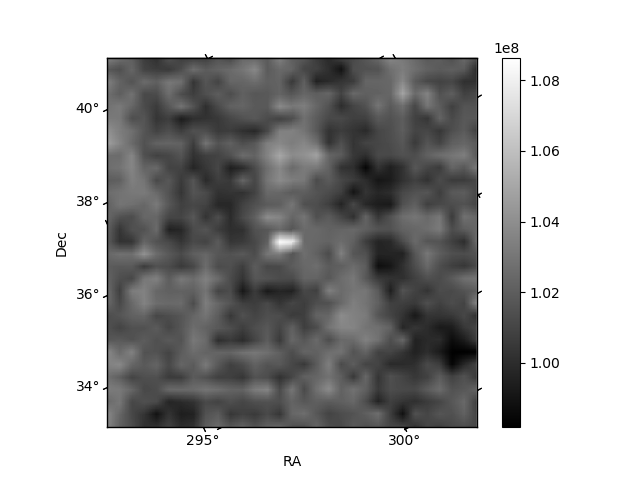
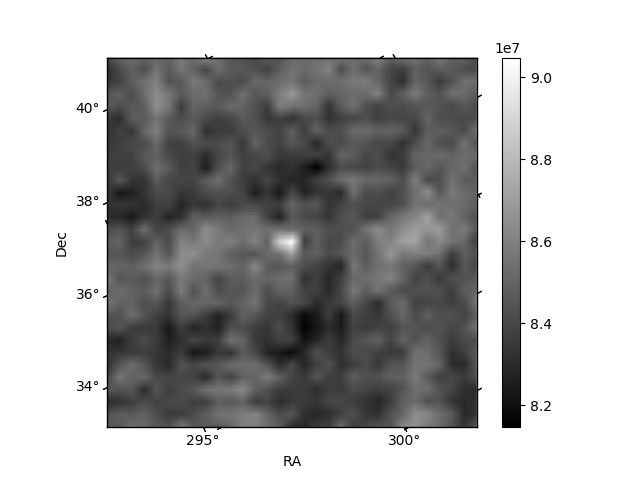
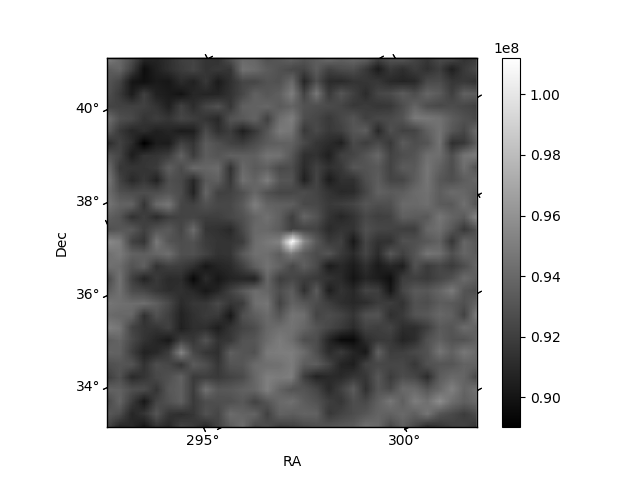
Histogram calculated using DETX and DETY for each event in the final _common_clean file
| Quadrant A | 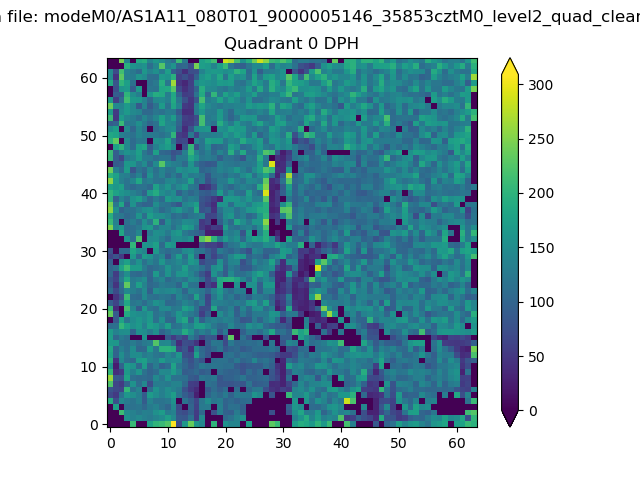 |
 |
Quadrant B |
|---|---|---|---|
| Quadrant D | 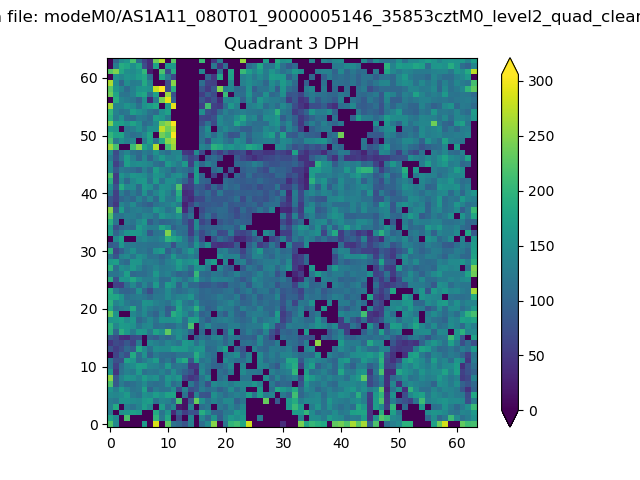 |
 |
Quadrant C |
| Plot type | Count rate plots | Images |
|---|---|---|
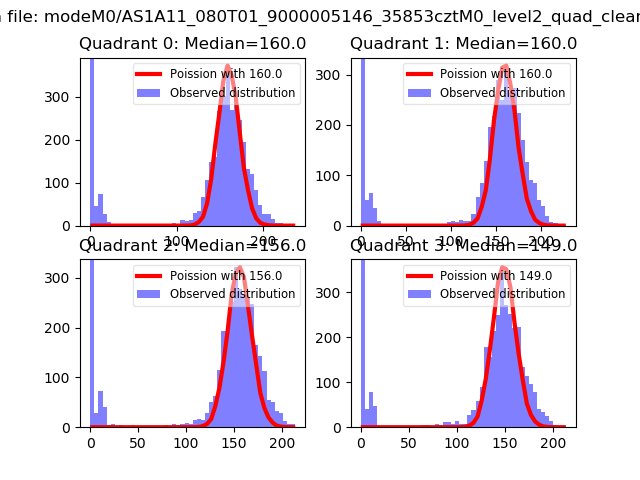
| Comparison with Poisson distribution Blue bars denote a histogram of data divided into 1 sec bins. Red curve is a Poisson curve with rate = median count rate of data. |
 |
 |
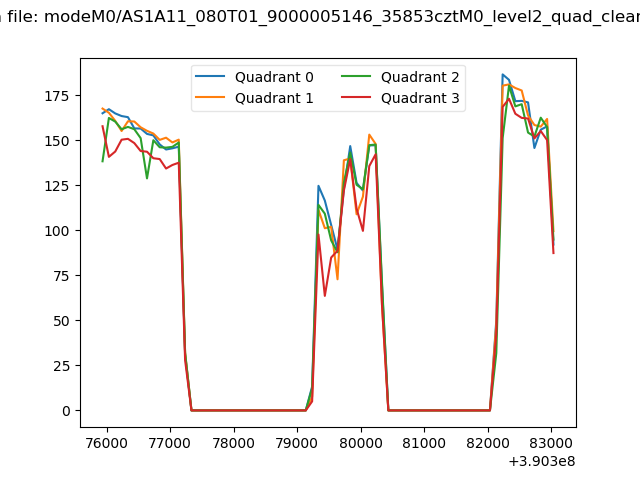
| Quadrant-wise count rates Data is divided into 100 sec bins |
 |
|
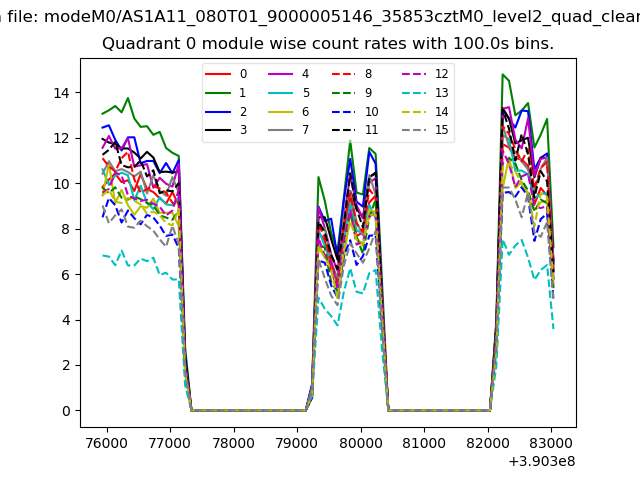
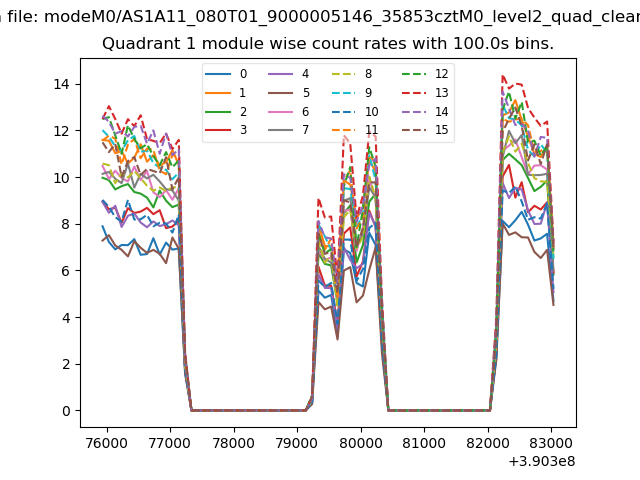
| Module-wise count rates for Quadrant A Data is divided into 100 sec bins |
 |
 |
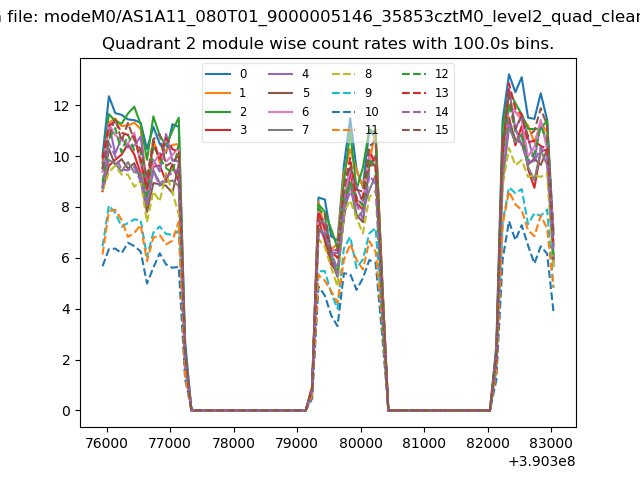
| Module-wise count rates for Quadrant B Data is divided into 100 sec bins |
 |
 |
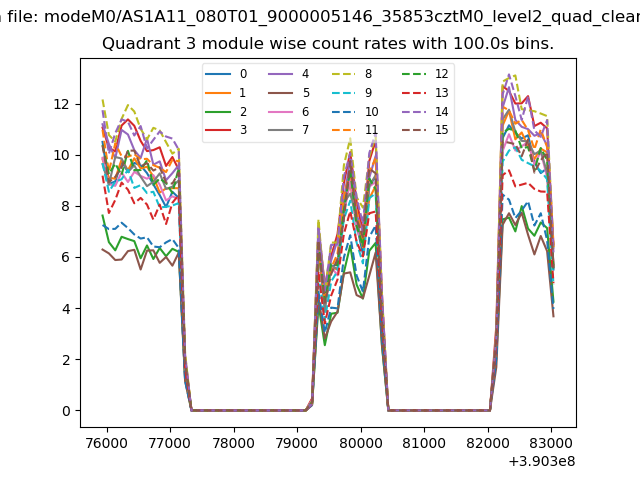
| Module-wise count rates for Quadrant C Data is divided into 100 sec bins |
 |
 |
| Module-wise count rates for Quadrant D Data is divided into 100 sec bins |
 |
 |
| Parameter | Plot |
|---|---|
| CZT HV Monitor | 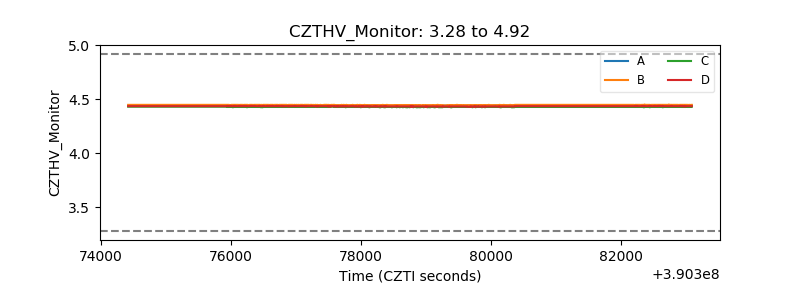 |
| D_VDD | 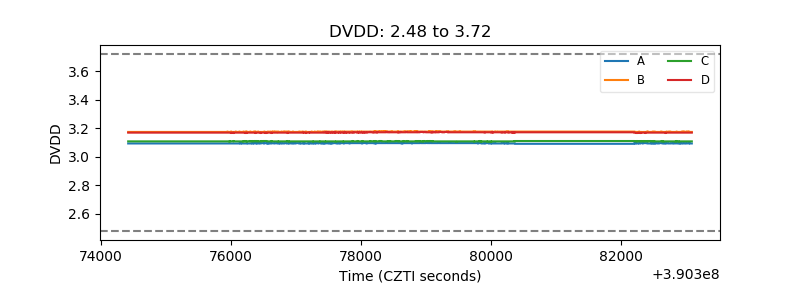 |
| Temperature 1 | 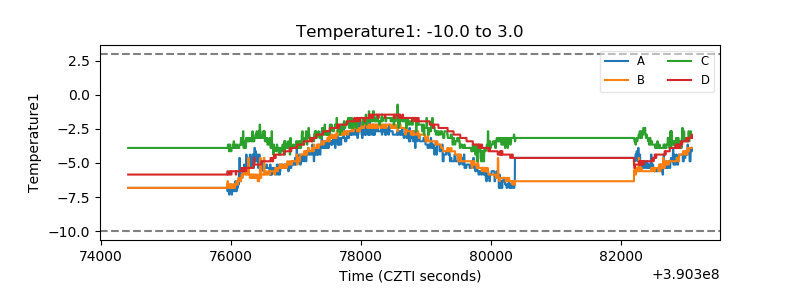 |
| Veto HV Monitor | 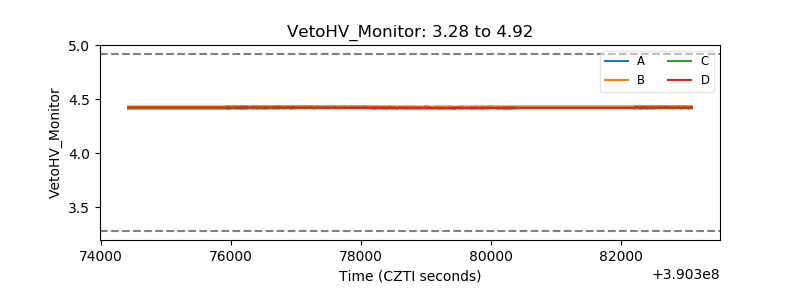 |
| Veto LLD | 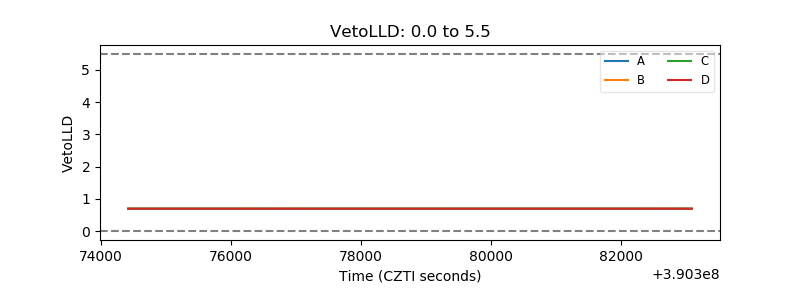 |
| Alpha Counter | 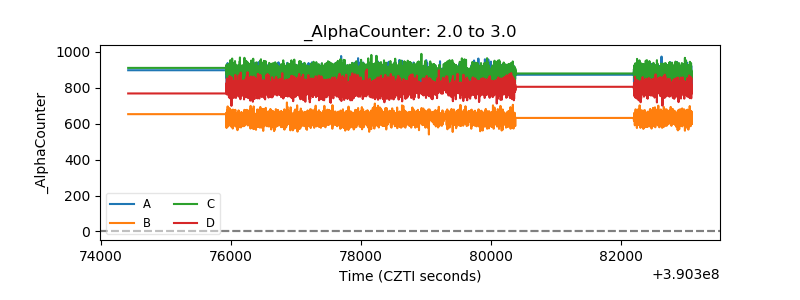 |
| _CPM_Rate | 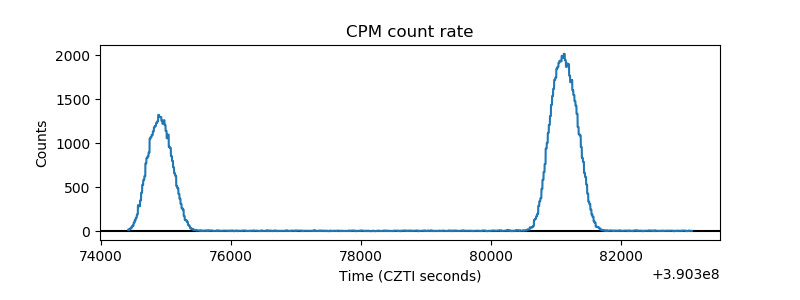 |
| CZT Counter | 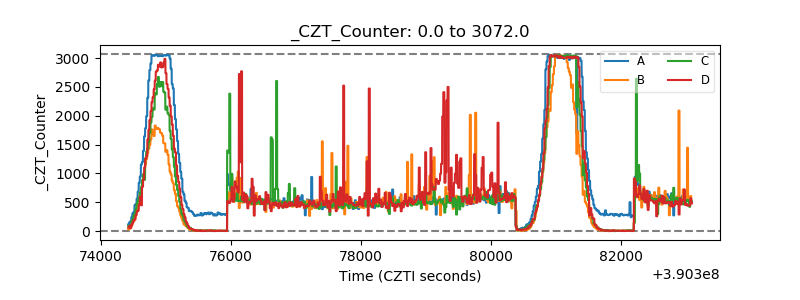 |
| +2.5 Volts monitor | 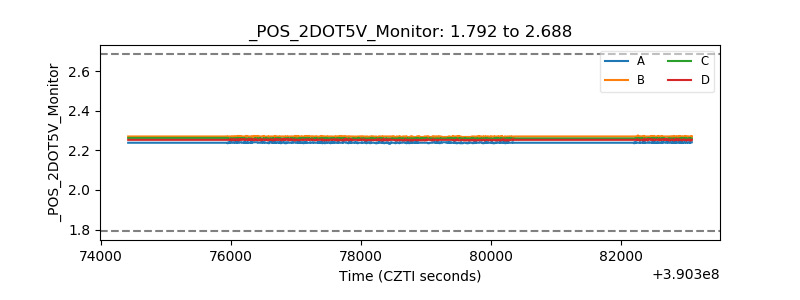 |
| +5 Volts monitor | 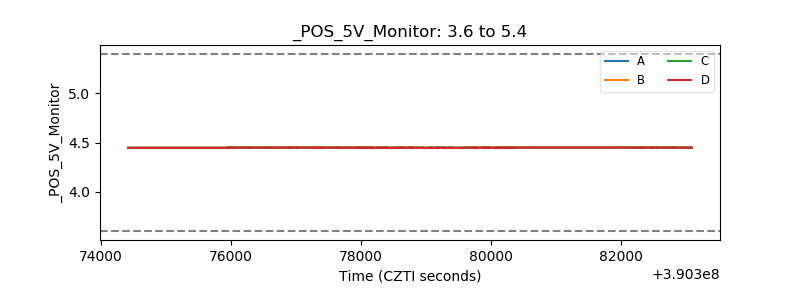 |
| _ROLL_ROT | 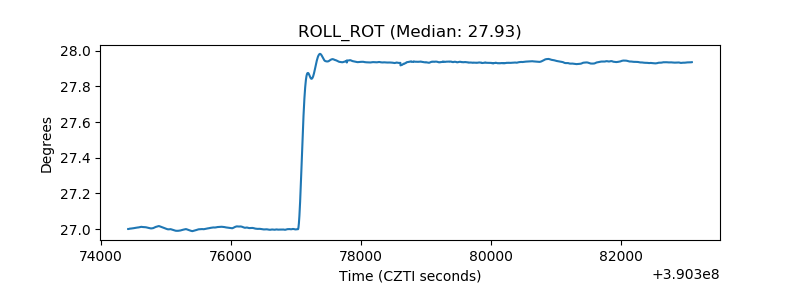 |
| _Roll_DEC | 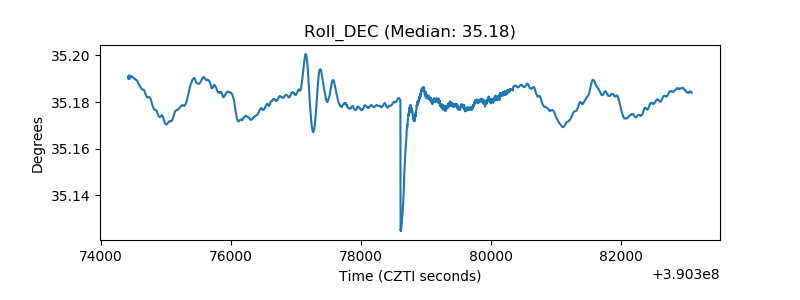 |
| _Roll_RA | 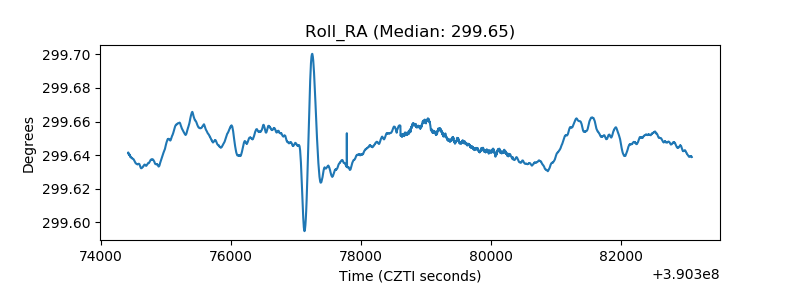 |
| Veto Counter | 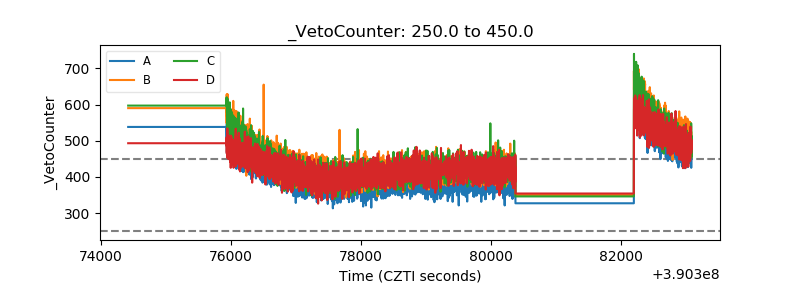 |