| Param | Original file | Final file |
|---|---|---|
| Filename | modeM0/AS1A11_080T01_9000005146_35850cztM0_level2.evt | modeM0/AS1A11_080T01_9000005146_35850cztM0_level2_quad_clean.evt |
| Size (bytes) | 431,193,600 | 81,622,080 |
| Size | 411.2 MB | 77.8 MB |
| Events in quadrant A | 3,147,065 | 526,480 |
| Events in quadrant B | 3,219,761 | 526,111 |
| Events in quadrant C | 3,001,006 | 518,837 |
| Events in quadrant D | 3,299,579 | 497,602 |
| Mode M9 | |||
|---|---|---|---|
| Quadrant | BADHDUFLAG | Total packets | Discarded packets |
| A | 0 | 16 | 0 |
| B | 0 | 16 | 0 |
| C | 0 | 16 | 0 |
| D | 0 | 17 | 0 |
| Mode SS | |||
|---|---|---|---|
| Quadrant | BADHDUFLAG | Total packets | Discarded packets |
| A | 0 | 118 | 0 |
| B | 0 | 118 | 0 |
| C | 0 | 118 | 0 |
| D | 0 | 118 | 0 |
| Mode M0 | |||
|---|---|---|---|
| Quadrant | BADHDUFLAG | Total packets | Discarded packets |
| A | 0 | 12854 | 3 |
| B | 0 | 13317 | 2 |
| C | 0 | 12430 | 2 |
| D | 0 | 13605 | 2 |
| Quadrant | Total seconds | Saturated seconds | Saturation percentage |
|---|---|---|---|
| A | 5756 | 6 | 0.104239% |
| B | 5756 | 103 | 1.789437% |
| C | 5756 | 74 | 1.285615% |
| D | 5756 | 107 | 1.858930% |
Noise dominated data is calculated using 1-second bins in cleaned event files. If a bin has >2000 counts, and if more than 50% of those come from <1% of pixels, then it is considered to be noise-dominated and hence unusable.
| Quadrant | # 1 sec bins | Bins with >0 counts | Bins with >2000 counts | High rate bins dominated by noise | Noise dominated (total time) | Noise dominated (detector-on time) | Marked lightcurve |
|---|---|---|---|---|---|---|---|
| A | 7339 | 5757 | 0 | 0 | 0.00% | 0.00% | 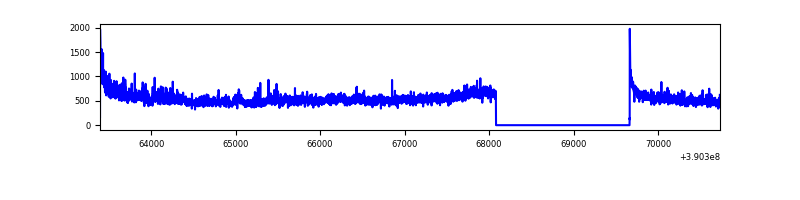 |
| B | 7339 | 5757 | 78 | 78 | 1.06% | 1.35% | 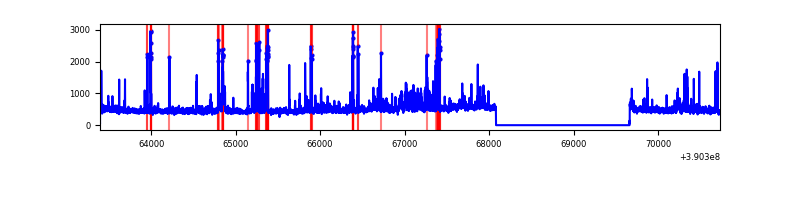 |
| C | 7339 | 5757 | 58 | 58 | 0.79% | 1.01% | 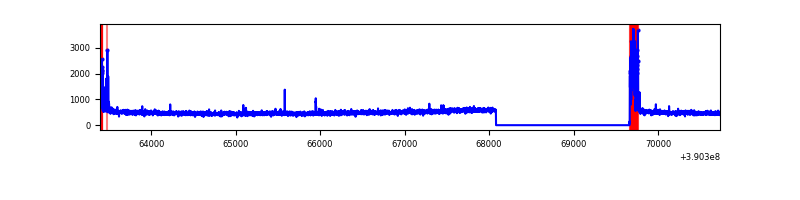 |
| D | 7339 | 5757 | 97 | 97 | 1.32% | 1.68% | 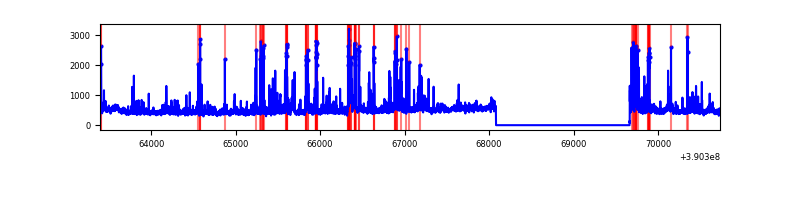 |
Top three noisy pixels from each quadrant. If the there are fewer than three noisy pixels in the level2.evt file, extra rows are filled as -1
| Pixel properties | Quadrant properties | ||||||
|---|---|---|---|---|---|---|---|
| Quadrant | DetID | PixID | Counts | Sigma | Mean | Median | Sigma |
| A | 15 | 169 | 363239 | 2662.4 | 673 | 661 | 136.2 |
| A | 10 | 83 | 169616 | 1240.63 | 673 | 661 | 136.2 |
| A | 13 | 6 | 10996 | 75.89 | 673 | 661 | 136.2 |
| B | 5 | 172 | 366886 | 2870.38 | 663 | 647 | 127.6 |
| B | 0 | 213 | 182584 | 1425.92 | 663 | 647 | 127.6 |
| B | 0 | 189 | 22867 | 174.15 | 663 | 647 | 127.6 |
| C | 15 | 214 | 244001 | 1619.18 | 647 | 656 | 150.3 |
| C | 0 | 10 | 231379 | 1535.2 | 647 | 656 | 150.3 |
| C | 13 | 61 | 4390 | 24.85 | 647 | 656 | 150.3 |
| D | 7 | 223 | 378223 | 2361.52 | 646 | 628 | 159.9 |
| D | 13 | 249 | 142162 | 885.17 | 646 | 628 | 159.9 |
| D | 8 | 195 | 106421 | 661.64 | 646 | 628 | 159.9 |
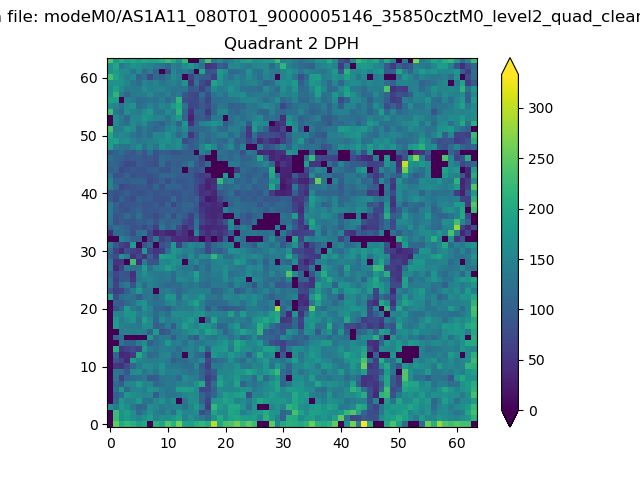
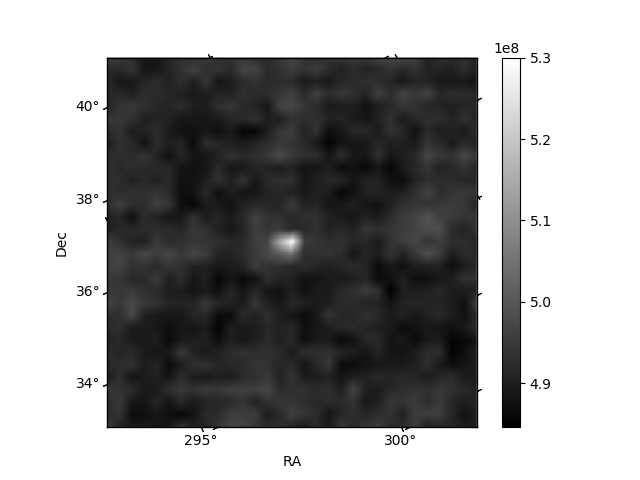
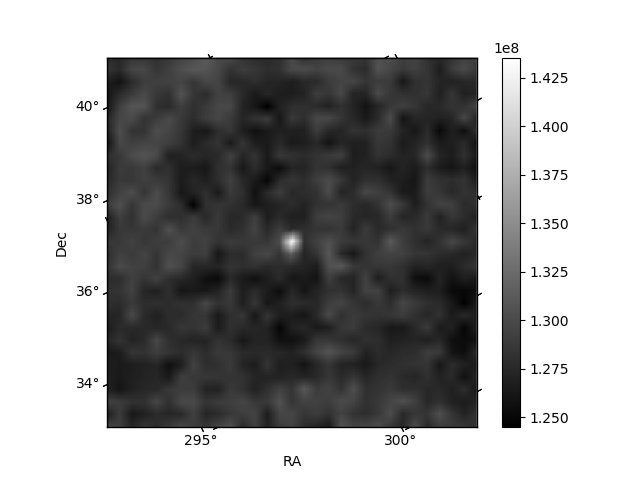
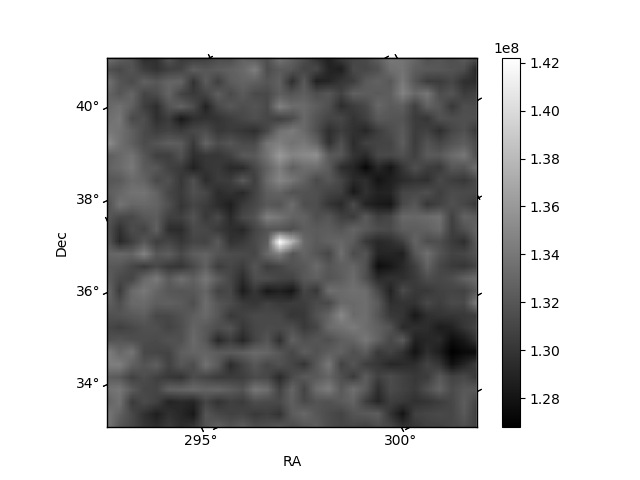
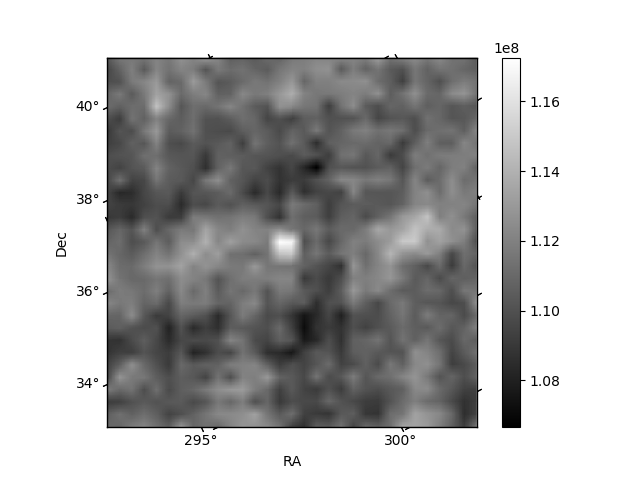
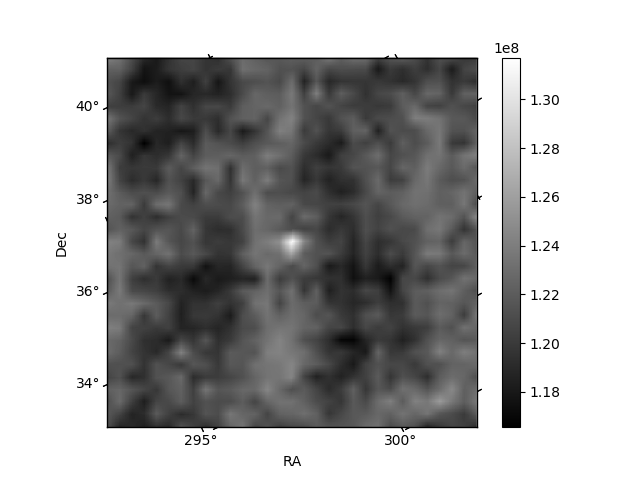
Histogram calculated using DETX and DETY for each event in the final _common_clean file
| Quadrant A | 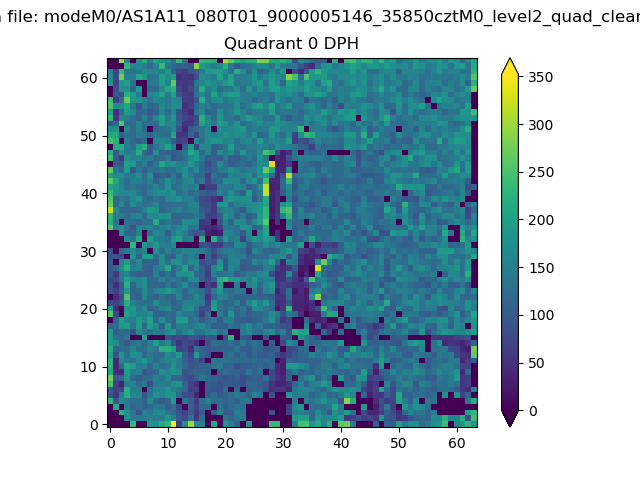 |
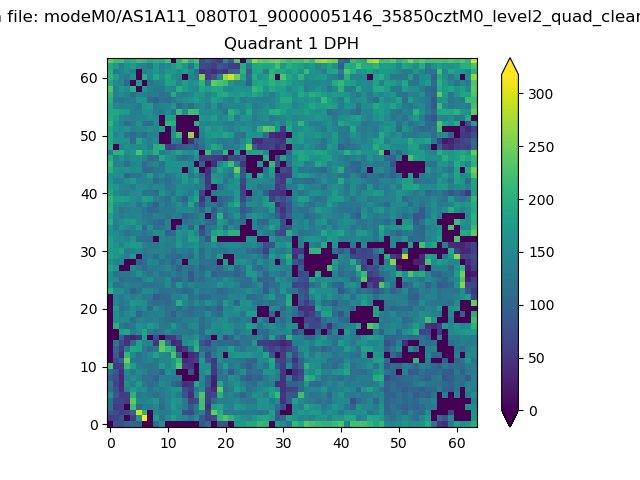 |
Quadrant B |
|---|---|---|---|
| Quadrant D | 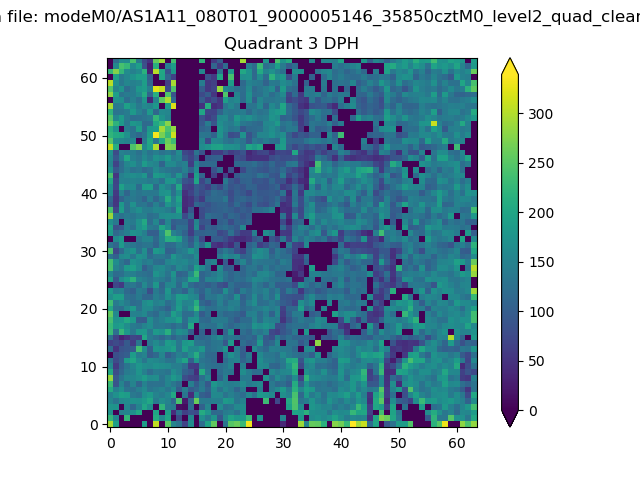 |
 |
Quadrant C |
| Plot type | Count rate plots | Images |
|---|---|---|
| Comparison with Poisson distribution Blue bars denote a histogram of data divided into 1 sec bins. Red curve is a Poisson curve with rate = median count rate of data. |
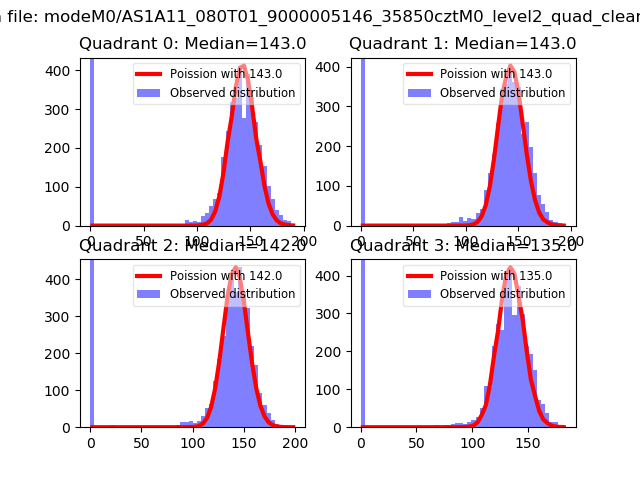 |
 |
| Quadrant-wise count rates Data is divided into 100 sec bins |
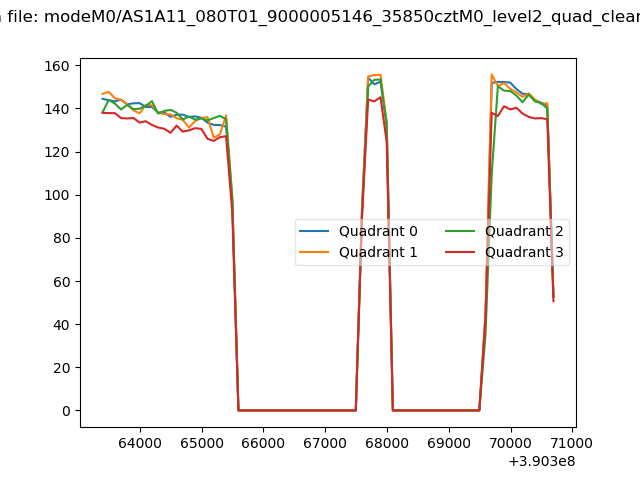 |
|
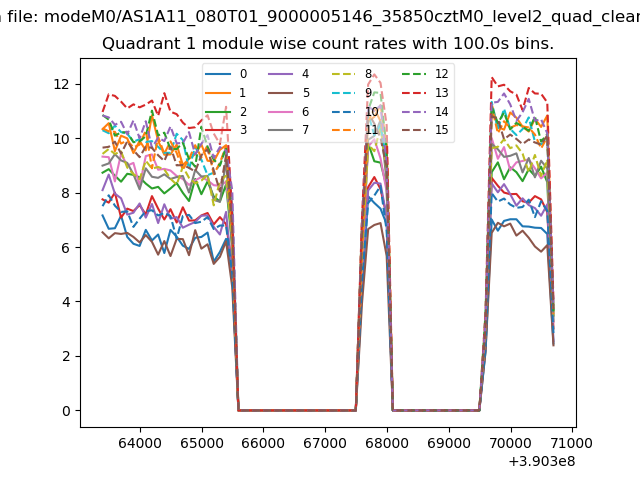
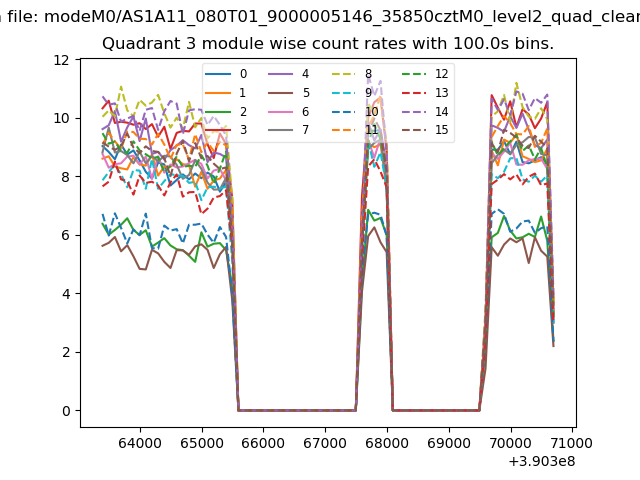
| Module-wise count rates for Quadrant A Data is divided into 100 sec bins |
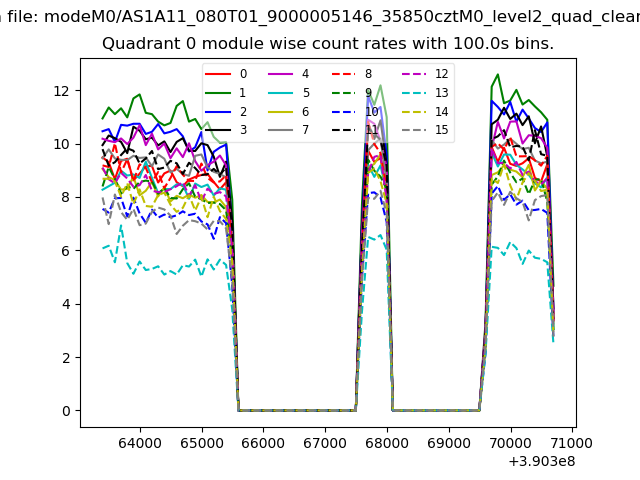 |
 |
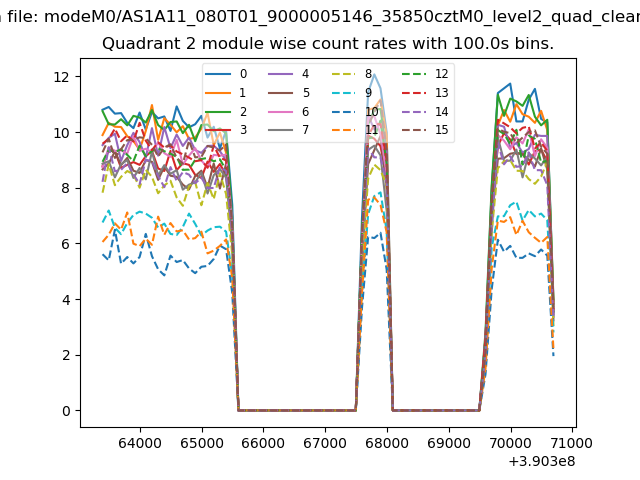
| Module-wise count rates for Quadrant B Data is divided into 100 sec bins |
 |
 |
| Module-wise count rates for Quadrant C Data is divided into 100 sec bins |
 |
 |
| Module-wise count rates for Quadrant D Data is divided into 100 sec bins |
 |
 |
| Parameter | Plot |
|---|---|
| CZT HV Monitor | 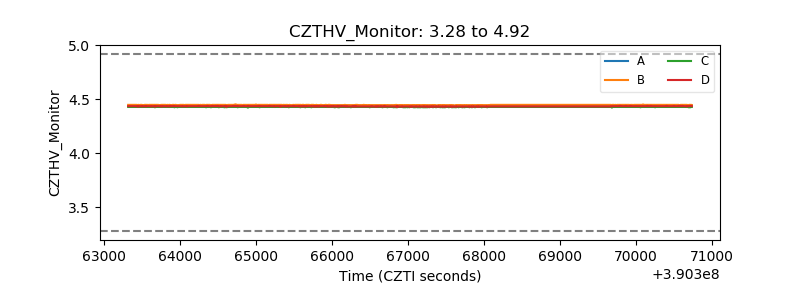 |
| D_VDD | 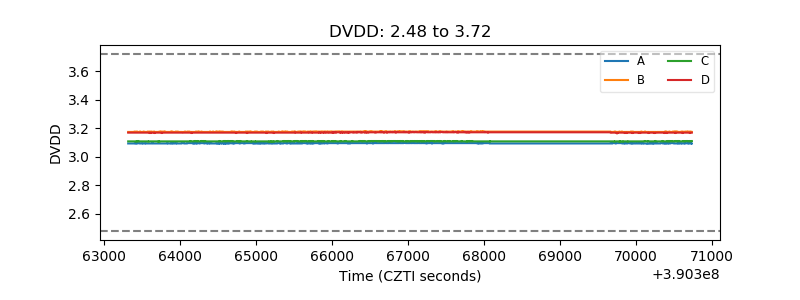 |
| Temperature 1 | 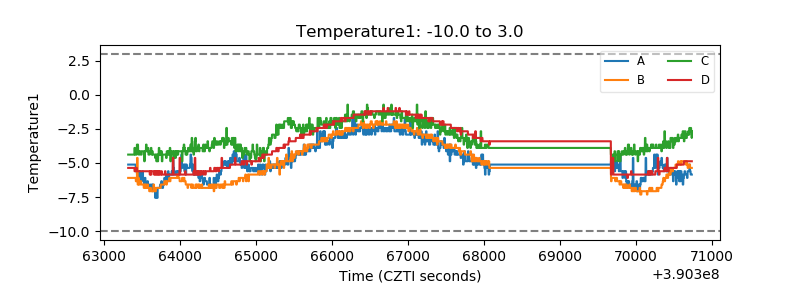 |
| Veto HV Monitor | 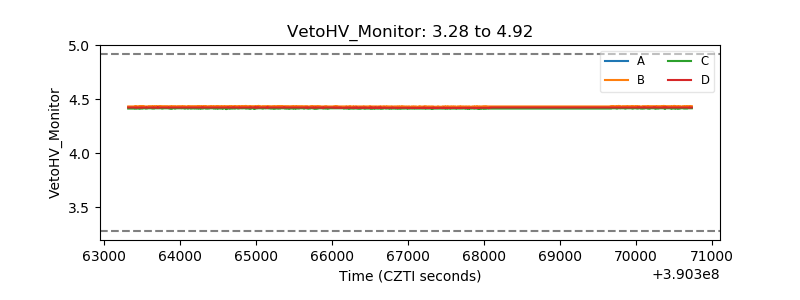 |
| Veto LLD | 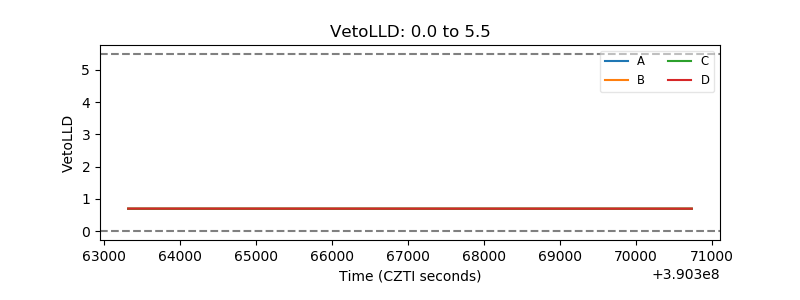 |
| Alpha Counter | 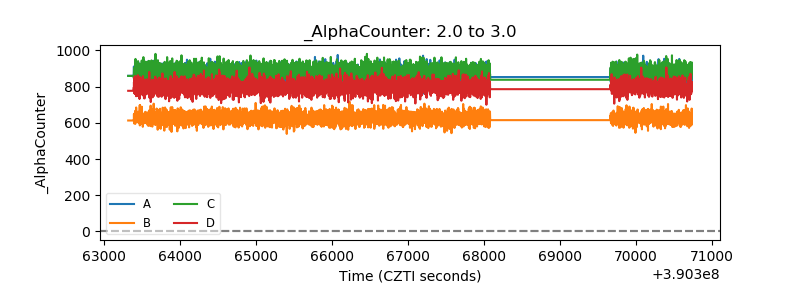 |
| _CPM_Rate | 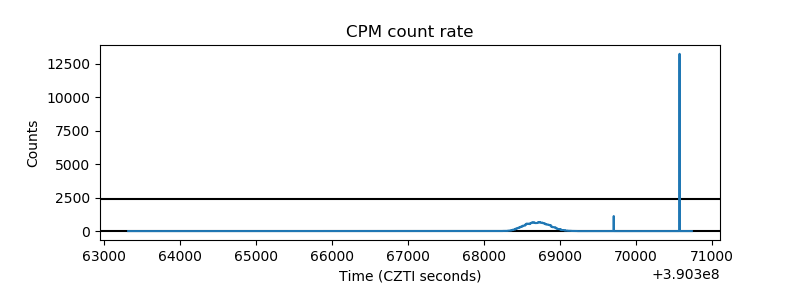 |
| CZT Counter | 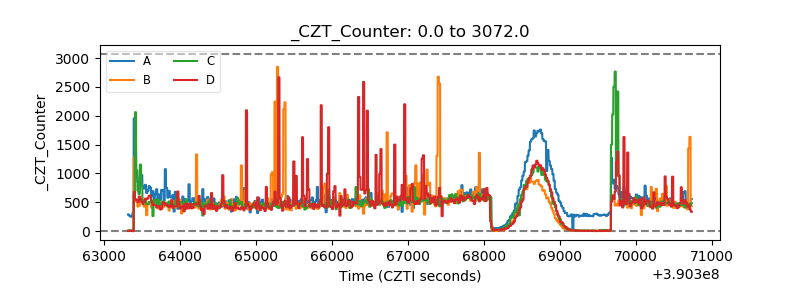 |
| +2.5 Volts monitor | 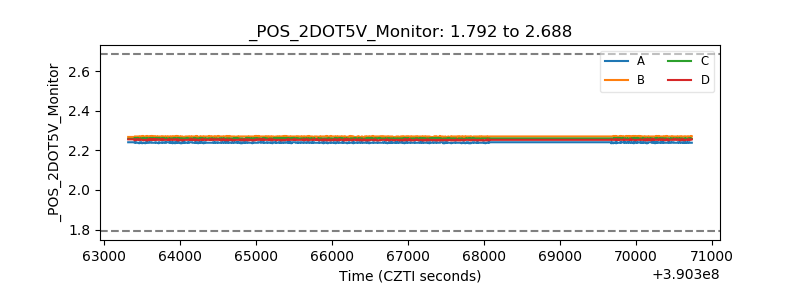 |
| +5 Volts monitor | 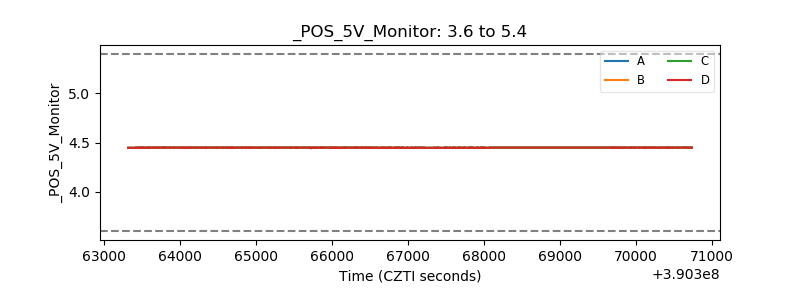 |
| _ROLL_ROT | 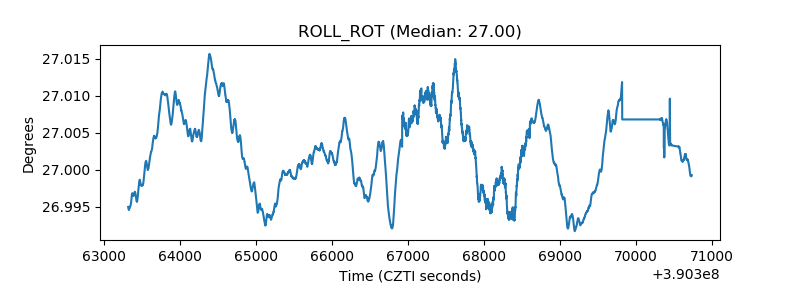 |
| _Roll_DEC | 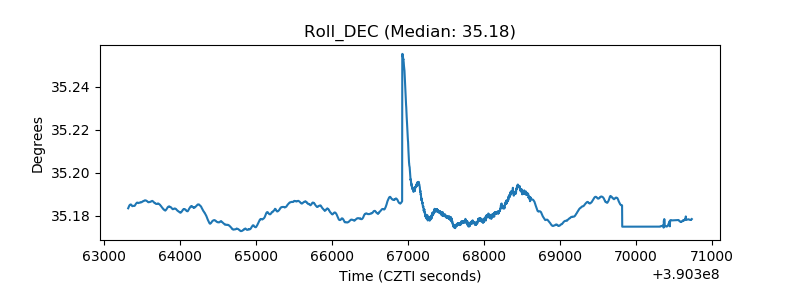 |
| _Roll_RA | 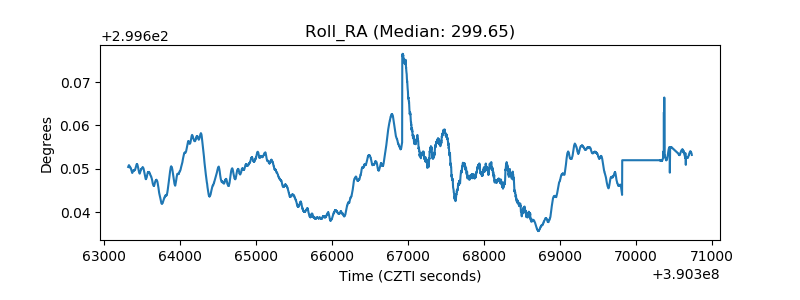 |
| Veto Counter | 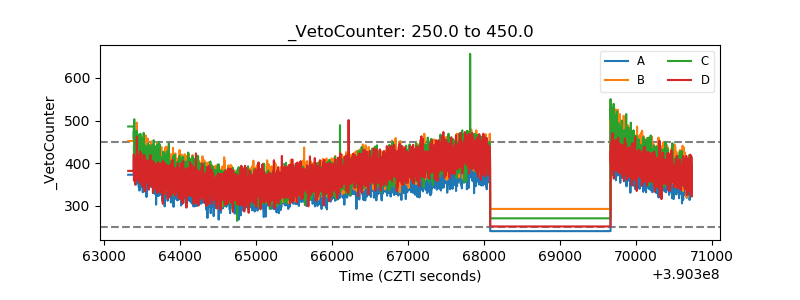 |