| Param | Original file | Final file |
|---|---|---|
| Filename | modeM0/AS1A11_080T01_9000005146_35849cztM0_level2.evt | modeM0/AS1A11_080T01_9000005146_35849cztM0_level2_quad_clean.evt |
| Size (bytes) | 816,160,320 | 149,270,400 |
| Size | 778.4 MB | 142.4 MB |
| Events in quadrant A | 6,464,432 | 949,729 |
| Events in quadrant B | 5,543,546 | 954,272 |
| Events in quadrant C | 5,664,740 | 948,265 |
| Events in quadrant D | 6,290,578 | 896,998 |
| Mode M9 | |||
|---|---|---|---|
| Quadrant | BADHDUFLAG | Total packets | Discarded packets |
| A | 0 | 41 | 0 |
| B | 0 | 41 | 0 |
| C | 0 | 41 | 0 |
| D | 0 | 41 | 0 |
| Mode SS | |||
|---|---|---|---|
| Quadrant | BADHDUFLAG | Total packets | Discarded packets |
| A | 0 | 230 | 0 |
| B | 0 | 230 | 0 |
| C | 0 | 230 | 0 |
| D | 0 | 230 | 0 |
| Mode M0 | |||
|---|---|---|---|
| Quadrant | BADHDUFLAG | Total packets | Discarded packets |
| A | 0 | 26511 | 4 |
| B | 0 | 23823 | 3 |
| C | 0 | 23584 | 3 |
| D | 0 | 26222 | 3 |
| Quadrant | Total seconds | Saturated seconds | Saturation percentage |
|---|---|---|---|
| A | 11147 | 38 | 0.340899% |
| B | 11147 | 48 | 0.430609% |
| C | 11147 | 63 | 0.565174% |
| D | 11147 | 187 | 1.677581% |
Noise dominated data is calculated using 1-second bins in cleaned event files. If a bin has >2000 counts, and if more than 50% of those come from <1% of pixels, then it is considered to be noise-dominated and hence unusable.
| Quadrant | # 1 sec bins | Bins with >0 counts | Bins with >2000 counts | High rate bins dominated by noise | Noise dominated (total time) | Noise dominated (detector-on time) | Marked lightcurve |
|---|---|---|---|---|---|---|---|
| A | 15236 | 11150 | 30 | 30 | 0.20% | 0.27% |  |
| B | 15236 | 11150 | 21 | 21 | 0.14% | 0.19% |  |
| C | 15236 | 11150 | 45 | 45 | 0.30% | 0.40% |  |
| D | 15236 | 11150 | 132 | 132 | 0.87% | 1.18% |  |
Top three noisy pixels from each quadrant. If the there are fewer than three noisy pixels in the level2.evt file, extra rows are filled as -1
| Pixel properties | Quadrant properties | ||||||
|---|---|---|---|---|---|---|---|
| Quadrant | DetID | PixID | Counts | Sigma | Mean | Median | Sigma |
| A | 15 | 169 | 1118995 | 4249.08 | 1305 | 1285 | 263.0 |
| A | 10 | 83 | 282913 | 1070.63 | 1305 | 1285 | 263.0 |
| A | 13 | 6 | 20796 | 74.17 | 1305 | 1285 | 263.0 |
| B | 5 | 172 | 182642 | 738.51 | 1292 | 1260 | 245.6 |
| B | 0 | 213 | 133506 | 538.45 | 1292 | 1260 | 245.6 |
| B | 0 | 214 | 37928 | 149.3 | 1292 | 1260 | 245.6 |
| C | 15 | 214 | 465756 | 1583.24 | 1265 | 1274 | 293.4 |
| C | 0 | 10 | 210162 | 712.02 | 1265 | 1274 | 293.4 |
| C | 0 | 207 | 42534 | 140.64 | 1265 | 1274 | 293.4 |
| D | 13 | 249 | 531543 | 1739.94 | 1254 | 1222 | 304.8 |
| D | 8 | 195 | 230410 | 751.95 | 1254 | 1222 | 304.8 |
| D | 10 | 118 | 189123 | 616.49 | 1254 | 1222 | 304.8 |
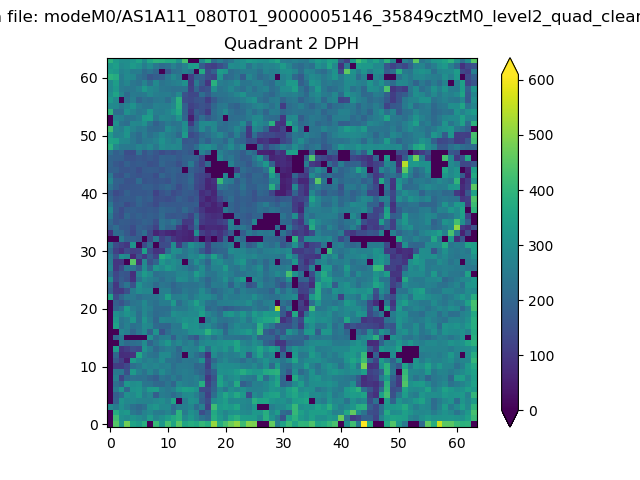
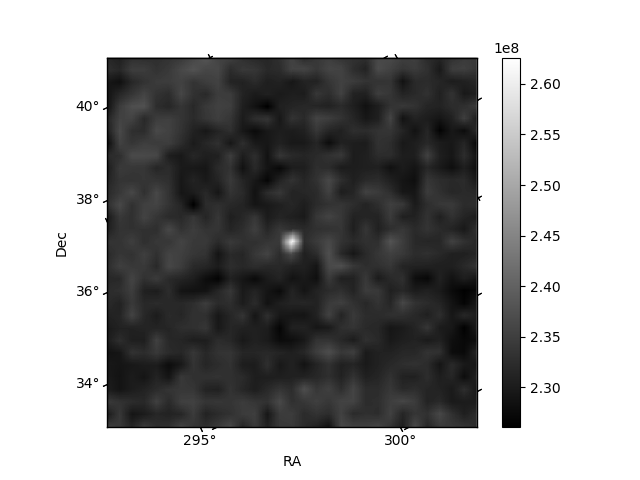
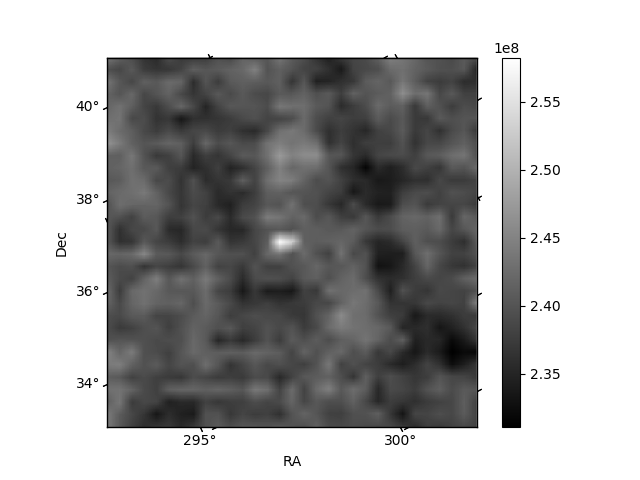
Histogram calculated using DETX and DETY for each event in the final _common_clean file
| Quadrant A | 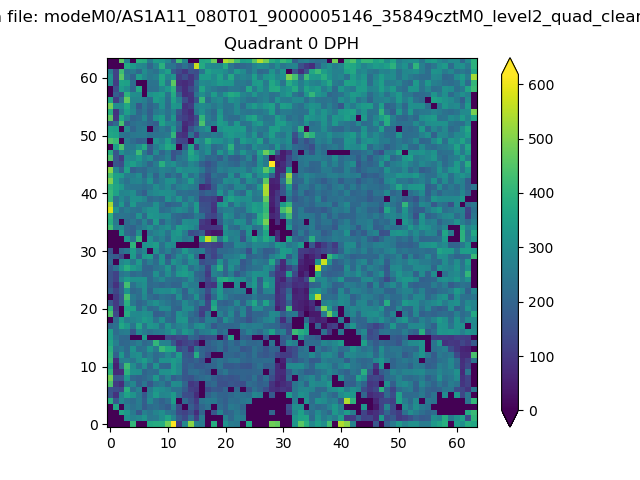 |
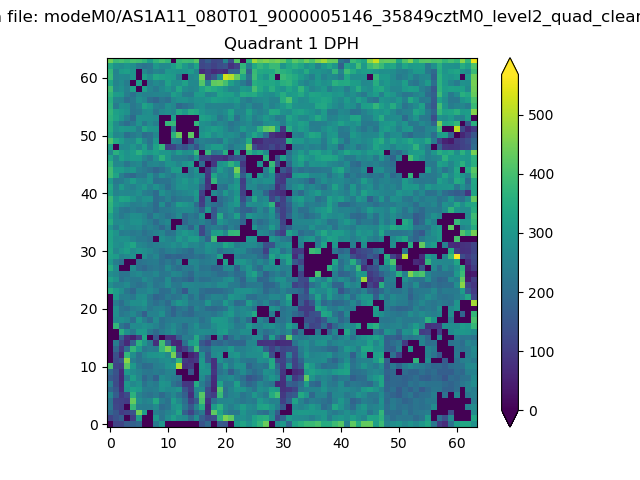 |
Quadrant B |
|---|---|---|---|
| Quadrant D | 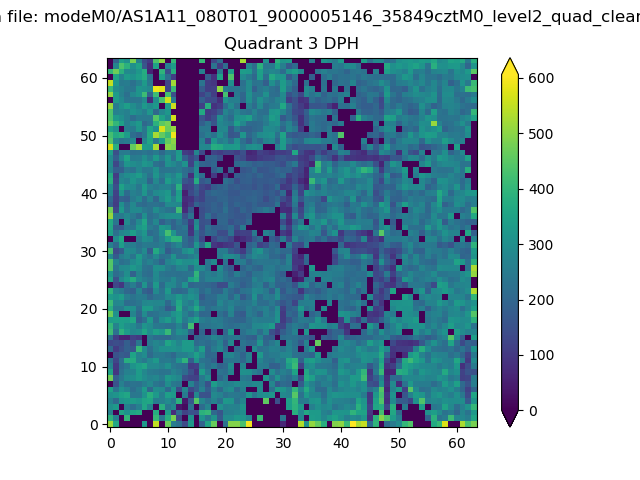 |
 |
Quadrant C |
| Plot type | Count rate plots | Images |
|---|---|---|
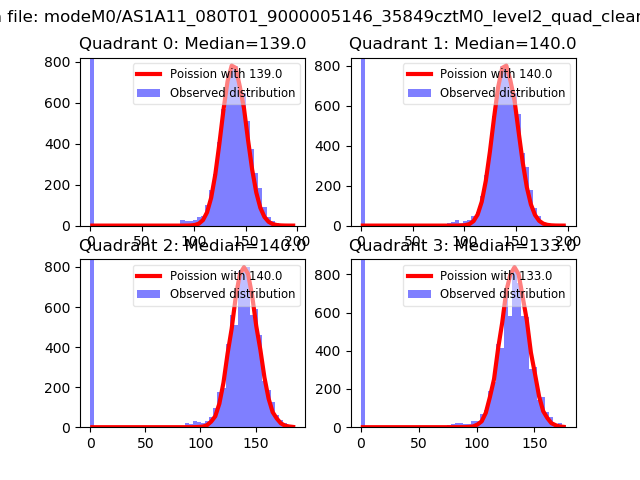
| Comparison with Poisson distribution Blue bars denote a histogram of data divided into 1 sec bins. Red curve is a Poisson curve with rate = median count rate of data. |
 |
 |
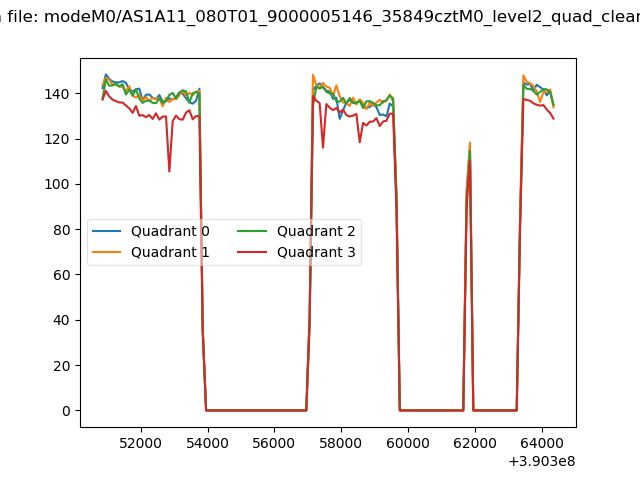
| Quadrant-wise count rates Data is divided into 100 sec bins |
 |
|
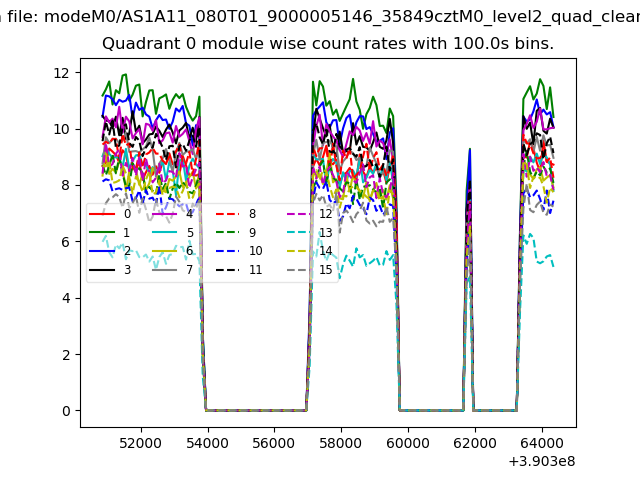
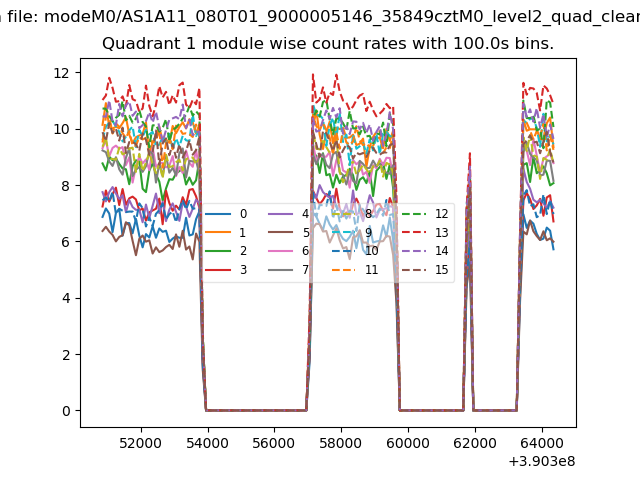
| Module-wise count rates for Quadrant A Data is divided into 100 sec bins |
 |
 |
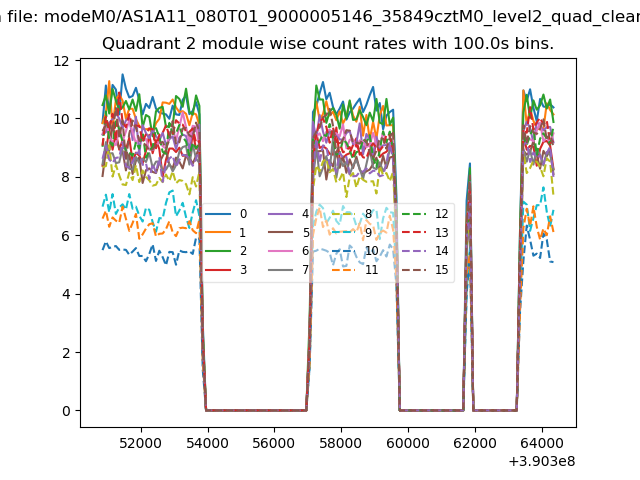
| Module-wise count rates for Quadrant B Data is divided into 100 sec bins |
 |
 |
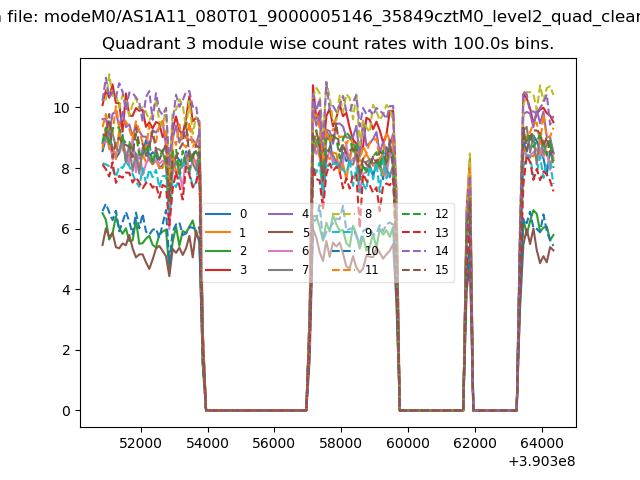
| Module-wise count rates for Quadrant C Data is divided into 100 sec bins |
 |
 |
| Module-wise count rates for Quadrant D Data is divided into 100 sec bins |
 |
 |
| Parameter | Plot |
|---|---|
| CZT HV Monitor | 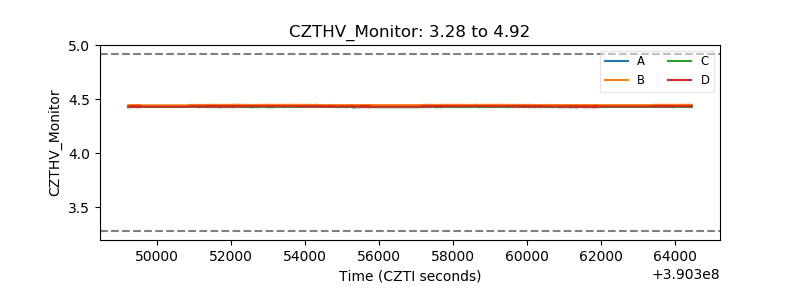 |
| D_VDD | 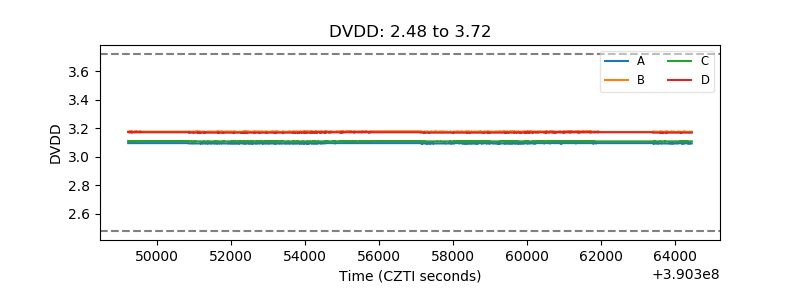 |
| Temperature 1 | 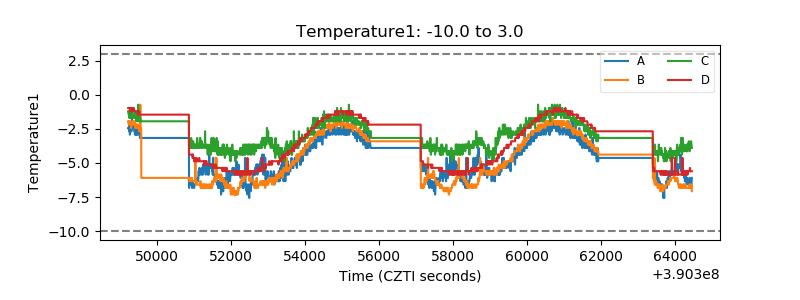 |
| Veto HV Monitor | 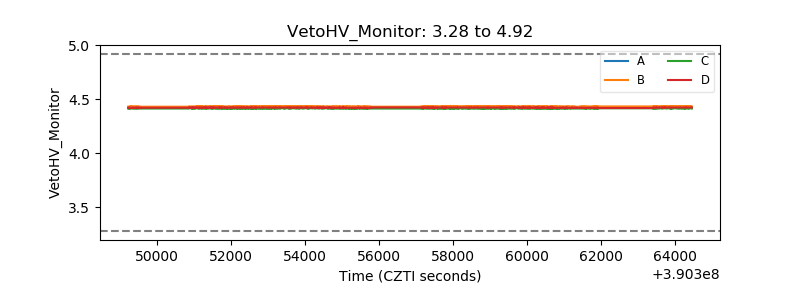 |
| Veto LLD | 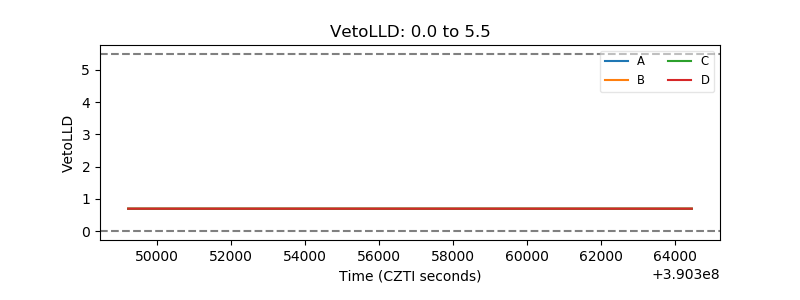 |
| Alpha Counter | 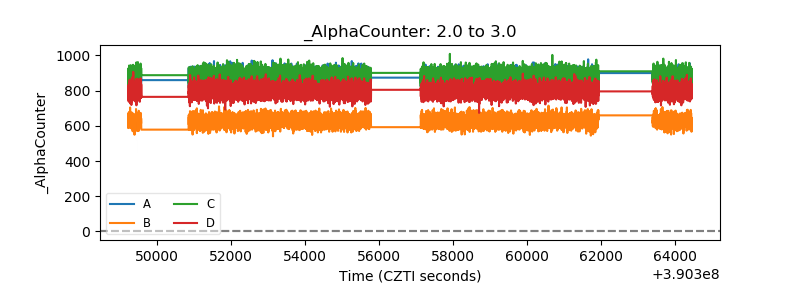 |
| _CPM_Rate | 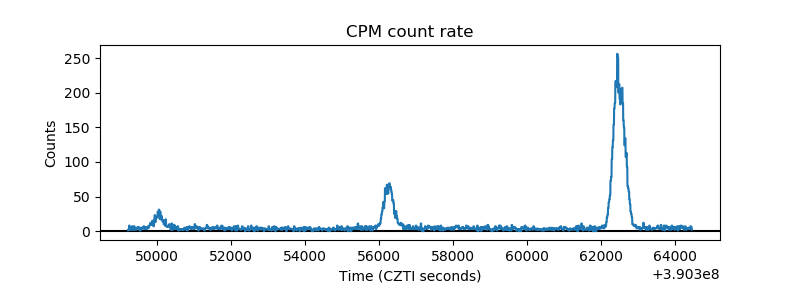 |
| CZT Counter | 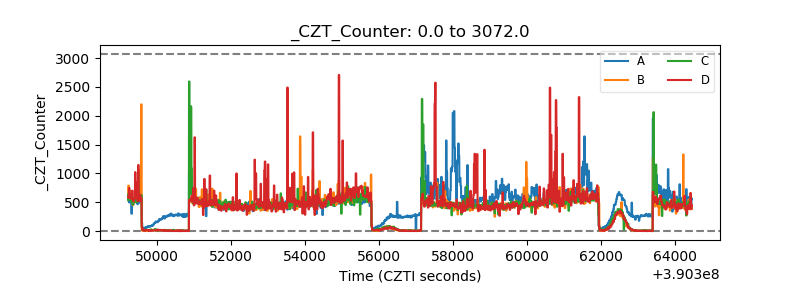 |
| +2.5 Volts monitor | 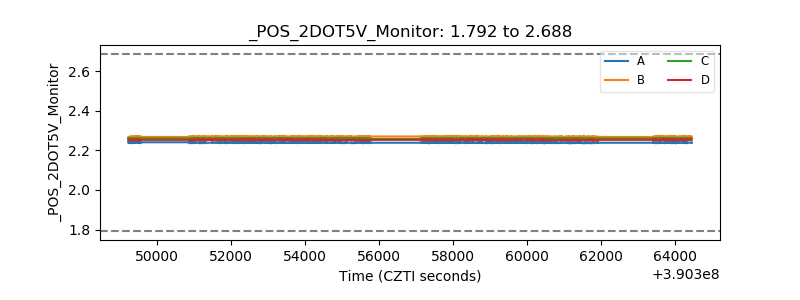 |
| +5 Volts monitor | 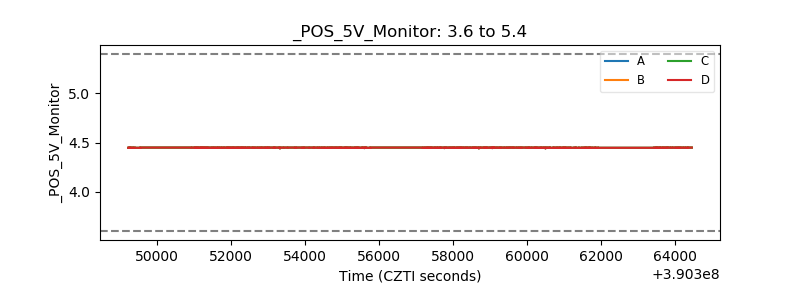 |
| _ROLL_ROT | 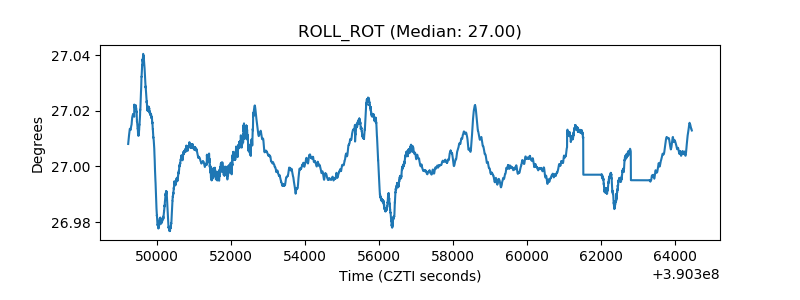 |
| _Roll_DEC | 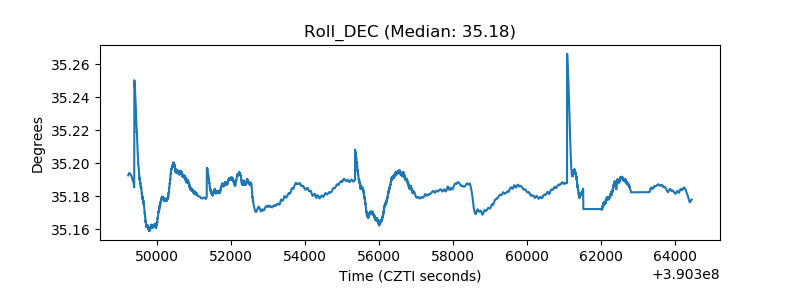 |
| _Roll_RA | 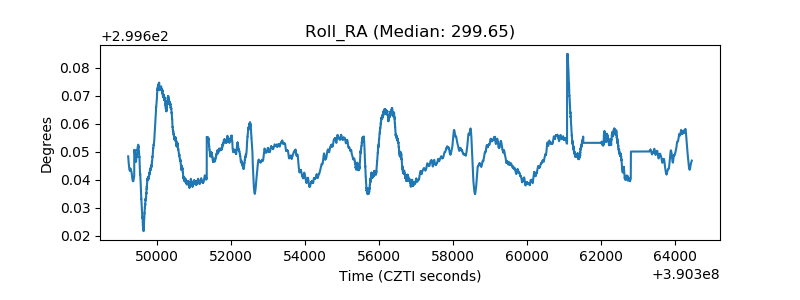 |
| Veto Counter | 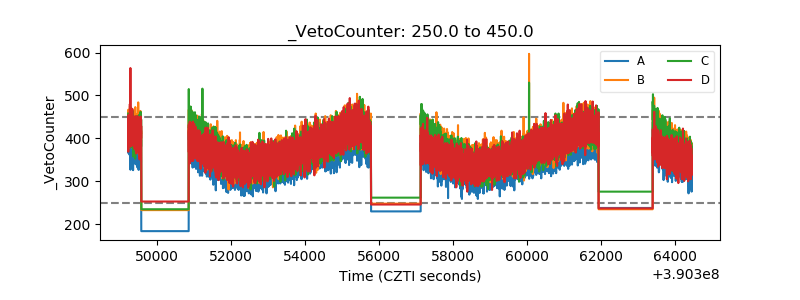 |