| Param | Original file | Final file |
|---|---|---|
| Filename | modeM0/AS1A11_080T01_9000005146_35842cztM0_level2.evt | modeM0/AS1A11_080T01_9000005146_35842cztM0_level2_quad_clean.evt |
| Size (bytes) | 463,112,640 | 61,879,680 |
| Size | 441.7 MB | 59.0 MB |
| Events in quadrant A | 4,092,257 | 382,919 |
| Events in quadrant B | 3,042,016 | 387,710 |
| Events in quadrant C | 3,191,469 | 382,653 |
| Events in quadrant D | 3,359,364 | 368,448 |
| Mode M9 | |||
|---|---|---|---|
| Quadrant | BADHDUFLAG | Total packets | Discarded packets |
| A | 0 | 28 | 0 |
| B | 0 | 28 | 0 |
| C | 0 | 28 | 0 |
| D | 0 | 29 | 0 |
| Mode SS | |||
|---|---|---|---|
| Quadrant | BADHDUFLAG | Total packets | Discarded packets |
| A | 0 | 102 | 0 |
| B | 0 | 102 | 0 |
| C | 0 | 102 | 0 |
| D | 0 | 102 | 0 |
| Mode M0 | |||
|---|---|---|---|
| Quadrant | BADHDUFLAG | Total packets | Discarded packets |
| A | 0 | 15477 | 3 |
| B | 0 | 12017 | 2 |
| C | 0 | 12106 | 2 |
| D | 0 | 12977 | 2 |
| Quadrant | Total seconds | Saturated seconds | Saturation percentage |
|---|---|---|---|
| A | 5019 | 274 | 5.459255% |
| B | 5019 | 49 | 0.976290% |
| C | 5019 | 217 | 4.323570% |
| D | 5019 | 201 | 4.004782% |
Noise dominated data is calculated using 1-second bins in cleaned event files. If a bin has >2000 counts, and if more than 50% of those come from <1% of pixels, then it is considered to be noise-dominated and hence unusable.
| Quadrant | # 1 sec bins | Bins with >0 counts | Bins with >2000 counts | High rate bins dominated by noise | Noise dominated (total time) | Noise dominated (detector-on time) | Marked lightcurve |
|---|---|---|---|---|---|---|---|
| A | 7171 | 5020 | 275 | 275 | 3.83% | 5.48% | 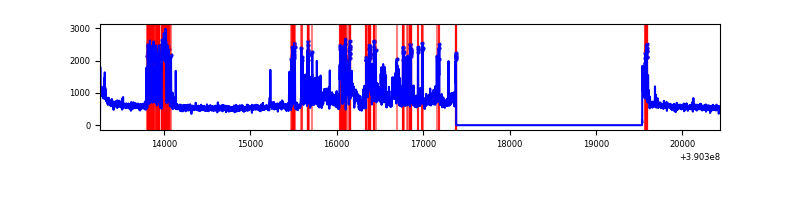 |
| B | 7171 | 5020 | 17 | 17 | 0.24% | 0.34% | 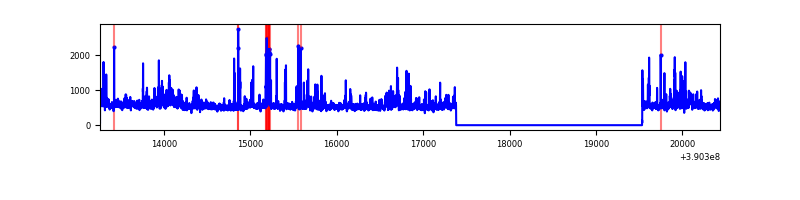 |
| C | 7171 | 5020 | 174 | 174 | 2.43% | 3.47% | 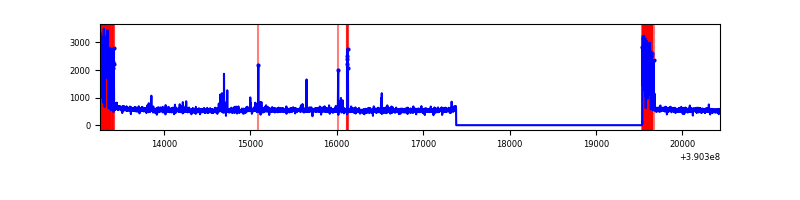 |
| D | 7171 | 5020 | 167 | 167 | 2.33% | 3.33% | 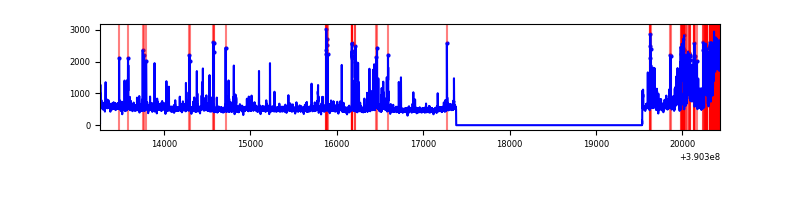 |
Top three noisy pixels from each quadrant. If the there are fewer than three noisy pixels in the level2.evt file, extra rows are filled as -1
| Pixel properties | Quadrant properties | ||||||
|---|---|---|---|---|---|---|---|
| Quadrant | DetID | PixID | Counts | Sigma | Mean | Median | Sigma |
| A | 15 | 169 | 1402042 | 10696.95 | 653 | 644 | 131.0 |
| A | 10 | 83 | 153209 | 1164.54 | 653 | 644 | 131.0 |
| A | 13 | 6 | 12725 | 92.21 | 653 | 644 | 131.0 |
| B | 4 | 232 | 165208 | 1341.23 | 652 | 640 | 122.7 |
| B | 0 | 213 | 140641 | 1141.01 | 652 | 640 | 122.7 |
| B | 5 | 172 | 90915 | 735.74 | 652 | 640 | 122.7 |
| C | 0 | 10 | 486246 | 3407.3 | 621 | 630 | 142.5 |
| C | 15 | 214 | 206859 | 1446.99 | 621 | 630 | 142.5 |
| C | 15 | 208 | 78583 | 546.95 | 621 | 630 | 142.5 |
| D | 2 | 250 | 373696 | 2394.59 | 636 | 621 | 155.8 |
| D | 7 | 223 | 309294 | 1981.22 | 636 | 621 | 155.8 |
| D | 13 | 249 | 62543 | 397.45 | 636 | 621 | 155.8 |
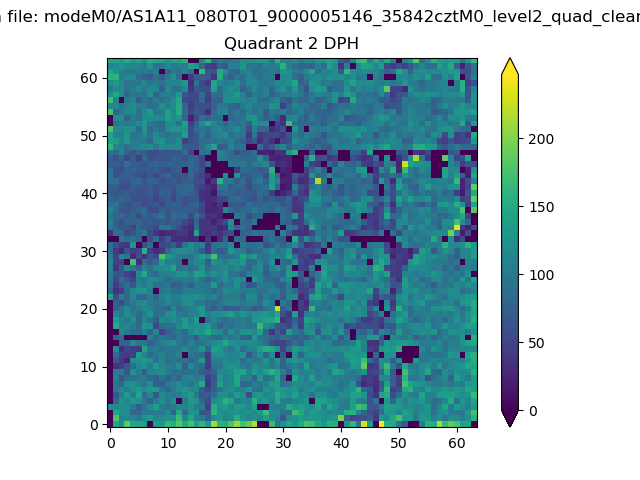
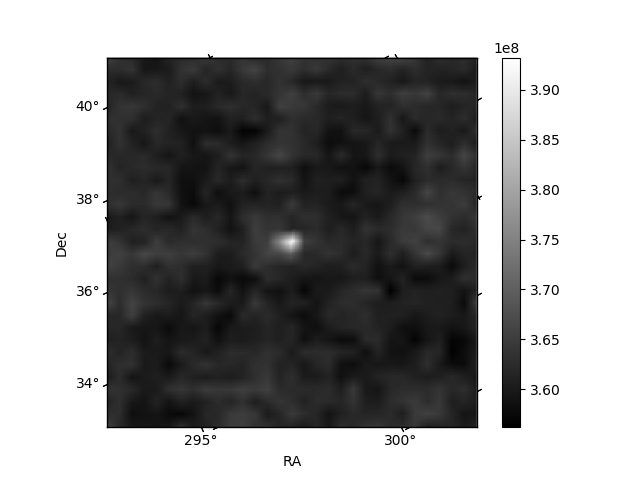
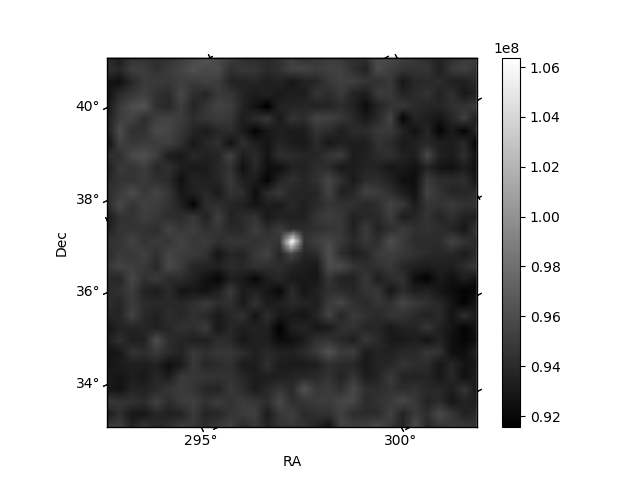
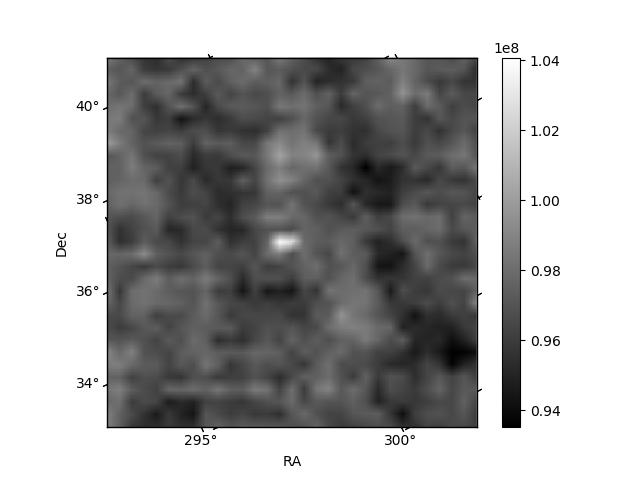
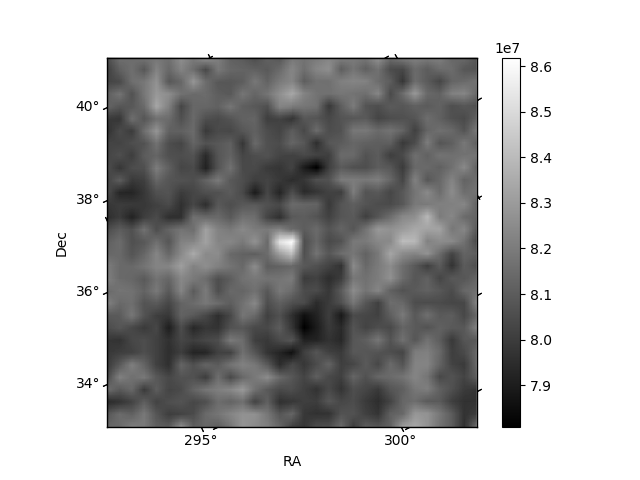
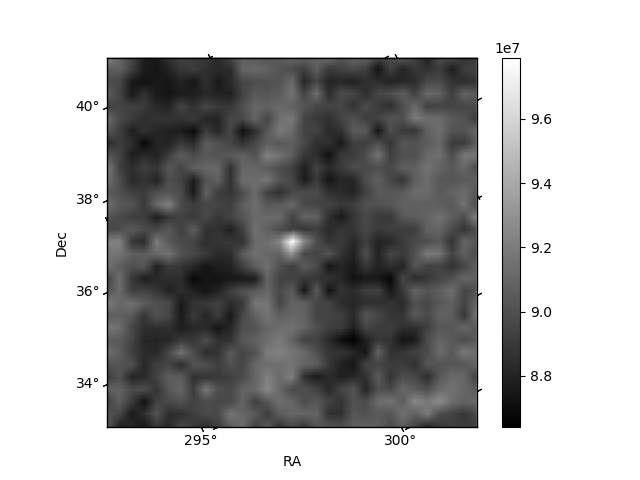
Histogram calculated using DETX and DETY for each event in the final _common_clean file
| Quadrant A | 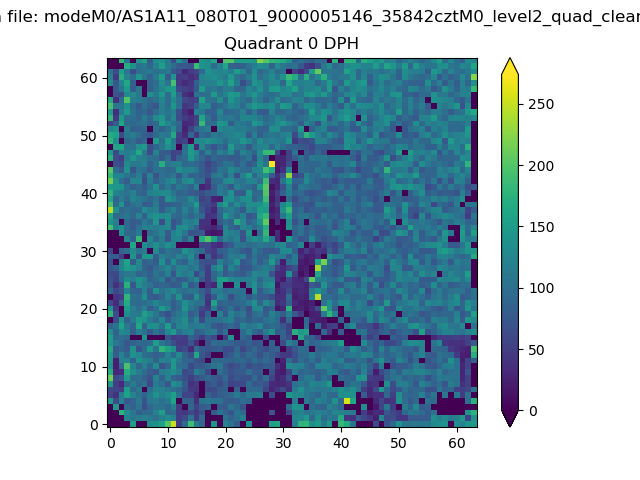 |
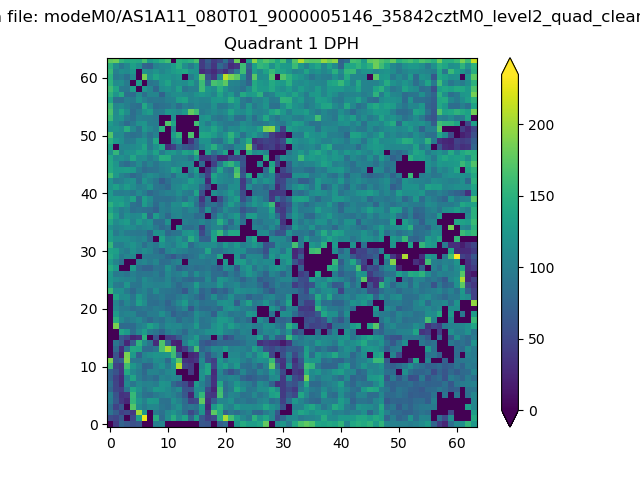 |
Quadrant B |
|---|---|---|---|
| Quadrant D | 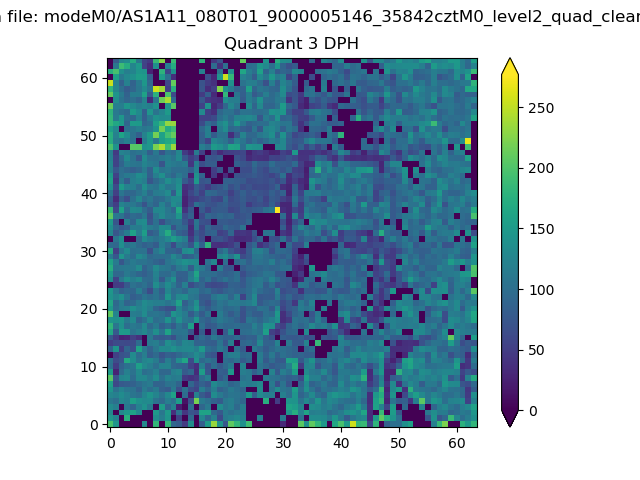 |
 |
Quadrant C |
| Plot type | Count rate plots | Images |
|---|---|---|
| Comparison with Poisson distribution Blue bars denote a histogram of data divided into 1 sec bins. Red curve is a Poisson curve with rate = median count rate of data. |
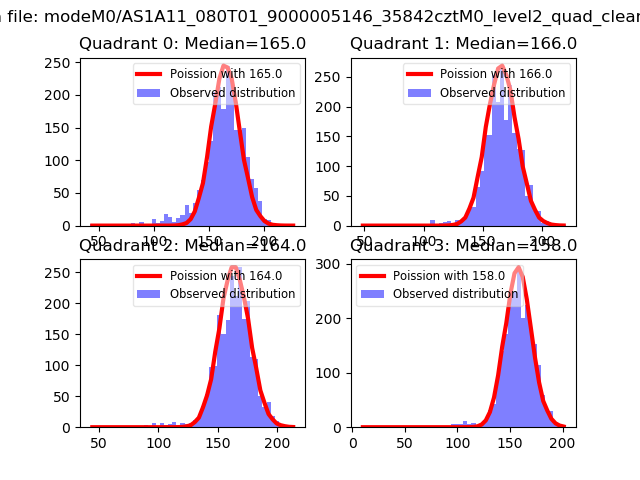 |
 |
| Quadrant-wise count rates Data is divided into 100 sec bins |
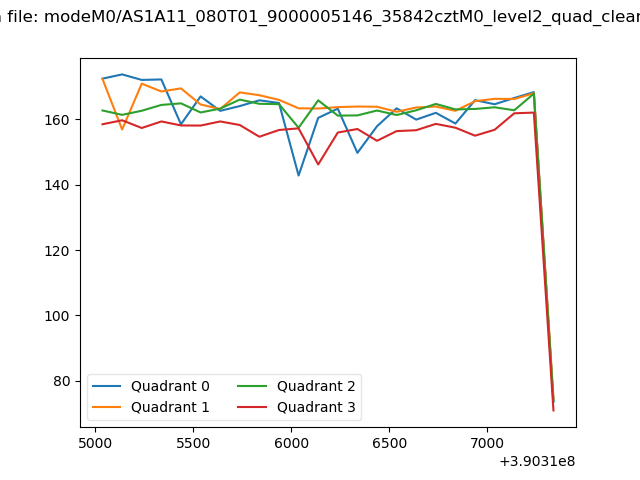 |
|
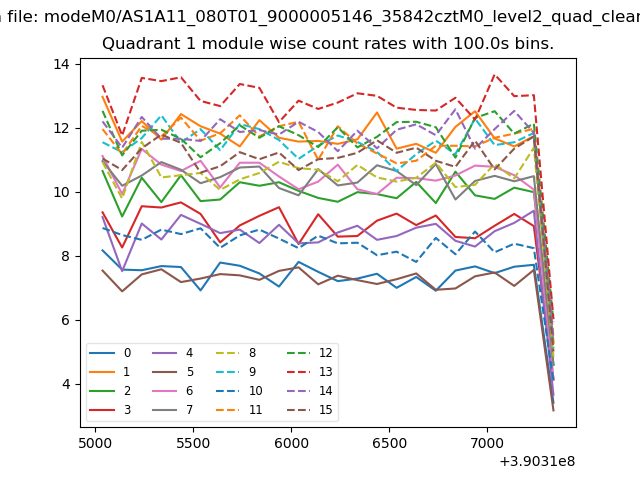
| Module-wise count rates for Quadrant A Data is divided into 100 sec bins |
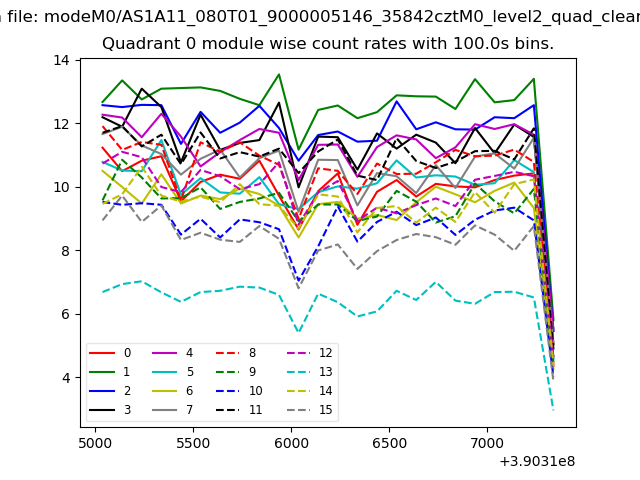 |
 |
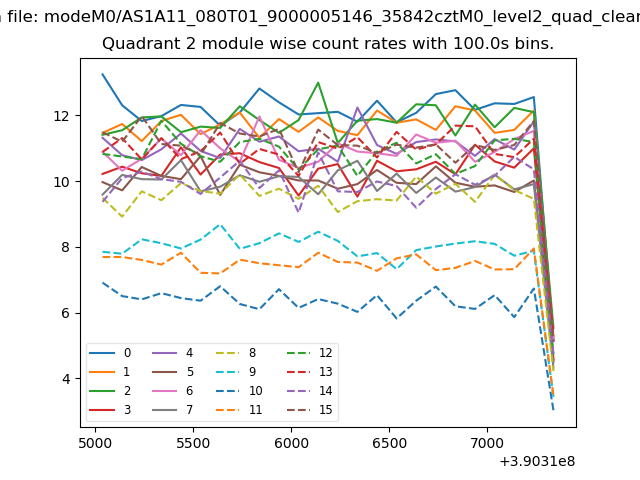
| Module-wise count rates for Quadrant B Data is divided into 100 sec bins |
 |
 |
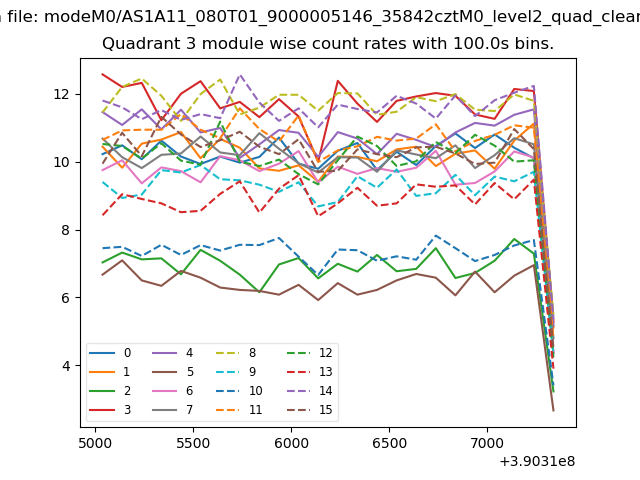
| Module-wise count rates for Quadrant C Data is divided into 100 sec bins |
 |
 |
| Module-wise count rates for Quadrant D Data is divided into 100 sec bins |
 |
 |
| Parameter | Plot |
|---|---|
| CZT HV Monitor |  |
| D_VDD | 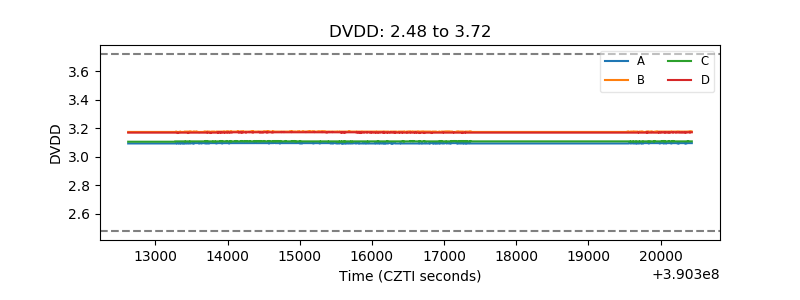 |
| Temperature 1 | 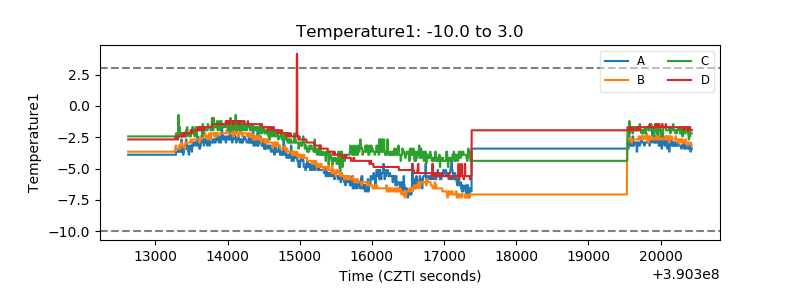 |
| Veto HV Monitor | 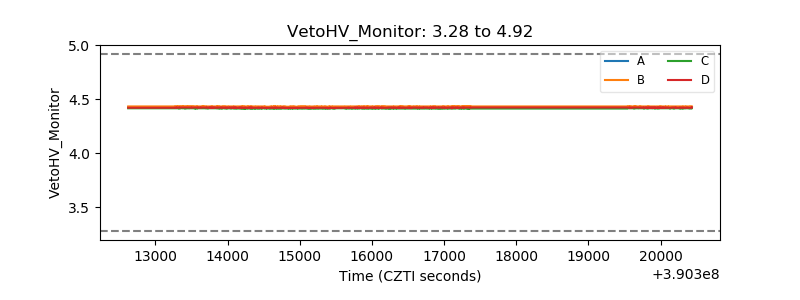 |
| Veto LLD | 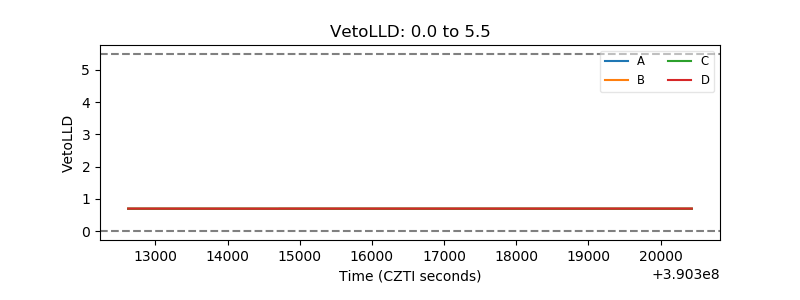 |
| Alpha Counter | 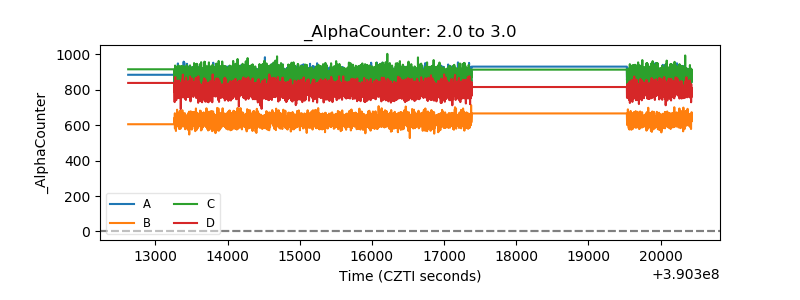 |
| _CPM_Rate | 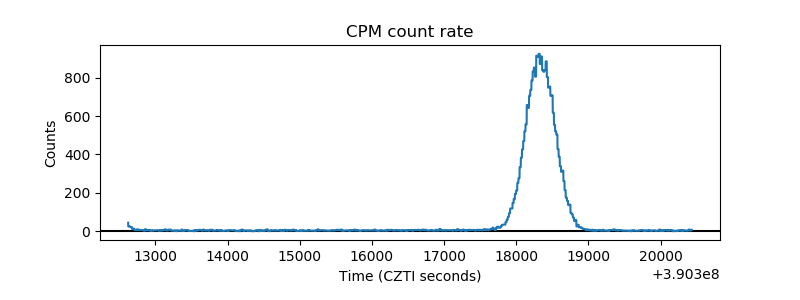 |
| CZT Counter | 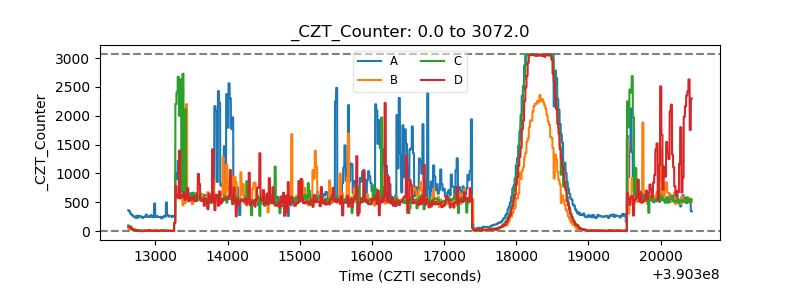 |
| +2.5 Volts monitor | 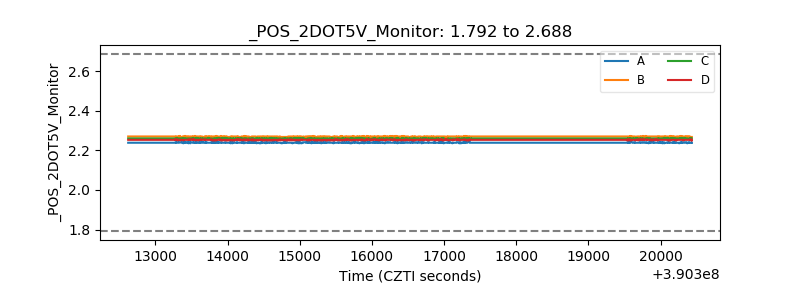 |
| +5 Volts monitor | 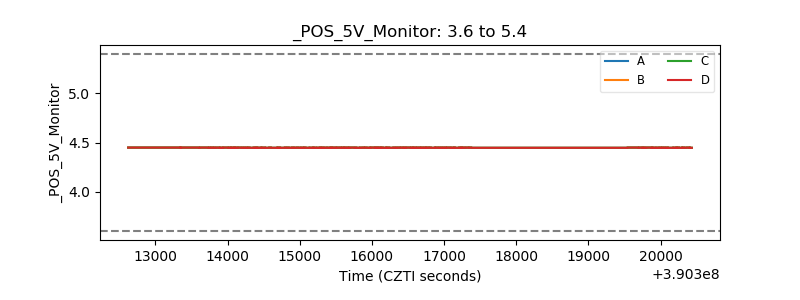 |
| _ROLL_ROT | 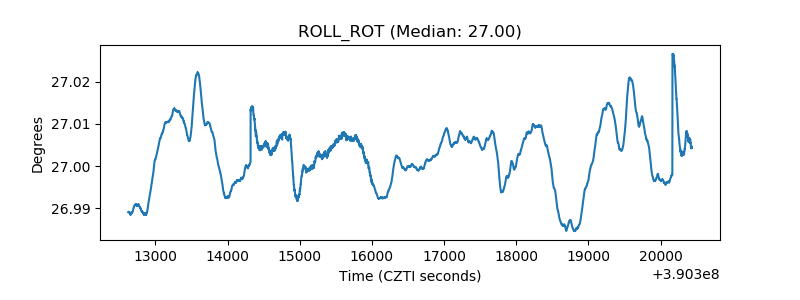 |
| _Roll_DEC | 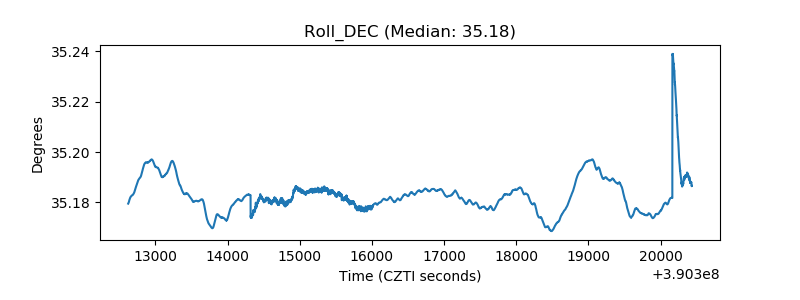 |
| _Roll_RA | 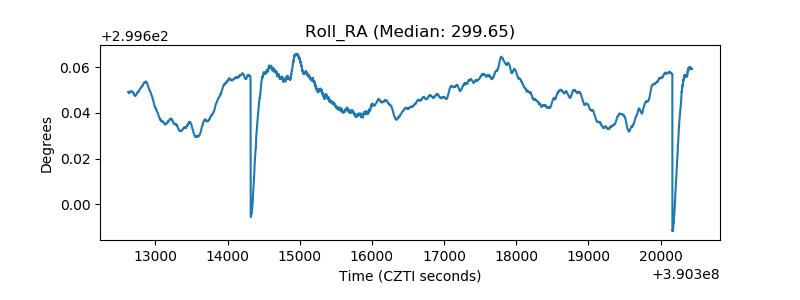 |
| Veto Counter | 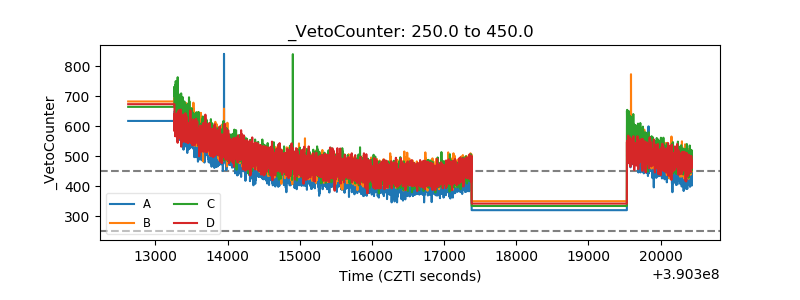 |