| Param | Original file | Final file |
|---|---|---|
| Filename | modeM0/AS1A11_080T01_9000005146_35840cztM0_level2.evt | modeM0/AS1A11_080T01_9000005146_35840cztM0_level2_quad_clean.evt |
| Size (bytes) | 494,651,520 | 63,480,960 |
| Size | 471.7 MB | 60.5 MB |
| Events in quadrant A | 3,678,015 | 403,593 |
| Events in quadrant B | 3,104,237 | 403,276 |
| Events in quadrant C | 4,017,985 | 372,243 |
| Events in quadrant D | 3,821,648 | 372,196 |
| Mode M9 | |||
|---|---|---|---|
| Quadrant | BADHDUFLAG | Total packets | Discarded packets |
| A | 0 | 21 | 0 |
| B | 0 | 21 | 0 |
| C | 0 | 21 | 0 |
| D | 0 | 22 | 0 |
| Mode SS | |||
|---|---|---|---|
| Quadrant | BADHDUFLAG | Total packets | Discarded packets |
| A | 0 | 108 | 0 |
| B | 0 | 108 | 0 |
| C | 0 | 108 | 0 |
| D | 0 | 108 | 0 |
| Mode M0 | |||
|---|---|---|---|
| Quadrant | BADHDUFLAG | Total packets | Discarded packets |
| A | 0 | 14287 | 3 |
| B | 0 | 12338 | 2 |
| C | 0 | 15016 | 2 |
| D | 0 | 14839 | 2 |
| Quadrant | Total seconds | Saturated seconds | Saturation percentage |
|---|---|---|---|
| A | 5292 | 141 | 2.664399% |
| B | 5292 | 52 | 0.982615% |
| C | 5292 | 379 | 7.161754% |
| D | 5292 | 181 | 3.420257% |
Noise dominated data is calculated using 1-second bins in cleaned event files. If a bin has >2000 counts, and if more than 50% of those come from <1% of pixels, then it is considered to be noise-dominated and hence unusable.
| Quadrant | # 1 sec bins | Bins with >0 counts | Bins with >2000 counts | High rate bins dominated by noise | Noise dominated (total time) | Noise dominated (detector-on time) | Marked lightcurve |
|---|---|---|---|---|---|---|---|
| A | 7325 | 5293 | 111 | 111 | 1.52% | 2.10% | 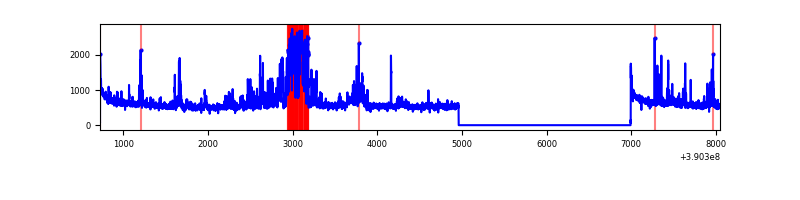 |
| B | 7325 | 5293 | 25 | 25 | 0.34% | 0.47% | 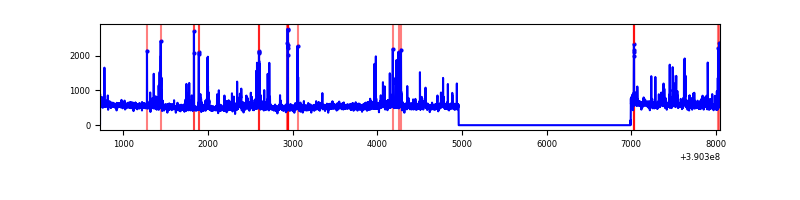 |
| C | 7325 | 5293 | 363 | 363 | 4.96% | 6.86% | 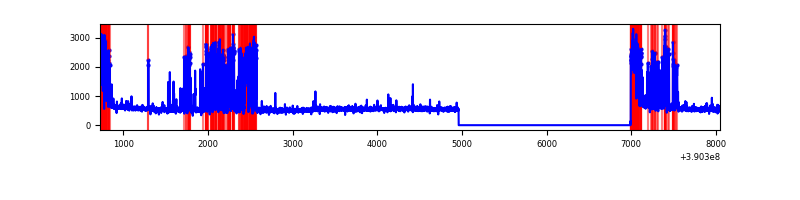 |
| D | 7325 | 5293 | 163 | 163 | 2.23% | 3.08% | 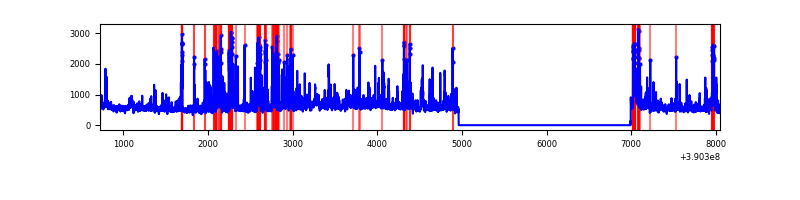 |
Top three noisy pixels from each quadrant. If the there are fewer than three noisy pixels in the level2.evt file, extra rows are filled as -1
| Pixel properties | Quadrant properties | ||||||
|---|---|---|---|---|---|---|---|
| Quadrant | DetID | PixID | Counts | Sigma | Mean | Median | Sigma |
| A | 15 | 169 | 747485 | 5264.49 | 711 | 701 | 141.9 |
| A | 10 | 83 | 158437 | 1111.97 | 711 | 701 | 141.9 |
| A | 13 | 6 | 14995 | 100.77 | 711 | 701 | 141.9 |
| B | 0 | 213 | 114496 | 863.76 | 697 | 683 | 131.8 |
| B | 5 | 172 | 100289 | 755.94 | 697 | 683 | 131.8 |
| B | 4 | 232 | 59418 | 445.76 | 697 | 683 | 131.8 |
| C | 15 | 208 | 763447 | 5115.67 | 649 | 658 | 149.1 |
| C | 0 | 10 | 488037 | 3268.62 | 649 | 658 | 149.1 |
| C | 15 | 214 | 216655 | 1448.59 | 649 | 658 | 149.1 |
| D | 7 | 223 | 293102 | 1796.74 | 678 | 663 | 162.8 |
| D | 13 | 249 | 283241 | 1736.16 | 678 | 663 | 162.8 |
| D | 2 | 250 | 184307 | 1128.31 | 678 | 663 | 162.8 |
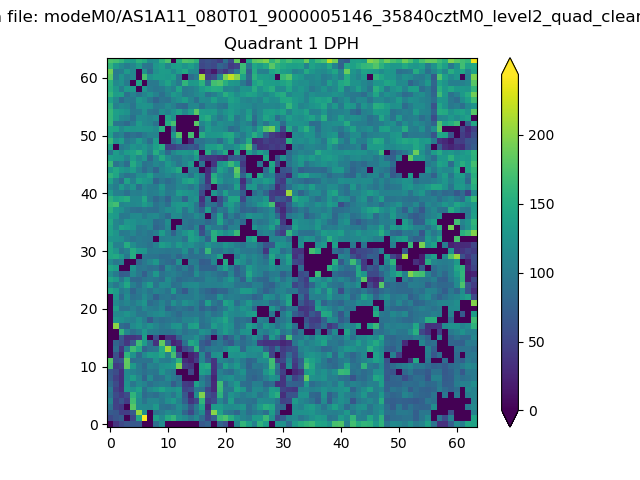
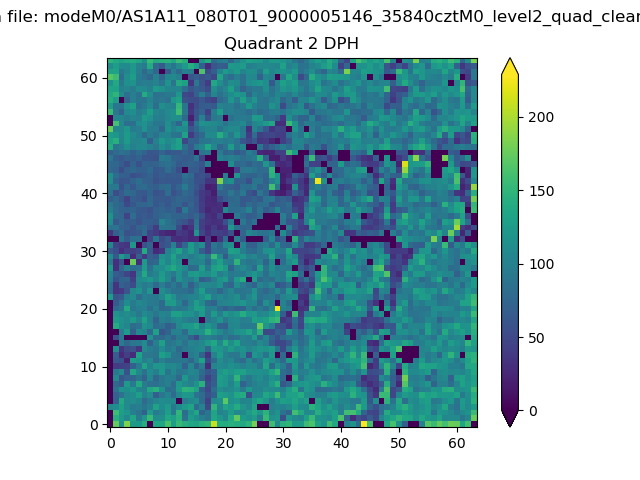
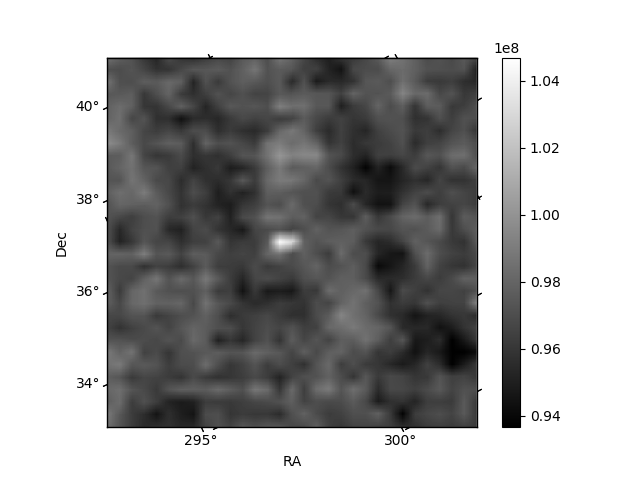
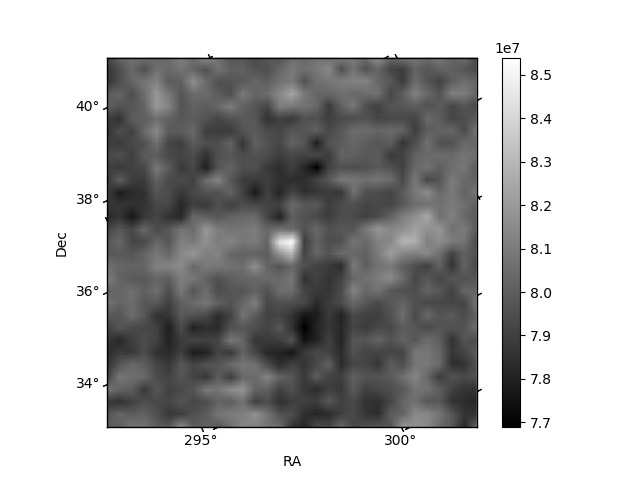
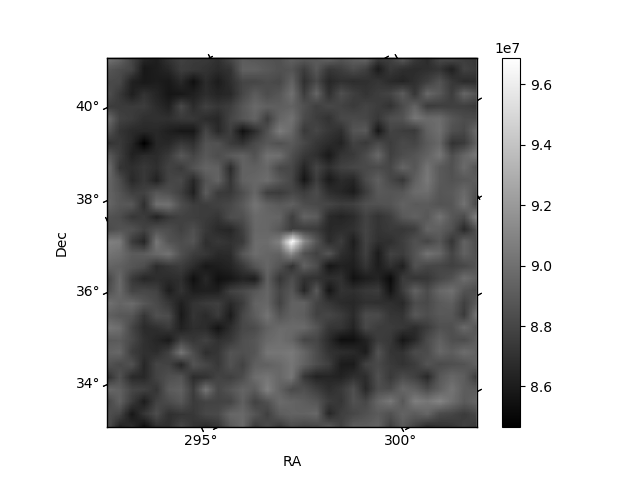
Histogram calculated using DETX and DETY for each event in the final _common_clean file
| Quadrant A |  |
 |
Quadrant B |
|---|---|---|---|
| Quadrant D | 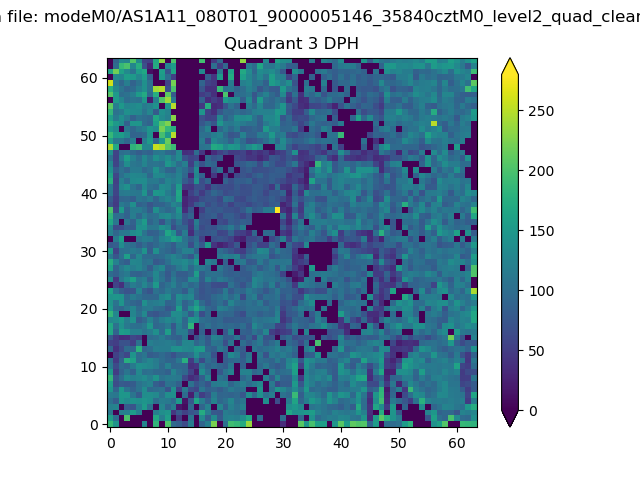 |
 |
Quadrant C |
| Plot type | Count rate plots | Images |
|---|---|---|
| Comparison with Poisson distribution Blue bars denote a histogram of data divided into 1 sec bins. Red curve is a Poisson curve with rate = median count rate of data. |
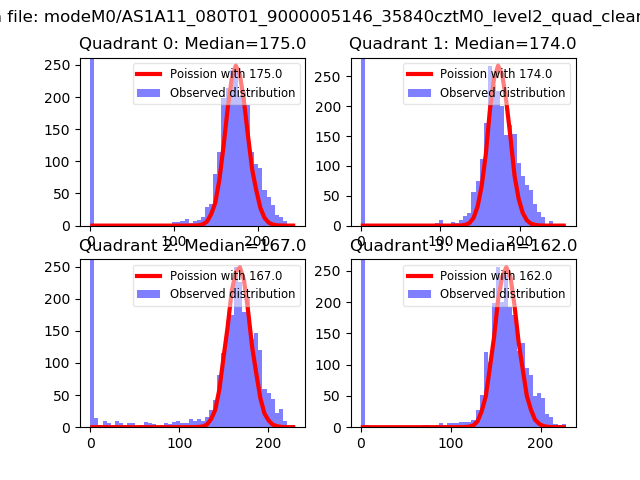 |
 |
| Quadrant-wise count rates Data is divided into 100 sec bins |
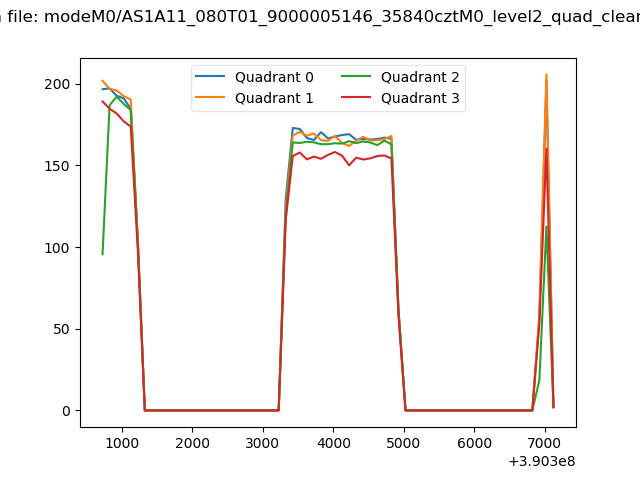 |
|
| Module-wise count rates for Quadrant A Data is divided into 100 sec bins |
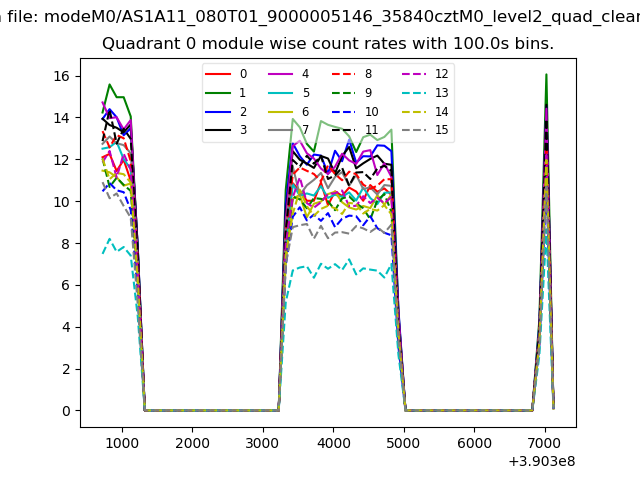 |
 |
| Module-wise count rates for Quadrant B Data is divided into 100 sec bins |
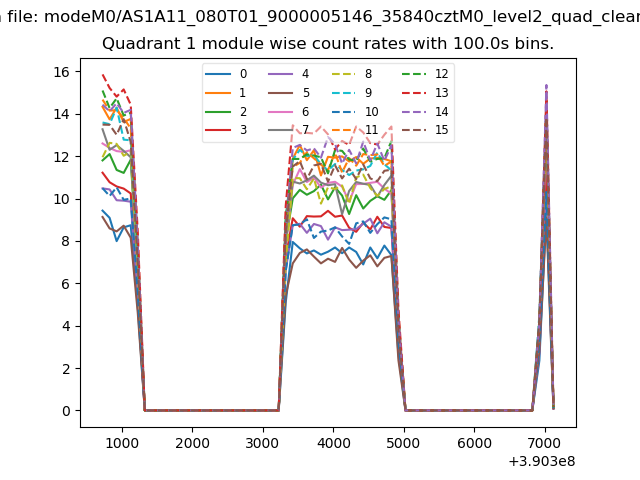 |
 |
| Module-wise count rates for Quadrant C Data is divided into 100 sec bins |
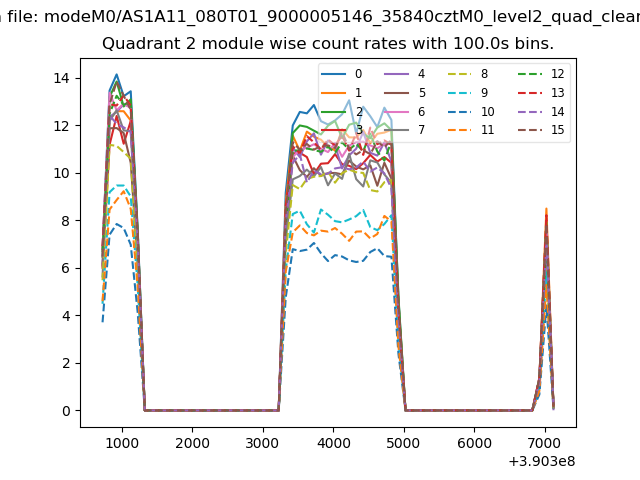 |
 |
| Module-wise count rates for Quadrant D Data is divided into 100 sec bins |
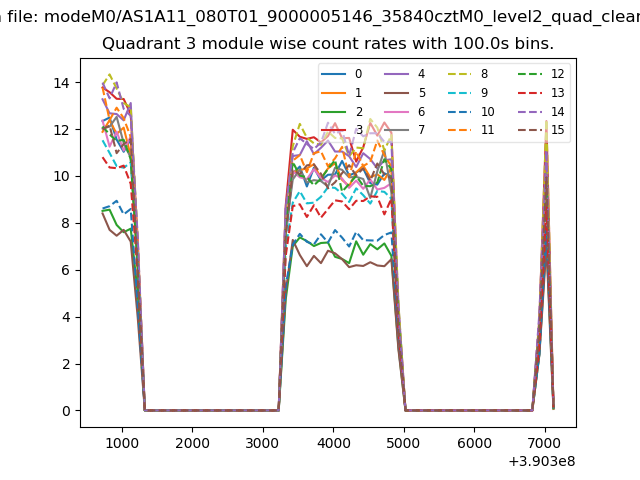 |
 |
| Parameter | Plot |
|---|---|
| CZT HV Monitor | 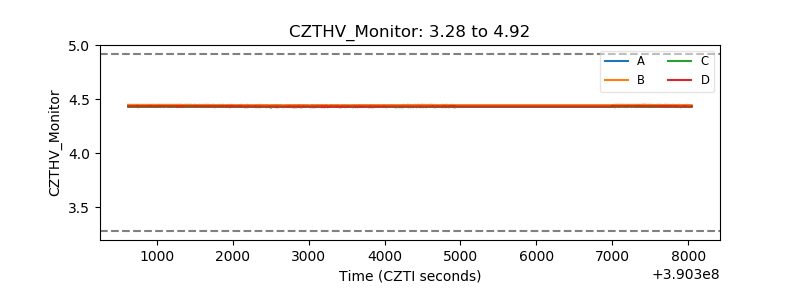 |
| D_VDD | 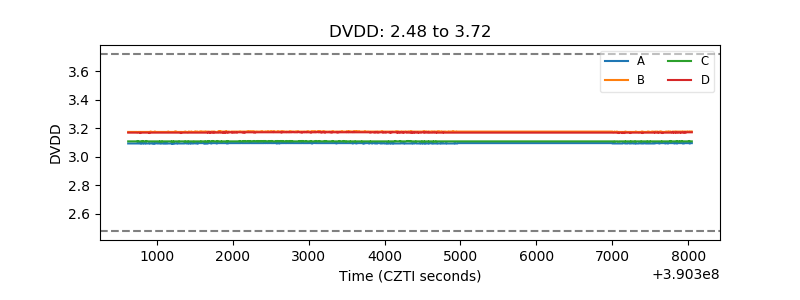 |
| Temperature 1 | 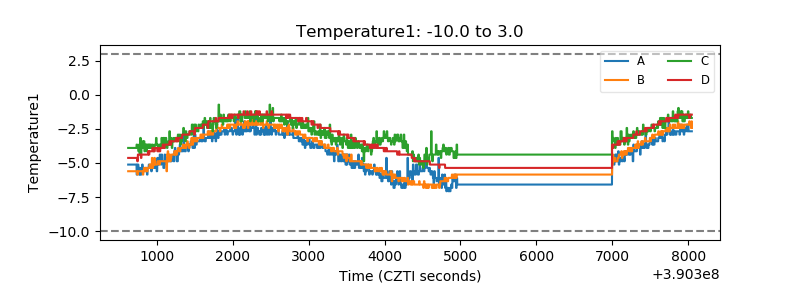 |
| Veto HV Monitor | 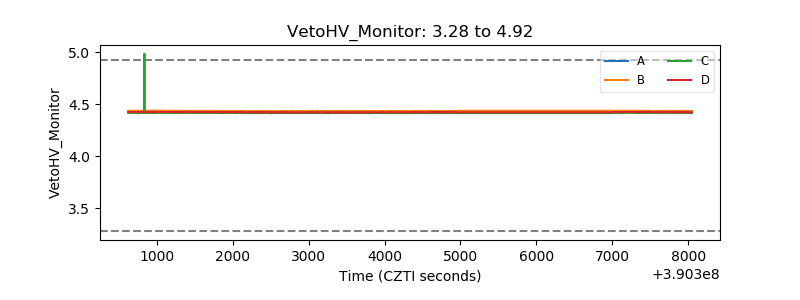 |
| Veto LLD | 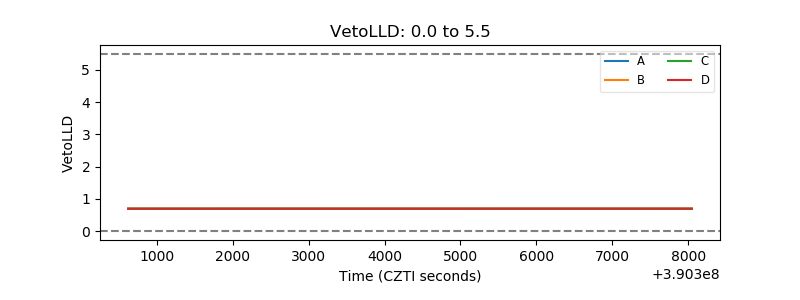 |
| Alpha Counter | 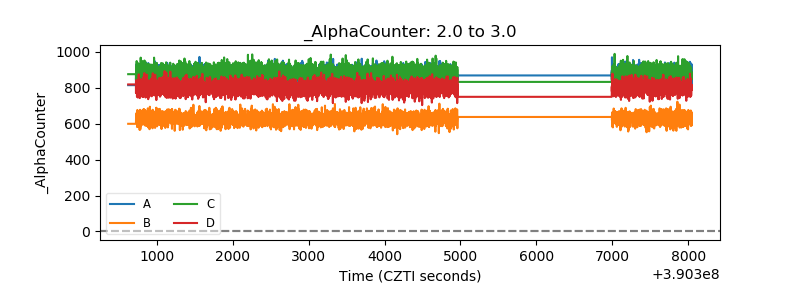 |
| _CPM_Rate | 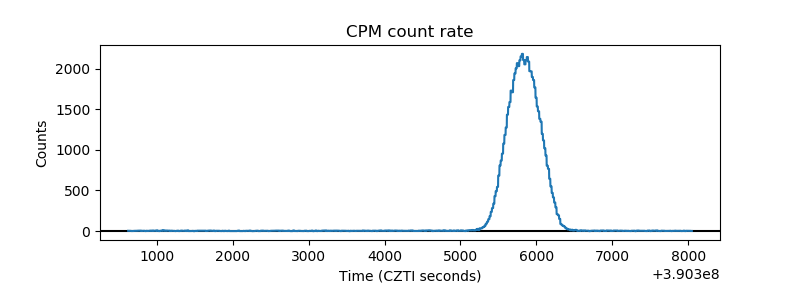 |
| CZT Counter | 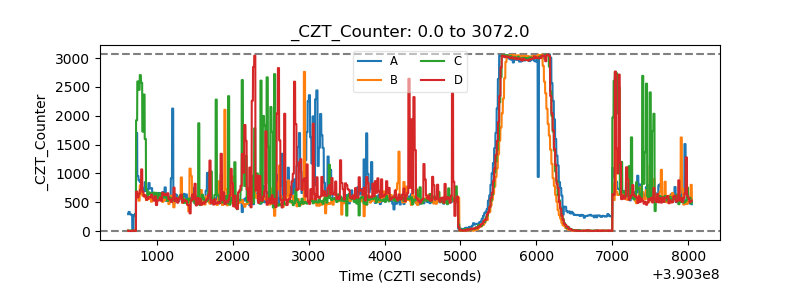 |
| +2.5 Volts monitor | 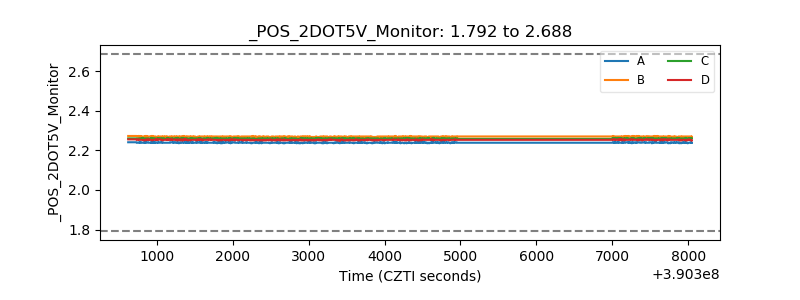 |
| +5 Volts monitor | 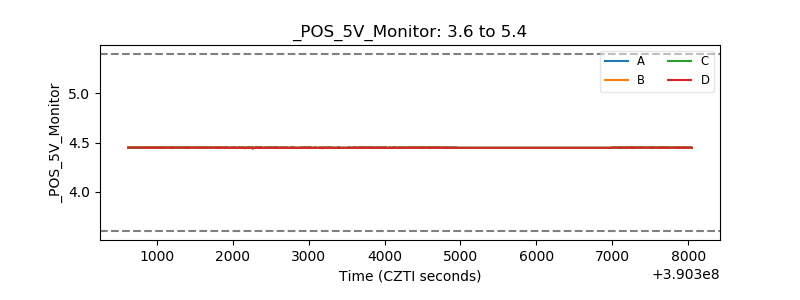 |
| _ROLL_ROT | 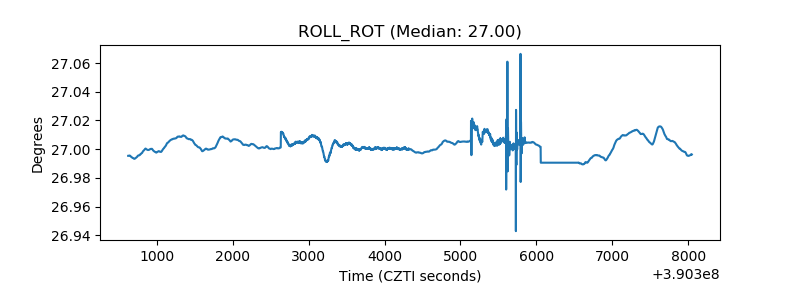 |
| _Roll_DEC | 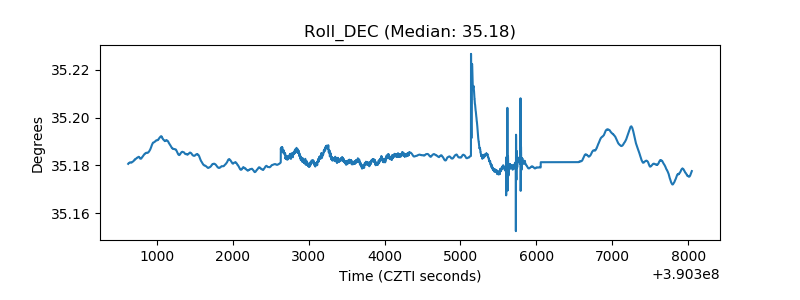 |
| _Roll_RA | 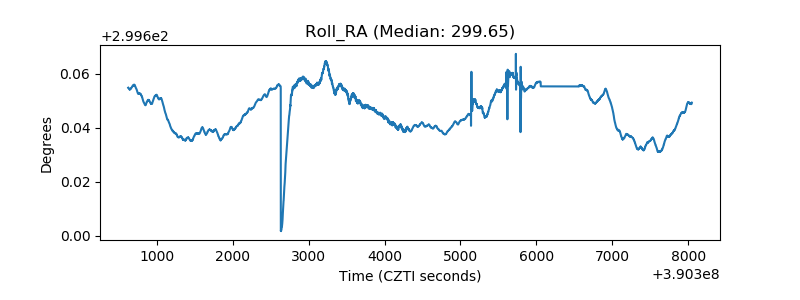 |
| Veto Counter | 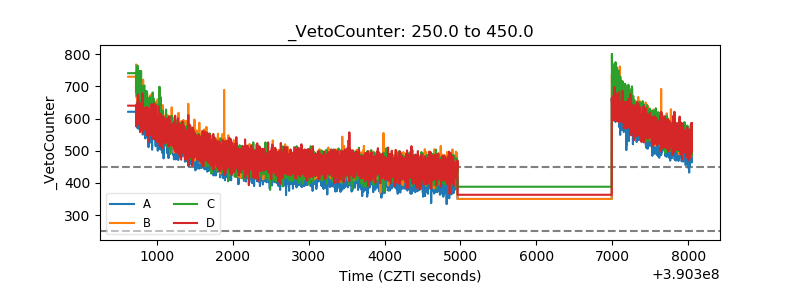 |