| Param | Original file | Final file |
|---|---|---|
| Filename | modeM0/AS1A11_080T01_9000005146_35838cztM0_level2.evt | modeM0/AS1A11_080T01_9000005146_35838cztM0_level2_quad_clean.evt |
| Size (bytes) | 153,558,720 | 28,313,280 |
| Size | 146.4 MB | 27.0 MB |
| Events in quadrant A | 1,042,044 | 180,470 |
| Events in quadrant B | 960,347 | 187,185 |
| Events in quadrant C | 1,080,388 | 179,663 |
| Events in quadrant D | 1,430,423 | 165,817 |
| Mode M9 | |||
|---|---|---|---|
| Quadrant | BADHDUFLAG | Total packets | Discarded packets |
| A | 0 | 6 | 0 |
| B | 0 | 6 | 0 |
| C | 0 | 6 | 0 |
| D | 0 | 7 | 0 |
| Mode SS | |||
|---|---|---|---|
| Quadrant | BADHDUFLAG | Total packets | Discarded packets |
| A | 0 | 70 | 34 |
| B | 0 | 70 | 30 |
| C | 0 | 70 | 30 |
| D | 0 | 71 | 27 |
| Mode M0 | |||
|---|---|---|---|
| Quadrant | BADHDUFLAG | Total packets | Discarded packets |
| A | 0 | 9641 | 5346 |
| B | 0 | 7263 | 3113 |
| C | 0 | 7541 | 3140 |
| D | 0 | 9779 | 4258 |
| Quadrant | Total seconds | Saturated seconds | Saturation percentage |
|---|---|---|---|
| A | 1959 | 7 | 0.357325% |
| B | 2013 | 4 | 0.198708% |
| C | 1990 | 24 | 1.206030% |
| D | 1938 | 95 | 4.901961% |
Noise dominated data is calculated using 1-second bins in cleaned event files. If a bin has >2000 counts, and if more than 50% of those come from <1% of pixels, then it is considered to be noise-dominated and hence unusable.
| Quadrant | # 1 sec bins | Bins with >0 counts | Bins with >2000 counts | High rate bins dominated by noise | Noise dominated (total time) | Noise dominated (detector-on time) | Marked lightcurve |
|---|---|---|---|---|---|---|---|
| A | 3386 | 2166 | 0 | 0 | 0.00% | 0.00% | 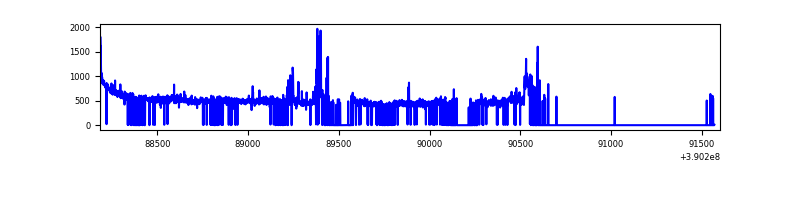 |
| B | 3415 | 2229 | 3 | 3 | 0.09% | 0.13% | 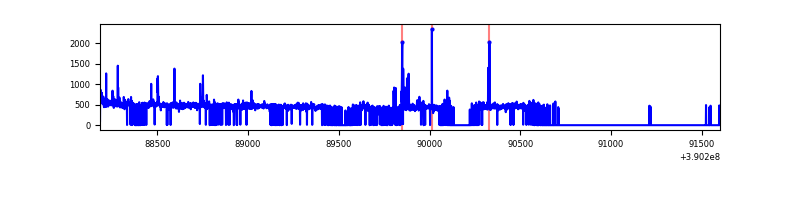 |
| C | 3406 | 2225 | 24 | 24 | 0.70% | 1.08% | 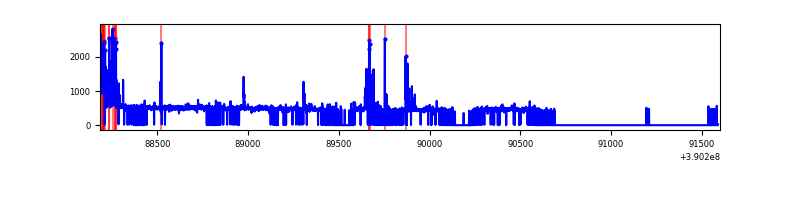 |
| D | 3387 | 2168 | 103 | 103 | 3.04% | 4.75% | 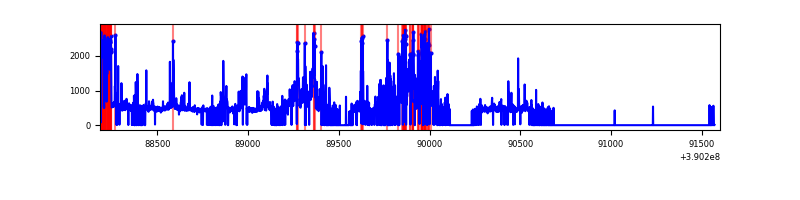 |
Top three noisy pixels from each quadrant. If the there are fewer than three noisy pixels in the level2.evt file, extra rows are filled as -1
| Pixel properties | Quadrant properties | ||||||
|---|---|---|---|---|---|---|---|
| Quadrant | DetID | PixID | Counts | Sigma | Mean | Median | Sigma |
| A | 15 | 169 | 84804 | 1767.57 | 229 | 226 | 47.8 |
| A | 10 | 83 | 66406 | 1383.07 | 229 | 226 | 47.8 |
| A | 13 | 254 | 2393 | 45.29 | 229 | 226 | 47.8 |
| B | 5 | 172 | 45248 | 951.28 | 231 | 226 | 47.3 |
| B | 12 | 111 | 5230 | 105.73 | 231 | 226 | 47.3 |
| B | 0 | 214 | 5033 | 101.57 | 231 | 226 | 47.3 |
| C | 15 | 214 | 84931 | 1621.21 | 219 | 221 | 52.3 |
| C | 0 | 10 | 83654 | 1596.77 | 219 | 221 | 52.3 |
| C | 15 | 208 | 56313 | 1073.51 | 219 | 221 | 52.3 |
| D | 7 | 223 | 388053 | 7319.57 | 212 | 208 | 53.0 |
| D | 2 | 153 | 97243 | 1831.28 | 212 | 208 | 53.0 |
| D | 2 | 250 | 47935 | 900.72 | 212 | 208 | 53.0 |
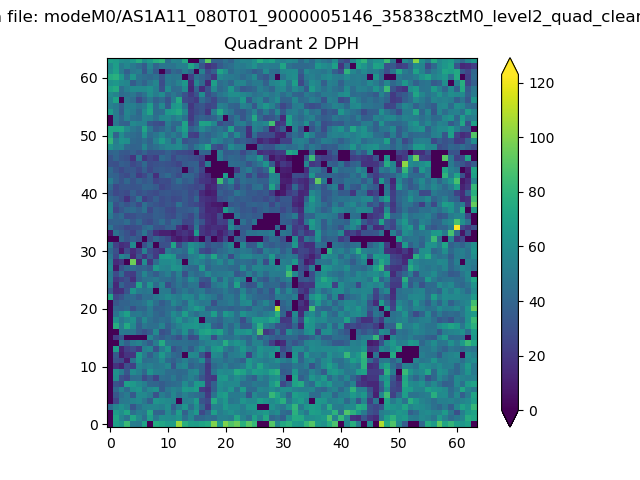
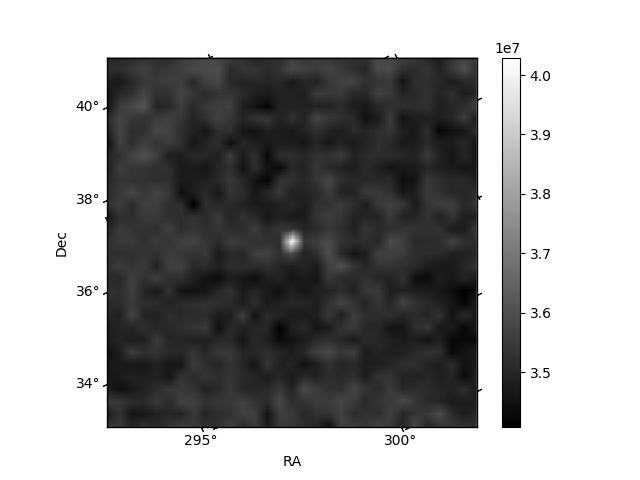
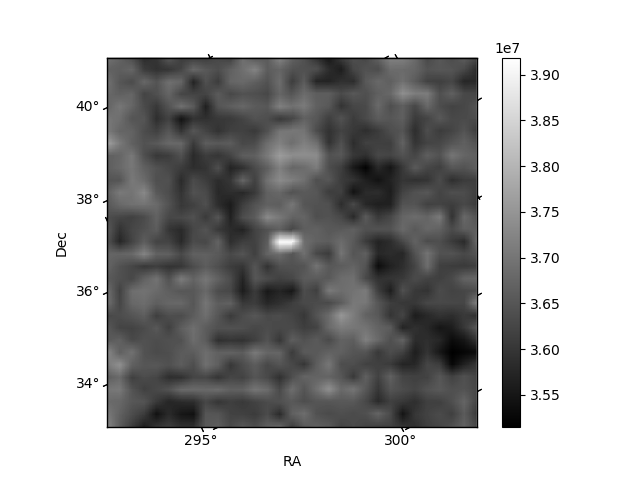
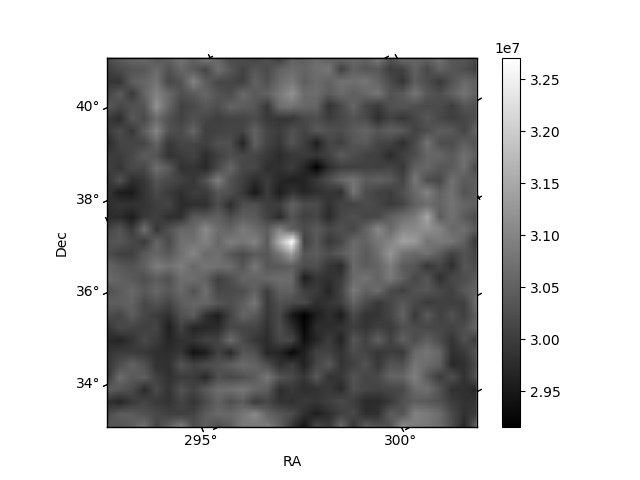
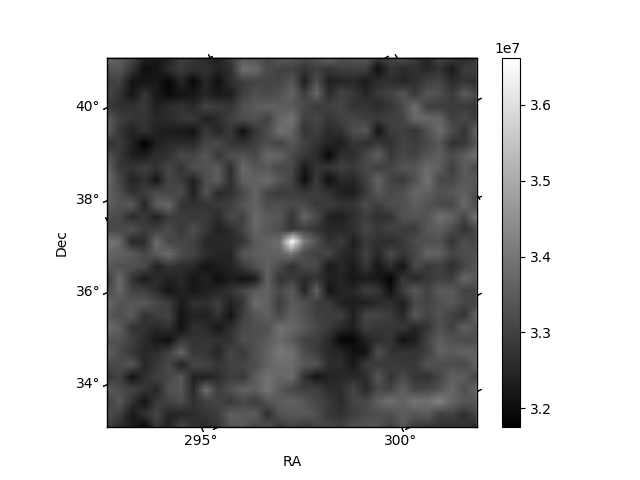
Histogram calculated using DETX and DETY for each event in the final _common_clean file
| Quadrant A | 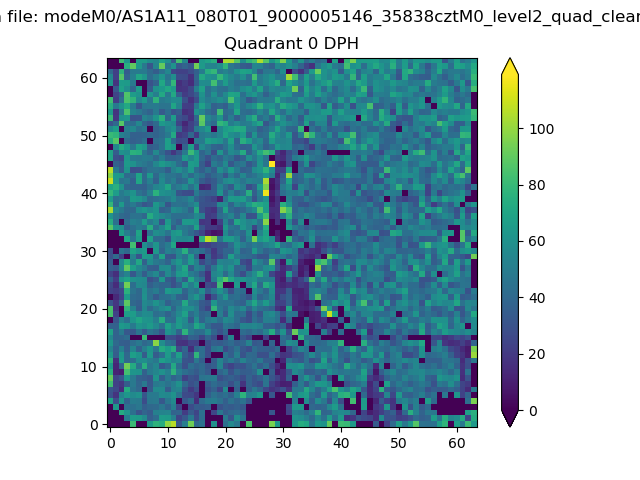 |
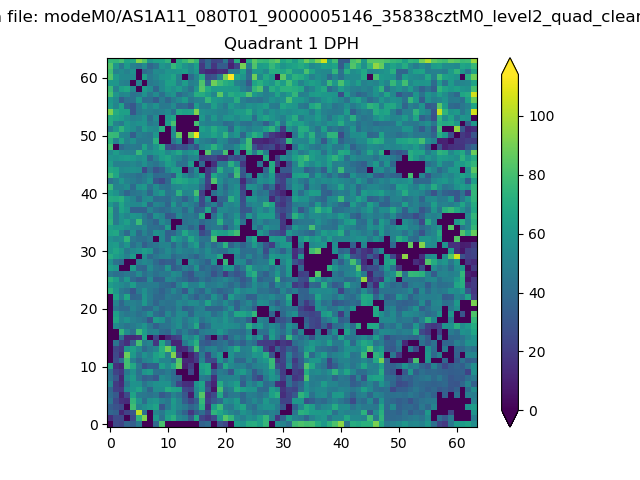 |
Quadrant B |
|---|---|---|---|
| Quadrant D | 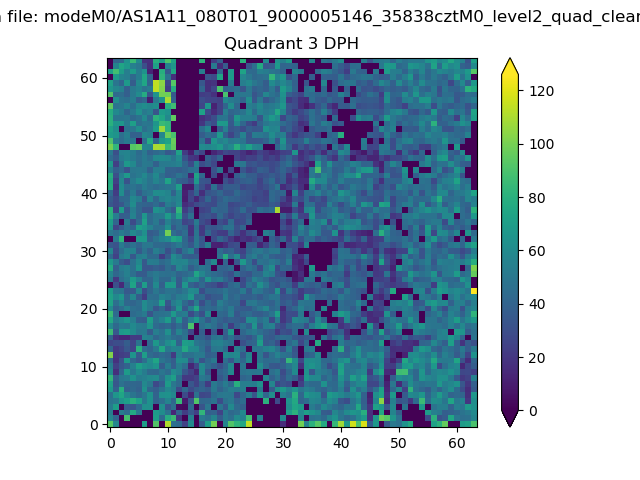 |
 |
Quadrant C |
| Plot type | Count rate plots | Images |
|---|---|---|
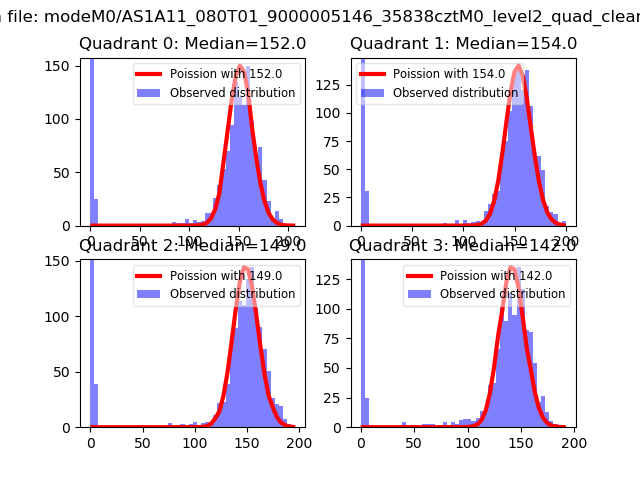
| Comparison with Poisson distribution Blue bars denote a histogram of data divided into 1 sec bins. Red curve is a Poisson curve with rate = median count rate of data. |
 |
 |
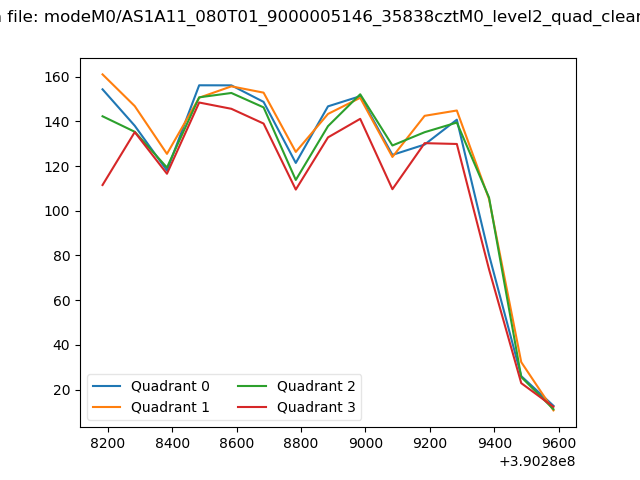
| Quadrant-wise count rates Data is divided into 100 sec bins |
 |
|
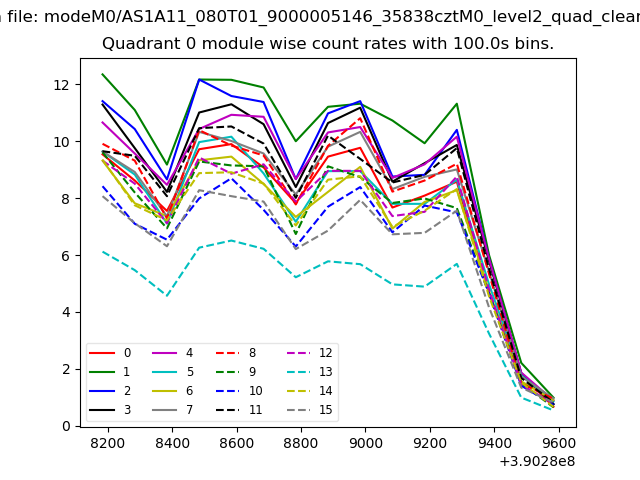
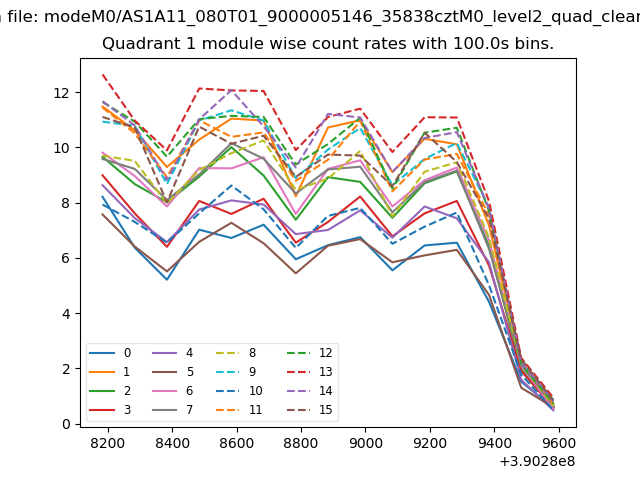
| Module-wise count rates for Quadrant A Data is divided into 100 sec bins |
 |
 |
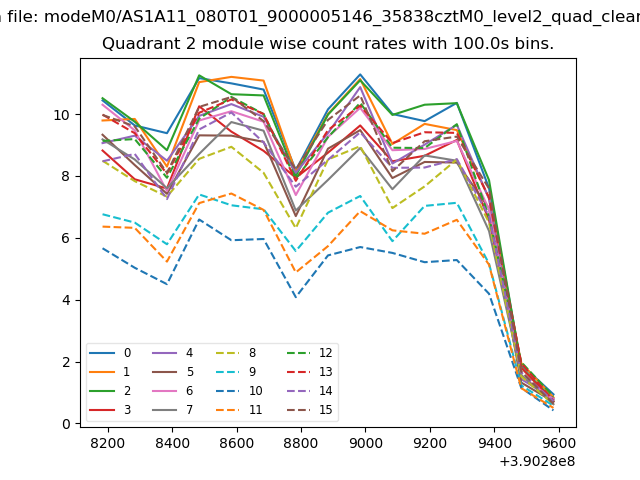
| Module-wise count rates for Quadrant B Data is divided into 100 sec bins |
 |
 |
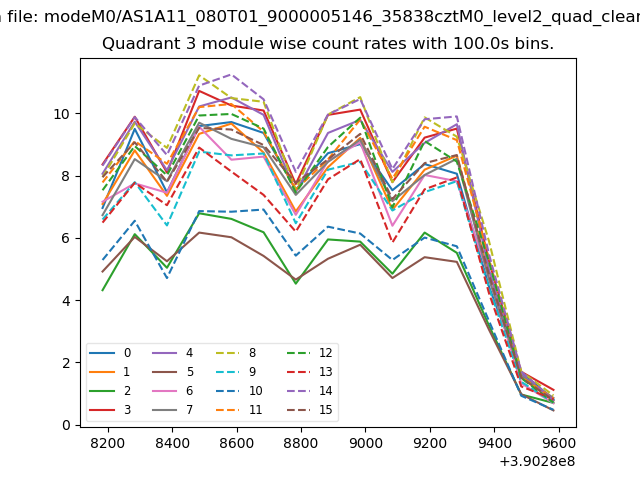
| Module-wise count rates for Quadrant C Data is divided into 100 sec bins |
 |
 |
| Module-wise count rates for Quadrant D Data is divided into 100 sec bins |
 |
 |
| Parameter | Plot |
|---|---|
| CZT HV Monitor | 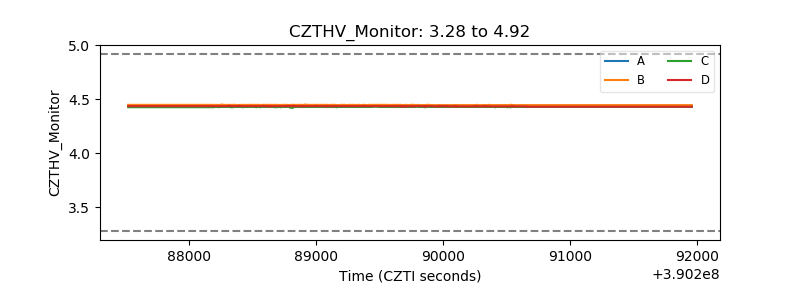 |
| D_VDD | 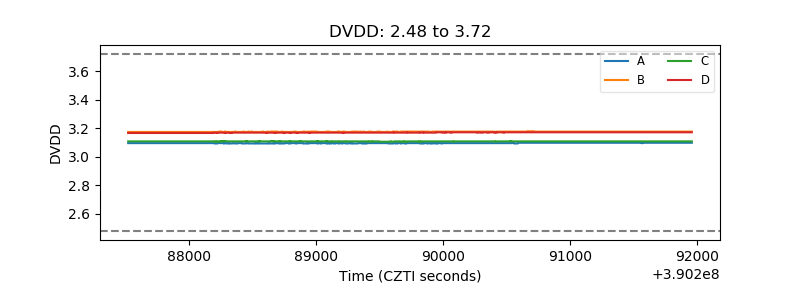 |
| Temperature 1 | 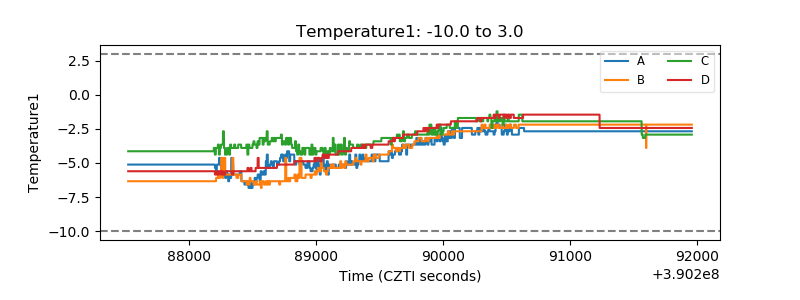 |
| Veto HV Monitor | 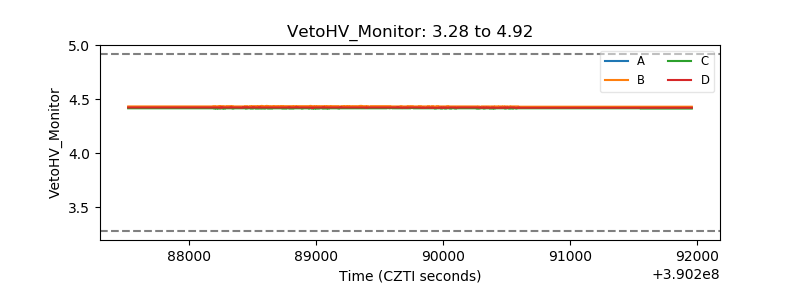 |
| Veto LLD | 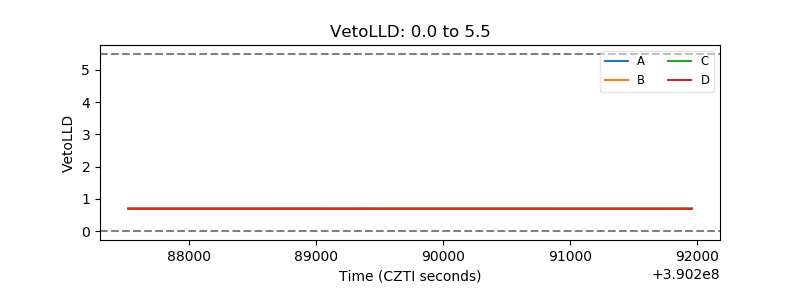 |
| Alpha Counter | 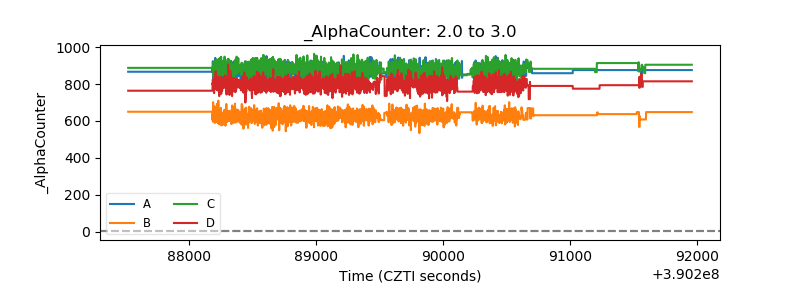 |
| _CPM_Rate | 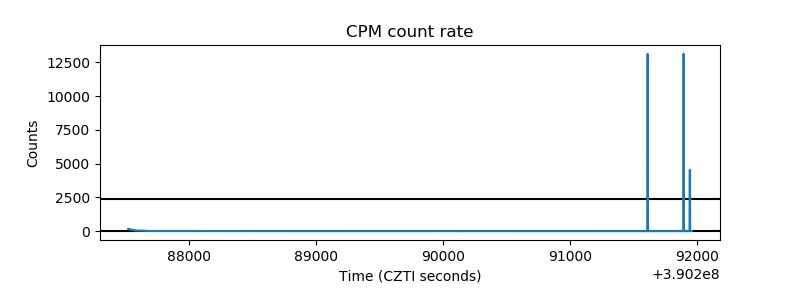 |
| CZT Counter | 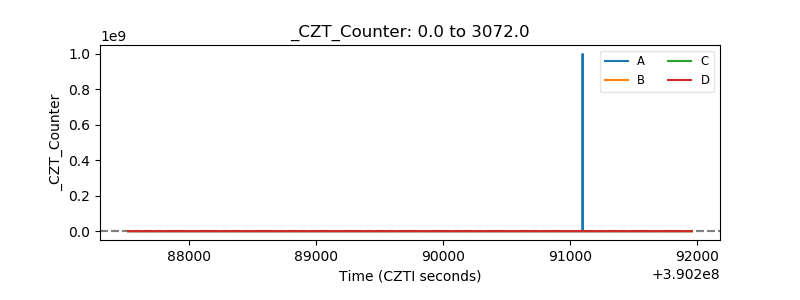 |
| +2.5 Volts monitor | 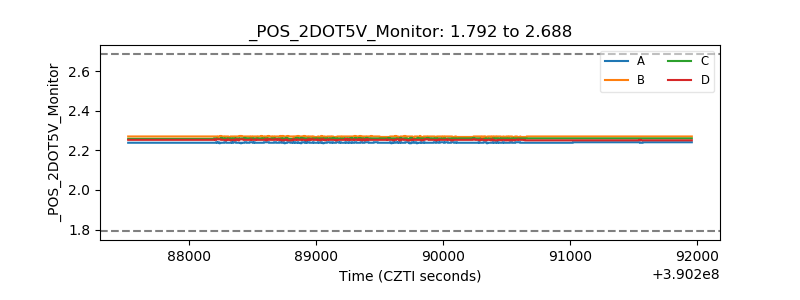 |
| +5 Volts monitor | 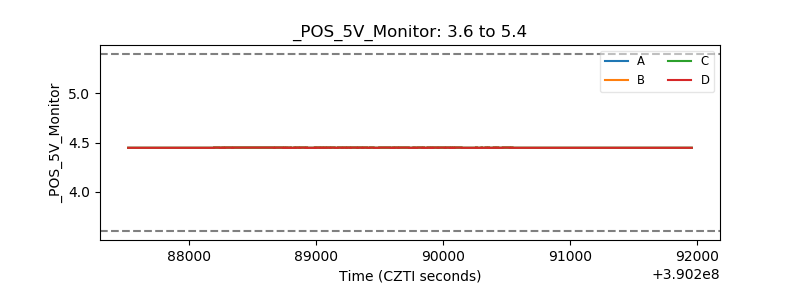 |
| _ROLL_ROT | 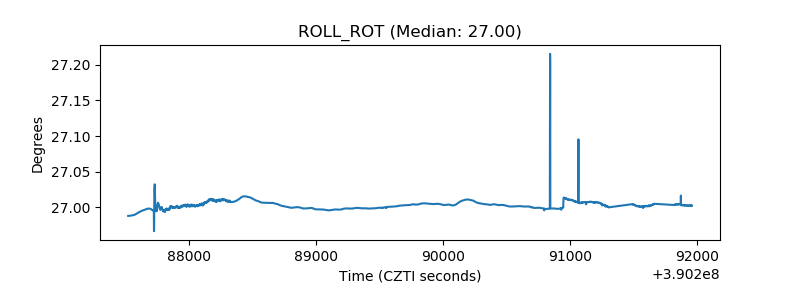 |
| _Roll_DEC | 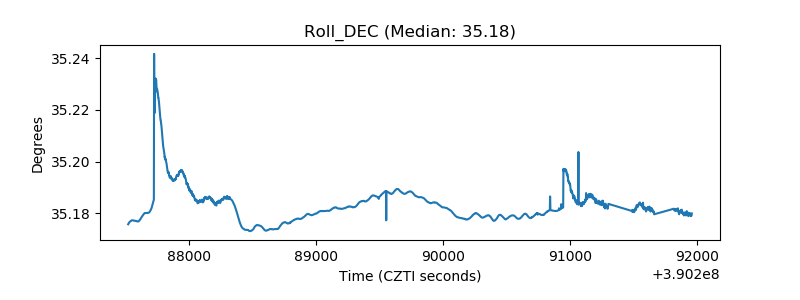 |
| _Roll_RA | 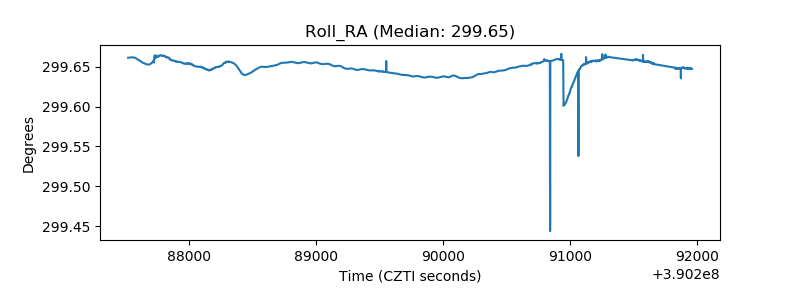 |
| Veto Counter | 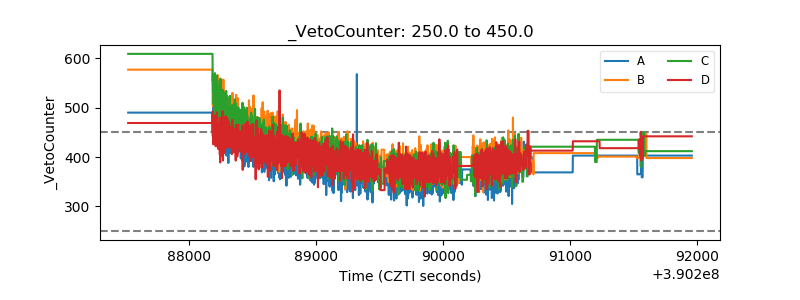 |